JOURNAL HOMEPAGE jsm.gig.eu ISSN 2300-3960
The English-language online version (primary, reference version of J. Sust. Min.)
J. Sust. Min. Vol. 12 (2013), No. 2, pp. 35–39
© Central Mining Institute 2013 http://dx.medra.org/10.7424/jsm130205
Received: 2013.05.17 Accepted: 2013.07.19 Available online: 2013.09.03
APPLICATION OF MARKAL MODEL GENERATOR IN OPTIMIZING ENERGY SYSTEMS
Joanna Krzemie
ń
Department of Energy Saving and Air Protection, Central Mining Institute (Katowice, Poland)
Corresponding author: [email protected], tel. +48 32 259 27 53, fax: +48 32 259 22 67
Abstract
The main objectives of European energy policy include: security of energy supply, reduction of greenhouse gas emissions and the development of efficient and clean energy technologies. The obligation to fulfil these objectives is connected, among others, with the optimization of the development of all energy system i.e. a group of facilities and equipment for the collection, transmission, processing, distribution and use of energy in all its forms. Computer programs such as MARKAL, TIMES, ENPEP, MIDAS are the basic tools for modelling different energy systems. Various simulation, optimization and macro models are created with them. Multi-criteria methods are also used. In this paper the use of MARKAL as a tool for the optimization of an energy system was the matter of research. The article presents the characteristics of MARKAL. Additionally, it includes an example of the use of the program to create a model of the supply of heat for the province of Silesia together with its results.
Keywords
MARKAL, energy modelling, optimization, energy system
1. INTRODUCTION
One of the main elements supporting a decision making process is optimization; a process of determining the best possible solution according to certain criteria. As a result of optimizing a certain system we obtain the desired effect and choose the best possible scenario which ensures it is carried out efficiently.
The most often used criteria include: an economic effect, an environmental effect and a social effect. The criterion is referred to as an objective function. The function is one of the basic ele-ments of a mathematical optimization model. Other eleele-ments include, among others, decision making variables, other parame-ters describing the system and constraints (Pikoń 2011).
The objective function describes the desired target; deci-sion making variables are tools at our disposal to help us reach these targets. In turn, constraints are logical and physi-cal associations which may come into play while reaching the target. If a model has two variables, finding a solution is easy. When calculations are more complex, computer pro-grams are applied.
The article was devoted to optimizing energy systems di-rectly linked with other branches of national economy.
The basic aim of an energy system is to meet the demand, both quantitative and qualitative, of energy consumers. Ener-gy needs should be met in a continuous and uninterrupted fashion. An energy system includes facilities for: obtaining energy, its processing, transmissions, distribution and usage. An energy system consists of the following subsystems:
• electricity
• heat – power
• gas energy
• solid fuels
• liquid fuels
The above mentioned subsystems form the national fuel energy industry (Ziębik, Szargut 1995).
The tools to model energy systems are e.g.:
• EFOM-ENV/GAMS – Energy Flow Optimization Model – Environmental, developed in Belgium for the European Commission (Kruijn 1994)
• TIMES – The Integrated MARKAL-EFOM System, de-veloped by The Energy Technology Systems Programme (ETSAP), The International Energy Agency (IEA), France1
• MARKAL – MARKet ALlocation, developed by The Energy Technology Systems Programme (ETSAP), The International Energy Agency (IEA), France (Loulou, Goldstein, Noble 2004)
• MESSAGE III – Model of Energy Supply Systems Alter-natives and General Environmental Impacts, developed by The International Institute for Applied Systems Analy-sis, Austria2
• ENPEP – Energy and Power Evaluation Program, devel-oped by The International Atomic Energy Agency (IAEA), Austria, with several technical modules e.g. MACRO-E, MAED, BALANCE, LOAD, WASP-IV (IAEA 2001) 1 http://www.iea-etsap.org/web/applicationGlobal.asp 2 http://webarchive.iiasa.ac.at/Research/ECS/docs/models.html
• MIDAS – Mobile Integrated Dynamic Analysis System, developed at The National Technical University of Ath-ens, Greece (Capros et al. 1995)
This article concentrates on modelling with the MARKAL package, which uses the ANSWER system supporting the work of the MARKAL generator in model analyses.
2. CHARACTERISTICS OF THE MARKAL PROGRAM
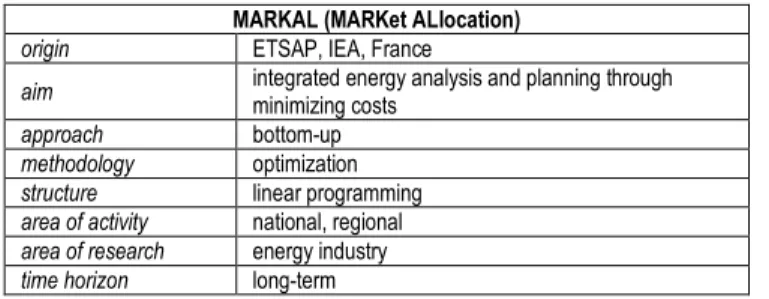
MARKAL is a dynamic program with a wide range of possible applications used for energy and environment plan-ning in various areas of activity. The characteristics of the MARKAL program are presented in Table .
Table 1. Characteristics of the MARKAL program (Seebregts, Goldstein, Smekens
2000)
MARKAL (MARKet ALlocation)
origin ETSAP, IEA, France
aim integrated energy analysis and planning through minimizing costs
approach bottom-up
methodology optimization
structure linear programming
area of activity national, regional
area of research energy industry
time horizon long-term
MARKAL is an optimization tool based on linear pro-gramming. Its aim is to find the optimum value of a linear objective function for one or many variables while taking into consideration the assumed constraints. The objective function is the discounted total of the updated values of yearly costs generated by an energy system taking into account all the years of the considered time horizon and regions (Jaskólski 2005). The flow of yearly costs includes incurred investment costs, fixed maintenance costs, variables (the cost of materi-als, purchasing energy carriers, supply costs), as well as the costs of using the environment. Income from sales of e.g. energy and goods beyond the researched area is deducted from the determined yearly costs.
The use of MARKAL is associated with a necessity to be-come familiar with the different markings of symbols: pa-rameters used in the program, the names of different technol-ogies, energy carriers, etc., which are defined with abbrevia-tions, making the structure of the model unclear, especially during initial contact with the software. The symbols are presented in Table .
Table 2. Description of symbols used in the model
IMP supply source: import RNW supply source: renewable BIO biomass
HCO hard coal
NGA methane-rich natural gas OLL fuel oil (light, heavy) OTH other fuels ELC electricity
LTH heat (public power stations and CHP stations, public heating plants) L2H heat (industrial CHP stations, non-public heating plants)
L3H heat (local boiler houses and individual installations) RIB heat demand – industry and construction RRES heat demand – households
RTRN heat demand – transport and storage RCOM heat demand – other users RRES1,
RCOM1, RTRN1, RIB1
technologies appropriate for heat demand in given sectors (LTH)
RRES2, RCOM2, RTRN2, RIB2
technologies appropriate for heat demand in given sectors (L2H) RRES3 technologies appropriate for heat demand in given sectors (L3H) RELC electric heating plants (decentralised)
RLIQ liquid fuel heating plants (decentralised) RGAZ gas fuel heating plants (decentralised) RSOL solid fuel heating plants (decentralised) RBIO biomass fuel heating plants (decentralised)
H10 public power stations and public CHP stations (+ public heating boilers) H20 industrial CHP stations
H30 public heating plants H40 non-public heating plants
MARKAL does not contain an in-built database. That is why the user is obliged to enter a number of input parame-ters. The program contains qualitative information (e.g. the energy carrier types, technology types) and quantitative in-formation (parameters characteristic of the technologies used etc.). In MARKAL, apart from conversion Technologies, there are also demand technologies and a group of technolo-gies referred to as processes. The model chooses the combi-nation of technologies which minimizes the total costs of the energy system. In each case, the model finds the cheapest mix of technologies and energy carriers to meet the energy demand. The energy demand can be divided into sectors e.g. services, industry, household, agriculture, transport; or according to the type of energy used i.e. central heating, hot water, cooling. There is also a so-called, non-energy demand.
MARKAL provides the possibility of using it to:
• identify the least costly energy systems and cost-efficient methods for limiting the emission of substances harmful for the natural environment
• prepare long-term analyses of energy balance for various scenarios
• evaluate new technologies and identify priorities for fur-ther research and development works
• evaluate the consequences of introduced regulations, tax system, subsidies and other payments
• evaluate projects associated with greenhouse gas emis-sions
• estimate the value of regional cooperation (Answer… 2004)
3. REFERENCE ENERGY SYSTEM (RES)
One of the first steps associated with building a model with the MARKAL program is preparing so-called Reference Energy System (RES). The RES may be described as a network of energy resources and energy demand. In other words, it is a graphic scheme reflecting a model, its elements and complexity. The RES presents the flow of energy, start-ing from the energy contained in fuels, through its conversion with selected Technologies, to fulfilling energy needs. A block diagram of the Reference Energy System is present-ed in Figure 1.
Fig. 1. A block diagram of the Reference Energy System
ENERGY CARR-RIERS/SUPP LY SOURCE PROCESSES CONVERSION TECHNOLOGIES DEMAND TECHNOLOGIES DEMAND
4. EXAMPLE OF APPLICATION OF THE MARKAL PROGRAM
For the research analysis of the MARKAL program appli-cations to optimize energy systems, a model concerning heat supply for Silesia was prepared. Building an energy model for a certain area e.g. a region, is associated with several problems. The user determines the area, most often the same as the administrative division, yet in fact the flow of energy is not limited by these boundaries. Electricity produced in one area is sent along the grid to other areas – in the Silesia Pro-vince numerous supra-regional main power stations are locat-ed. The national energy system co-operates with international systems too. Due to technical and economic limitations asso-ciated with the low effectiveness of the transfer of heat carri-ers over long distance, the heat market is usually a local one. That is why the article is focused mainly on the model of heat supply. Another difficulty is obtaining data concerning the local energy supply system. Very often energy models are limited to the optimization of production, completely ignor-ing transmission and distribution stages e.g. models based on the RES MARKAL type.
4.1. Model Assumptions
Assumptions for a model of heat distribution for Silesia: Region: Silesia Province
Time horizon of the model: 2005–2030, divided into six 5-year-long periods, each year is a year of calculation in the program.
Energy carriers/supply source: hard coal, methane-rich natural gas, fuel oil (light, heavy), biomass, other fuels (marked in the program as OTH), electricity, heat divided according to energy sources. Imports was selected as the basic option of obtaining energy carriers, except for biomass, which was attributed the ‘renewable’ label.
Conversion Technologies: in the discussed model for cen-tralised heat, the conversion technologies were divided ac-cording to the guidelines of Agencja Rynku Energii S.A. (The Energy Market Agency) (Statystyka… 2006–2011; 2008–2011). Public power stations and public CHP stations (+ public heating boilers) were classified as H10, industrial CHP stations as H20, public heating plants – H30, the last group of technologies are non-public heating plants – H40.
General Data: discount rate of 6% (real interest rate of capital).
In the discussed model the economic criterion was as-sumed, i.e. minimizing objective function which ensures the lowest costs of production, conversion, transmission and distribution of heat.
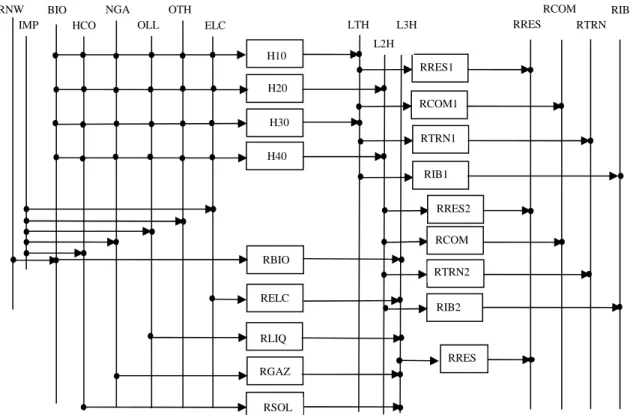
The Reference Energy System presented in Figure 2.
Fig. 2. The Reference Energy System for the presented model
4.2. Calculations and descriptions
The calculations made while building the model included: technical-economic characteristics for conversion technolo-gies: H10, H20, H30, H40, RSOL, RGAZ, RLIQ, RBIO, RELC were used. The efficiency of heat distribution in each season was determined. Maintenance costs associated with the electricity distribution network and the transmission
in-frastructure were introduced. Investments into the heat transmission network and the fixed maintenance costs of heat transmission infrastructure were also taken into considera-tion. The aging of heating plants and CHP stations was de-termined. Maximum constraints on the power and maximum and minimum constraints on the produced heat were deter-mined. Constraints on the share of certain types of heat (LTH, L2H, L3H) and such technologies as RSOL, RGAZ,
RCOM RRES RTRN RIB LTH ELC OLL OTH IMP NGA BIO RNW H10 H20 H30 H40 RLIQ RGAZ RELC RSOL RIB1 RTRN1 RCOM1 RRES1 L2H L3H RIB2 RRES 3 RBIO HCO RRES2 RCOM 2 RTRN2
RLIQ (according to the data of GUS concerning the con-sumption of fuels in households) were implemented (Zużycie… 2006–2010). RBIO and RELC technologies were treated as technologies which balance heat production and heat demand.
The data necessary to build a model of heat supply for Si-lesia came mainly from analyses prepared by Agencja Rynku Energii S.A. (The Energy Market Agency), Urząd Regulacji Energetyki (The Energy Regulatory Office) and Główny Urząd Statystyczny (GUS) (The Central Statistics Office) (Statystyka… 2006–2011; 2008–2011; Aktualizacja… 2011; Zużycie… 2007–2011; 2012; Infrastruktura… 2006–2012; Energetyka… 2009–2011). Gas and dust emission fee rates were taken from the Ordinance of the Minister of the Envi-ronment (Obwieszczenie…. 2011).
4.3. Results and discussion
As a result of optimizing the model, the best option of ob-taining heat in Silesia until 2030 was obtained. According to the planned structure of heat supply prepared with MARKAL program, the dominant fuel to produce heat in Silesia until 2030 will remain hard coal. The program proposed techno-logical options based on hard coal, which ensures the lowest cost of the entire energy system. Hard coal is the cheapest energy carrier which is reflected in the competitiveness of technologies producing heat with this fuel. The domination of hard coal over other types of fuel results also from the availa-bility of it in the considered model area (the vicinity of hard coal seams) and the already existing infrastructure (coal sup-ply system, coal heaps, etc.). Nowadays, Silesia is the largest consumer of hard coal in Poland, nearly 30% of national consumption, in the case of natural gas the share is 10% (Zużycie… 2011). The prices of network heat in large urban agglomerations are usually cheaper than the average national prices. The risk of increased price of hard coal in relation to the prices of gas in the analysed period is also definitely lower (Aktualizacja… 2011). Other arguments for the coal option include: social issues, protecting employment in the local mining industry, lack of risk of interruptions in hard coal supply and political risk in relation to gas as well as the present and future agreements between electricity/heat pro-ducers and collieries. The next position among the fuels used in producing heat in Silesia is occupied by gas fuels with a share of over 10% throughout the analysed period. In the case of oil, the program showed a systematic decreasing tendency (from 7% in the base year to 2% in 2030).
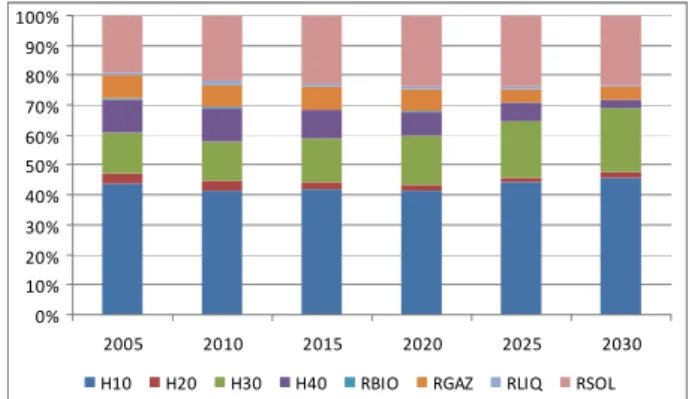
Public energy facilities have the highest share in producing heat in Silesia. In the upcoming years, the share of public heating plants will increase. The structure of heat production for the centralised sources is presented in Figure 3.
The structure of installed heat sources is presented in Fig-ure 4.
A very important issue in modelling with MARKAL is a detailed projection of the energy system and considering all options and future trends which may influence the energy structure of the analysed model area. For example, sources of heat of output power ≥20 MW using fossil fuels are obliged to buy CO2 Emission Allowances in the market. The obliga-tion to buy the allowances in aucobliga-tions will increase the prices of heat. The biggest increase in the prices will be observed for sources using coal at the end of the time horizon of the
analysed model1. That is why it is recommended to expand the model through considering all the factors, together with plausible and available in the future technologies and fuels e.g. local shale gas.
0% 10% 20% 30% 40% 50% 60% 70% 80% 90% 100% 2005 2010 2015 2020 2025 2030 H10 H20 H30 H40
Fig. 3. The structure of heat production for centralized sources in Silesia until 2030,
% where: H10 – public power stations and public CHP stations (+ public heating boilers), H20 – industrial CHP stations, H30 – public heating plants, H40 – non-public heating plants 0% 10% 20% 30% 40% 50% 60% 70% 80% 90% 100% 2005 2010 2015 2020 2025 2030
H10 H20 H30 H40 RBIO RGAZ RLIQ RSOL
Fig. 4. The structure of installed power generative heat sources until 2030, Silesia, %
where: H10 – public power stations and public CHP stations (+ public heating boilers), RBIO – biomass heating plants (decentralized), H20 – industrial CHP stations, RGAZ – gas fuel heating plants (decentralized), H30 – public heating plants, RLIQ – liquid fuel heating plants (decentralized), H40 – non-public heating plants, RSOL – solid fuel heating plants (decentralized)
5. CONCLUSIONS
MARKAL was devised to optimize the development of energy systems at different levels: national and regional. The results of modelling with MARKAL is a valuable source of information in a decision making process, especially for analysts and decision makers, as it allows users to evaluate the consequences of changes in the economy of a given area.
To choose the least costly configuration of the tested ener-gy system, user must provide complete and detailed data concerning the analysed system. Preparing a complete data-base for an analysed energy system in a MARKAL model is time consuming however, which is a major disadvantage of the MARKAL program and most other optimization models.
MARKAL models concern long-term time horizon, that is why it is necessary to prepare forecasts of e.g. electricity demand, heat demand, property rights to certificates of ener-gy origin, which requires knowledge of the methodoloener-gy
1
applied to prepare the energy forecasts i.e. MAED model, BALANCE or using regression methods. In the long-term horizon energy demand is associated mainly with economic development, energy efficiency and population. It also de-pends on weather conditions. Preparing energy demand fore-casts requires considering all factors which can influence the amount of energy and cost of its production.
The MARKAL program, because of its mathematical structure, based on linear programming, chooses one techno-logical option, ignoring other ones when there are no defined constraints (e.g. associated with environmental impact). The obtained results of modelling confirm the character of pro-gramming. The model chose options based on hard coal as the main priority in the regional structure of the energy sys-tem. Technological options can be implemented to ensure the lowest costs for the entire energy system. Because of the simplified structure of the model, the presented results are only for showcase purposes and they cannot be treated as a foundation for a strategy to develop a heat system in Sile-sia.
Acknowledgements
This article is part of an undertaking funded under the statutory activity of the Central Mining Institute in Poland. Project No. 11410322-322 entitled “Research analysis of building of the energy models in the MARKAL program”.
References
1. Aktualizacja prognozy zapotrzebowania na paliwa i energię do roku 2030 (Updated Forecasts of Demand for Fuel and Energy by 2030). Warszawa, Agencja Rynku Energii SA 2011. 2. ANSWER v6 MARKAL, User Manual. Noble-Soft Systems
Pty Ltd. 2004.
3. Capros P, Kokkolakis E., Mantzos L., Antoniou Y., Atsabes G. (1995): Midas 5.1 for EU-15. Model description.
4. Energetyka cieplna w liczbach w latach 2008–2010 (Heat Industry in Numbers 2008–2010). Warszawa, Urząd Regulacji Energetyki 2009–2011.
5. IAEA (2001): International Atomic Energy Agency – Green-house Gas Mitigation Analysis Using ENPEP. A modeling guide. Vienna, Austria.
6. Infrastruktura Komunalna w latach 2005–2010 (Municipal Infrastructure in 2005–2010). Warszawa, Główny Urząd Staty-styczny 2006–2012.
7. Jaskólski M. (2005): MARKAL – model matematyczny (MARKAL – Mathematical Model). Gdańsk, Politechnika Gdańska (niepublikowane).
8. Kruijn H. (1994): The EU Energy and Environmental Model EFOM-ENV Specified in Gams. Model description and users guide.
9. Loulou R., Goldstein G., Noble K. (2004): Energy Technology Systems Analysis Programme. Documentation for the MARKAL Family of Models.
10. Obwieszczenie Ministra Środowiska z dnia 4 października 2010 r. w sprawie wysokości stawek opłat za korzystanie ze środowiska na rok 2011 (The Ordinance of the Minister of the Environment of 4 October 2010 on the fee rates for the use of the environment in 2011). M.P. 2010 No 74, poz. 945.
11. Pikoń K. (2011): Model wielokryterialnej analizy ś rodowisko-wej złożonych układów technologicznych (Model of Multi-Criteria Environmental Analysis of Complex Technological Systems). Gliwice, Wydaw. Politechniki Śląskiej.
12. Seebregts A.J., Goldstein G.A., Smekens K. (2000): Ener-gy/Environmental Modeling with the MARKAL Family of Models. Washington, International Resources Group.
13. Statystyka Ciepłownictwa Polskiego (2007–2010) (Statistics of Polish Heat System). Warszawa, Agencja Rynku Energii (ARE) SA, 2008–2011.
14. Statystyka Elektroenergetyki Polskiej (2005–2010) (Statistics of Polish Power System). Warszawa, Agencja Rynku Energii (ARE) SA 2006–2011.
15. Ziębik A., Szargut J. (1995): Podstawy gospodarki energetycz-nej (The Basics of Energy Management). Gliwice, Politechnika Śląska.
16. Zużycie energii w gospodarstwach domowych w 2009 r. (Energy Consumption in Households in 2009). Warszawa, Główny Urząd Statystyczny 2012.
17. Zużycie paliw i nośników energii w latach 2006–2010 (Fuel and Energy Carrier Consumption in 2006–2010). Warszawa, Główny Urząd Statystyczny 2007–2011.