Cross-Border Trade and FDI in Services
byCarmen FILLAT-CASTEJÓN
Joseph FRANCOIS
*)Julia WOERZ
Working Paper No. 0812
September 2008
D
DE
E
P
P
A
A
R
R
T
T
M
M
E
E
N
N
T
T
O
O
F
F
EC
E
C
O
O
N
N
O
O
M
M
I
I
C
C
S
S
J
JO
OHHAANNNNEESSKE
K
EPPLLEERRU
UN
NIIVVEERRSSIITTYY OOFFL
LI
INNZZJohannes Kepler University of Linz Department of Economics
Altenberger Strasse 69 A-4040 Linz - Auhof, Austria www.econ.jku.at
*)
Cross-Border Trade and FDI in Services
Carmen Fillat-Castejón
University of Zaragoza
Joseph F. Francois
CEPR and University of Linz
Julia Woerz
Oesterreichische Nationalbank , Foreign Research Division
September 2008
Abstract: Working with a panel dataset of of OECD countries over the decade 1994-2004, we
examine linkages between cross-border trade and FDI in the service sectors. We first develop a
consistent analytical framework for the application of the gravity model jointly to services trade
and commercial presence (i.e. FDI), using a composite model of delivery that offers testable
hypotheses about the roles of different modes of services supply as complements or substitutes.
We further link our estimates to policy variables measuring market regulations that may act
directly or implicitly as barriers to trade. We find robust evidence of complementary effects in
the short-run, which is reinforced in the long run by an increased potential for cross-border
imports based on previous FDI inflows. A detailed analysis by individual service sectors
highlights business, communication and financial services as showing the largest potential for
cross-border trade when market regulations are reduced and when commercial presence
increases.
Keywords: FDI, imports, services, panel data, substitution and complementary effects.
JEL codes: F10, F14, F21
This research has benefited from support from the Stichting IIDE, the World Bank, and the wiiw (Vienna). All opinions expressed herein are of course those of the authors, and are not meant to reflect the position or opinion of any institution with which any of the authors have been or are currently affiliated. Address for correspondence: Prof. J. Francois, Dept of Economics, University of Linz,
1.
Introduction
Whether or not cross-border trade and foreign direct investment (FDI) act as complements or substitutes in delivering goods across borders is not a new question. What is new in the literature is a recent attention to services, as distinct from goods. Fontagné and Pajot (1999) provide a comprehensive overview of the rich pool of literature dealing with the subject as it relates to goods. They stress that this relationship depends on the level of analysis. At the firm level one will expect them to be substitutes, while there are compelling reasons - based on New Trade Theory arguments - for a complementary relationship at the macro-level (Pfaffermayr 1996). Given these distinctions, which are extended in Egger and Pfaffermayr (2005) to include further the magnitude of plant set-up costs compared to trade costs, the empirical findings up to date have remained inconclusive. Fontagné and Pajot (1999) have ascribed this to a confusion of effects at different levels of the economy (firm, industry and macro level) and to differences between vertical and horizontal FDI, two points that are both widely accepted in the literature (Zarotiadis and Mylonidis 2005, Egger and Pfaffermayr 2005, among others). Reading through the empirical literature suggests that the case for complementarity between trade and FDI is stronger for vertical FDI and rather low trade costs. This is intuitively compelling given that the majority of FDI takes place between high-income developed countries, where vertical FDI is expected to play a greater role than between partners at different levels of economic development.
Both types of relationship are consistent with viewing trade and FDI as two equivalent modes for the international provision of goods. Cross-border trade and FDI can therefore be seen as two modes for firms to deliver goods internationally. When we turn to services, the General Agreeent on Trade in Services (the GATS) actually explicitly lists four different modes for producer delivery of services across international borders – cross border delivery, movement of consumers, firm establishment, and temporary movement of persons linked to services. The most important of these are cross-border trade (known in GATS-speak as ‘mode 1’) and sales through local establishments, i.e. through FDI (known in GATS-speak as ‘mode 3’). Mainly due to data limitations, the question of whether these different modes act as complements or substitutes in services trade has rarely been dealt with in the literature. 1
There are reasons to believe that the relationship between cross-border trade and FDI may well be different for services than for merchandise. Banga (2005) points out that while the determinants for FDI are generally found to be the same for goods producing firms and for services delivering ones, the importance of these determinants differ strongly between the two sectors. Government regulations, policies, cultural distance and the tradability of services (influenced by technological progress as well as by economic policy and regulatory measures) are the prime factors influencing FDI in services. In contrast,
1 The approach taken in the literatrure is gravity modelling. An early example looking at different services sectors,
based on bilateral U.S. services trade data, is Francois (1993). More recently, Fortagné (1999), Magaläes and Africano (2007), FDI, Hejazi and Safarian (2001) and Bos and van de Laar (2004, look at total service trade and FDI. At a sector level, see Buch and Lipponer (2007) for German banks, Moshirian (2001) and Moshirian et al (2005) for banking, and Li et al (2003) for insurance. services.
market size, barriers to trade and cost differentials in production are the main determinants for FDI in goods.
Evidence on whether cross-border and establishement modes of international service delivery act as complements or substitutes is thin and inconclusive. Some studies find no evidence, like Brenton et al (1999) for the aggregate, or even mixed results when individual products or countries are studied, like Bloningen (2001), Pain and Wakelin (1998) or Fontagné and Pajot (2000). Moshirian (1997) does find a substitutive relationship for insurance services, as do Kolstad and Villanger (2004) for a disaggregate set of four service sectors. The question has immediate policy relevance, as it determines the meaning of differential liberalization commitments taken under alternative modes. (Francois and Wooton 2001).
In this paper we explore the degree of complementarity between trade and FDI in services over both short and longer run time horizons. We work with a newly constructed dataset that combines data for cross border and establishment modes of trade for 28 OECD countries over the period 1994 to 2004, distinguishing between total services and seven individual service sectors. The next section describes the data set in more detail, highlighting an apparent short-run interaction between cross-border trade and FDI in the service sector. In Section 2 we develop our estimating framework from an analytical structure involving composite delivery modes. Section 3 offers evidence of the short-run relationship between trade and FDI in services, at the aggregate level and by service, both in the traditional and the new composite demand approaches. The complementarity between FDI and cross-border trade is corroborated in section 4 by a long-run analysis, where FDI shows an important long run effect on services imports. We offer conclusions in Section 5.
2.
Data and Basic Trends
Our dataset merges imformation from a number of different sources (IMF, OCED, World Bank). Data for service imports, covering basically modes 1 and 2, come from published IMF Balance of Payments Statistics, compiled according to BOP Manual 5. FDI stock data, as a proxy for mode 3 trade, are taken from OECD Source and classified by the OECD’s own industry classification based on ISIC, revision 3. The time period covered ranges from 1994-2004. The combination of the two datasets implies that the sample covers 28 OECD countries.2 The data are mapped to individual service sectors according to the BOP classification. We have left out sectors where the number of missing observations exceeded the observations that were actually reported. Thus, we focus on the following categories: total services, transport, travel, communication, construction, finance, and other business services. We have approximately 200 observations per service category. All other macroeconomic indicators come from the World Development Indicators published by the World Bank (i.e. GDP, value added, purchasing power
2 While cross-border trade at the sectoral level (BOP classification) is in principle available for 178 countries in the
world, detailed and comparable FDI data by sectors is only available for the OECD members. Consequently our sample contains all OECD countries without Belgium and Luxembourg.
parities), while distance is taken from CEPII’s distance dataset and exchange rates are from the IMF International Financial Statistics.
For measures of regulation, we use the set of OECD Product Market Regulation indicators or PMR indicators (see Conway et al. 2005). These cluster a variety of different regulatory measures into three groups: barriers to entrepreneurship, state control and barriers to trade and investment. Barriers to entrepreneurship and state controls are essentially inward oriented regulations; trade and investment barriers act as outward oriented regulations, and are more likely to be affected by international negotiations. The latter are split into foreign ownership barriers, regulatory barriers and tariffs. The indicators are normalized to a scale between 0 and 6, higher values indicating more burdensome regulation.
We focus on the interaction between the two modes of supply, namely across the border (including here also movement of consumers) and through foreign establishment. We would ideally measure mode 3 trade by the sales of foreign affiliates in the service sector. However, such data only exist for a limited number of countries. Indeed, the U.S. is more or less the only country that publishes comprehensive FATS statistics on a consistent basis. Therefor, without apology we use service sector FDI stocks in the country as a very rough proxy for service supply through foreign establishment. Estimates by the World Bank (Hoekman 2006) indicate that this is reasonable, and that for the US the ratio between inward FDI stocks in services and trade through foreign affiliates in the same sector is about 3:1. This means we can roughly quantify the importance of mode 3 trade by taking one-third of FDI stocks. This scaling effect has to be considered when interpreting the figures presented below.
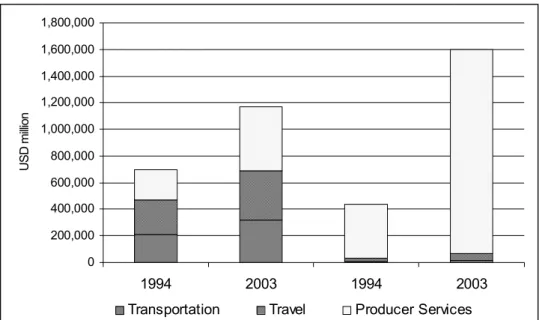
Trade in services has in general risen in the OECD over the past decade. Figure 1 displays the growth in import volume and FDI inward stocks for total services. One sees an over-proportionate increase in FDI stocks. Even with our rule of thumb only a third of this can be seen as Mode 3 trade, it still implies a relative shift towards trade through commercial presence. While a decade ago cross-border trade was by far the most important mode for trade in services (840 billion USD of service sector FDI stocks corresponding to 280 billion USD of mode 3 trade as compared to 770 billion USD of cross-border service imports), by 2004 FDI stocks amounted to 3,300 billion USD while service imports have just about doubled to 1,300 billion USD for the OECD in total. Thus, towards the end of the observation period, the two modes have attained equal importance.
Figure 2 shows a sector breakdown of imports through trade and establishment by three main sectors, transport, travel and the sum of the remaining five categories listed above -- producer services.3 It becomes evident from Figure 2 that this category is strongly responsible for the high growth of FDI in the service sector. The tremendous growth in service sector FDI is almost entirely driven by producer services. Also, it is the most important category for cross-border trade in services in the OECD. Growth through modes 1 and 2 has not been as impressive as through FDI. However, trade flows have
3 This refers to the sum of communication, construction, finance, insurance and other business services. Due to too
many missing observations, this group does not reflect all categories usually labelled “producer related services”. Specifically we are missing out here: computer and information services and royalties and license fees.
nevertheless doubled over the past decade in all three categories. Thus, we observe an increase in trade in services through either mode. This clearly positive trend implies a shift towards trade through foreign affiliates, though the rough data do not allow us to speculate at this point whether this implies a substitute relationship or a form of complementarity.
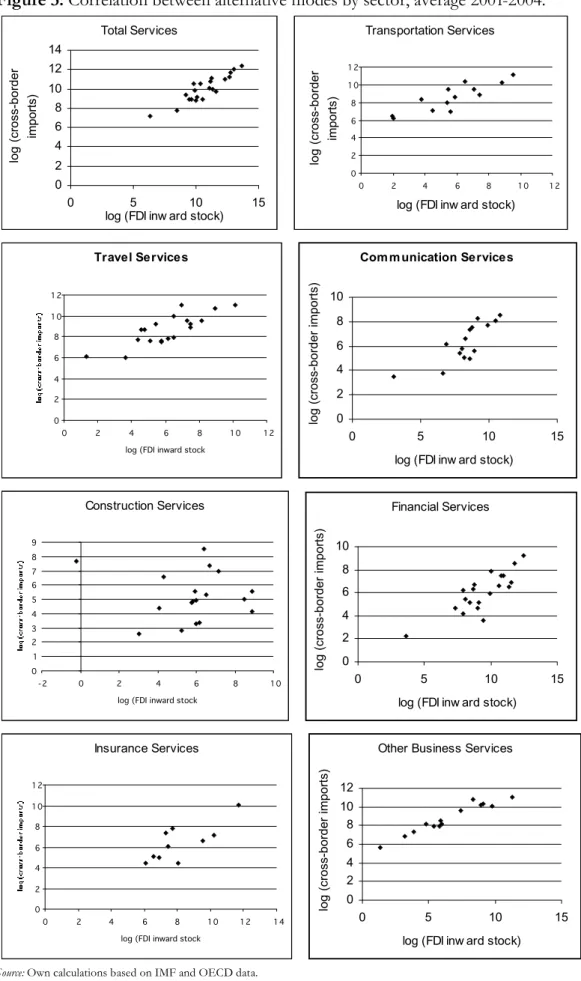
More details about this relationship between different modes of services supply are given in Figure 3, which plots FDI inward stocks against service imports for all 28 countries for each service sector separately. The graph shows the average level of cross-border imports and FDI stocks in current US-Dollar over the period 2001-2004. For all service sectors with the exception of construction services, we see a positive relationship. Thus, more inward FDI in a country is observed together with more service imports in the same sector. This very preliminary look at the data suggests a contemporaneous complementarity between trade and FDI in services.4
3.
Linking Trade and FDI in Services
Conceptually, cross-border services trade and foreign affiliate sales may be substitutes or complements. On net, there are several reasons to expect that they are more often gross complements in production (i.e. joint inputs) though with some degree of substitution possible. For example, because services require interaction between provider and consumer (Hill 1977, Francois 1990), it will usually be the case that cross-border trade in services requires some local value added to facilitate interaction between provider and consumer. In addition, from available balance of payments and trade data, we observe both trade and FDI across service sectors. If we are willing to assume that FDI in services is a reasonable proxy for affiliate sales in services, this means we observe both cross-border and affiliate sales.
In formal terms, we start with a general representation of delivered services S as a composite of cross-border traded inputs T and affiliate activities F. This may, for example, involve a banking product supported by headquarter activities but sold and serviced through a local office. Formally, we represent total foreign sales of services as a CES composite (equation 1), where !=1/(1-") is the Allen-elasticity of substitution across modes.
S
=
f F
( )
,
T
=
A a
F( )
F
!+
a
T( )
T
!(
)
1 !, 0
"
! "
1
(1)If sales through affiliates and through cross-border trade (F and T) are prefect substitutes, then
S = A a
(
FF +aTT)
,!
=1 (2)In more general terms, from the first order conditions for cost-minimization starting from (1), we have the following relationship between cross-border and establishment inputs to final delivery:
4 For the period 1994-1997, the same positive relationship was observed for all services sectors, also for
construction services. We had to omit insurance services from the analysis, since data for the complete sample was available only for one year and hence the small number of observations did not allow a meaningful econometric analysis.
F =SA!1 aF PF " # $ %&' ( P( =SA!(1+() aF PF " # $ %&' ( aF(PF1!( +a T (P T 1!(
(
)
(/( 1!() T =SA!1 aT PT " # $ %&' ( P( =SA!(1+() aT PT " # $ %&' ( aF(PF1!( +a T (P T 1!((
)
(/( 1!() (3, 4)P
=
A
!1a
F "P
F 1!"+
a
T "P
T 1!"(
)
1/( 1!") (5)In equation (5), P is the price of the delivered service S. Normalizing service quantities so that we represent import demand for delivered services as
S
=
P
!,
!
<
0
where ! is the elasticity of demand, then from equations (3-5),5 it is straightforward to link demand for cross-border and local service sales to changes in the price of cross-border and local affiliate inputs.dT
dP
F=
(
!
+
"
)
P
!+2" #1a
FP
F #"a
TP
T$
%
&
'
(
)
"A
" #2P
F#1$
%
&
'
(
)
dT
dP
T=
#
P
!+"a
TP
T$
%
&
'
(
)
"#!
a
"TP
T1#"+
"
a
F"P
F1#"(
)
A
" #2P
T#1$
%
&
'
(
)
(6,7A similar set of equations hold for F. From equation (6), the impact of a drop in the price of providing local affiliate inputs on cross-border trade depends on the elasticity of substitution between F and T, and the underlying elasticity of demand for composite services S. If the elasticity of substitution is relatively low - in particular if
!
<"
- then they actually serve as gross complements. Alternatively, as long as!
>"
, they will serve as gross substitutes.We have seen dramatic increases in FDI flows in the service industries in the last 10 years, along with moves to privatize and deregulate service sectors. Liberalization of service sector FDI means a reduction in the cost of running local affiliates. From equations (3,4) this implies a rising share of local affiliate relative to cross-border sales. Controlling for overall growth in demand, the theoretical impact on cross-border sales is ambiguous. From equations (6,7), it will depend on the elasticity of substitution relative to the elasticity of demand. We can summarize the implications of local service sector liberalization and related FDI liberalization as follows:
• In the cross-section, net complementarity of F and T means a relatively low technical degree of substitution
• Over time, increases in total service sales S imply rising both cross-border trade and FDI
• Controlling for shifts in demand, the impact of FDI growth driven by local market liberalization over time on cross-border trade is ambiguous
5 In Ethier-Krugman-Melitz type models, this elasticity is from the elasticity of substitution across varieties. With
Technical change affecting delivery modes has a similar set of implications. In our data, we will look at both trade-FDI interactions in the cross-section, and at a dynamic panel. In the cross-section, complementarity will tell us we have a relatively low degree of substitution between cross-border and local sales of services. In the dynamic panel, we are interested in the relative evolution of cross-border and affiliate sales.
4.
The cross-section view and the impact of regulation
In this section we analyze the effect of inward FDI on services cross-border trade and vice versa from a short-run point of view. We estimate first the traditional gravity model for cross-country panel dataset, where we do not control for regulatory interactions and where we capture the complementary or substitutive effect between FDI and services imports by including trade through the alternative mode as a further control variable on the right hand side. Since there may be a certain time lag in the relationship, we use here the first lag of the alternative mode. Our estimating equations are given below:
lnMit =b0,M +b1,Mlndistit +b2,M lnGDPit +b3,MlnPOPit +b4,MlnFDIi,t!1+eM,it lnFDIit =b0,F +b1,Flndistit +b2,FlnGDPit +b3,FlnPOPit +b4,FlnMi,t!1+eF,it (8,9)
In equation (8), Mit is the total cross-border service imports for country i and year t; FDIit are total FDI stocks in the services sector in country i and year t, GDP is the gross domestic product for country i and year t (measured in current international dollars), POP is the population of the host country, and dist is a GDP-weighted average distance term for the host country to all potential trading partners. The dist term can be seen as an index of general remoteness of the country). Finally e represents error terms with an unobservable country-specific component and a remainder disturbance. We estimate the within or fixed effects model where the country-specific effect and all the regressors are assumed to be independent of the disturbance. The bias of omitting variables is controlled for in this way. (Recall that we have a sample of 24 countries over 10 years, although there are some missing values in this sample . Data sources are described in the previous section.)
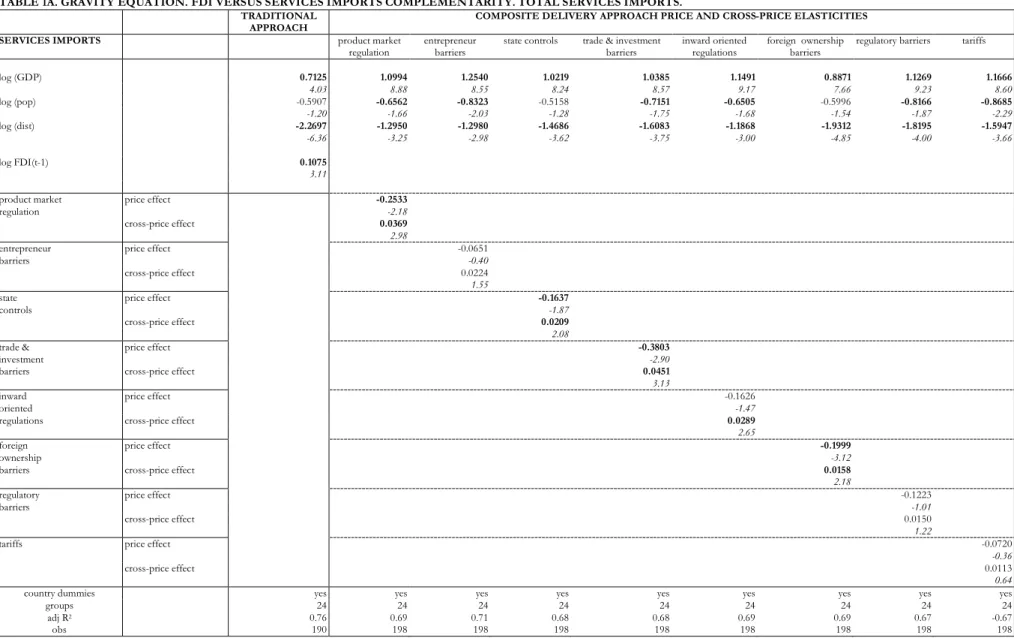
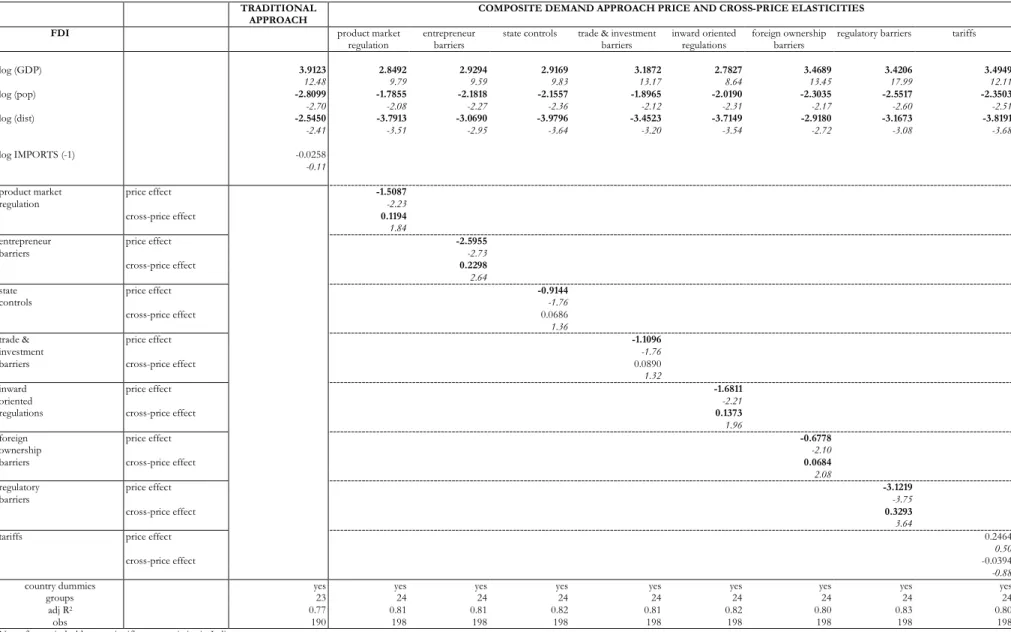
Tables 1A and 1B show the estimation results for the traditional, uncontrolled gravity approach in the first column. Services imports receive a significant complementary effect from commercial presence (Table 1A), but we do not find this complementary relationship to be significant in the opposite direction. From the regression results, no significant evidence for a trade impact of cross-border imports upon commercial presence is found (Table 1B).
From our discussion of composite delivery, equations (6) and (7), and corresponding versions for FDI, point to an impact of cost factors in one mode (like regulatory restrictions) in delivery through the alternative modes. This suggest testing for interaction between cross-border and establishment modes by
focusing on this impact, which follows from the cross price effects in equations (6) and (7). To implement this formally, we work with an augmented gravity equation where the barriers on alternative modes for services trade are controlled:
ln
M
it=
c
0,M+
c
1,Mln
dist
it+
c
2,Mln
GDP
it+
c
3,Mln
POP
it+
c
4,Mln
PMR
it+
c
5,M(
PMR
it)
(
ln
FDI
i,t!1)
+
e
M,itln
FDI
it=
c
0,F+
c
1,Fln
dist
it+
c
2,Fln
GDP
it+
c
3,Fln
POP
it+
c
4,Fln
PMR
it+
c
5,F(
PMR
it)
(
ln
M
i,t!1)
+
e
F,it(10,11)
In equations (10) and (11), PMR is an index of product market regulation controling for explicit and implicit barriers for services trade through domestic regulation. This comes from the OECD, and is described in more detail in the data section of the paper. We have tested the price and cross-price effect for each category of regulation. The advantage of this specification is we decompose the change in trade in each mode due to changes in regulations into a direct price effect and into cross-price effects working through the alternative mode to trade the respective service. Taking as an example the services imports equation,
!
(
lnMit)
!
PMRit =c4,M +c5,MlnFDIi,t"1 (12)Here, the term c5,M indicates the complementary or substitutive effect received from FDI when the barrier restricting this mode changes. From equations (6,7), this effect depends on the demand and substitution elasticities, and measures net cross-price effects. The results of these price effects for total trade in services are presented in the remaining columns of Tables 1A and 1B.
At first glance, variation in product market regulations in general is affecting trade within the same mode directly and through the respective other mode. We see in both panels of Table 1 a negative direct price effect, meaning that more regulation impedes trade as expected. This results from the interpretation of higher values of the PMR indicators with more burdensome regulation and a consequent more restricted (and higher cost) acces to the corresponding market. The cross-price effect, working through the alternative mode of trade, is always of the opposite sign (positive). This points towards a complementary relationship, because the negative price effects from an increase in regulations are reflected in a simultaneous negative effect on the alternative mode. In other words, those countries with higher regulations experience a lower level of services imports and of foreign commercial presence, which is much lower because of the complementarity between both modes of trade. In more detail, the incidence of individual aspects of regulation differs between modes (cross-border and through FDI). For services imports we see significant negative effects from higher trade and investment barriers - due to foreign ownership regulations - and from state controls; cross-border imports also receive a positive cross-price effect from inward oriented regulations, though here we do not find a significant direct price effect. For trade through foreign establishment (proxied by FDI) we find a direct negative price effect from all aspects of regulation with the exception of tariffs. Cross-price effects (working through corss-border trade) are significant only when looking specifically at inward oriented regulations (here arising from barriers to
entrepreneurship) and trade and investment barriers – here stemming from regulatory burdens and restrictions on foreign ownership. For all aspects of regulation we find evidence for complementarity between FDI and services imports. Foreign ownership barriers stand out as the only category with a reciprocal relationship where both direct price and indirect cross-price effects significantly affect trade through both modes. In summary, in the short-run there is evidence of significant complementarity between cross- border trade and commercial presence in aggregate services.
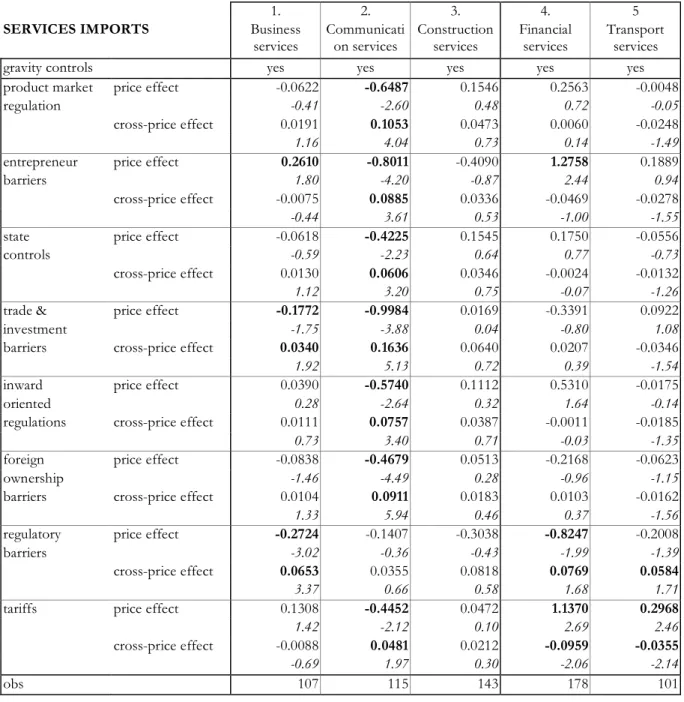
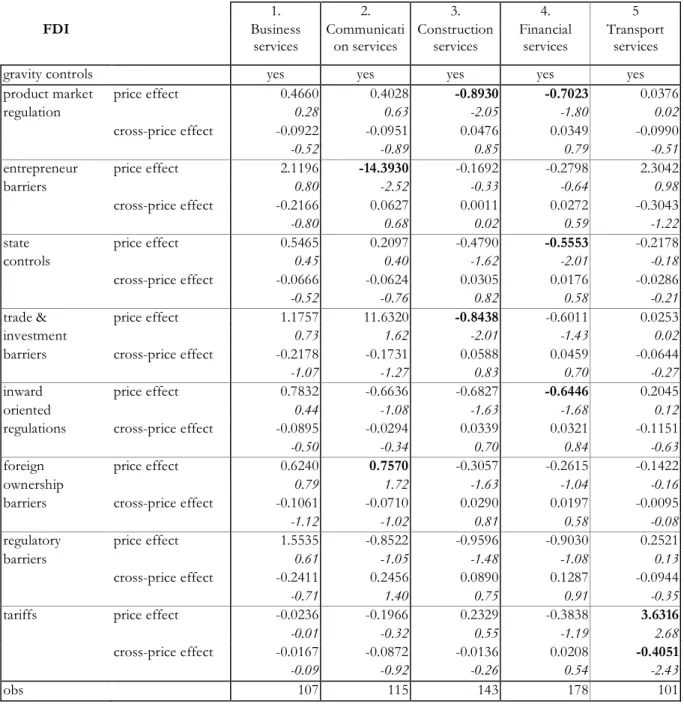
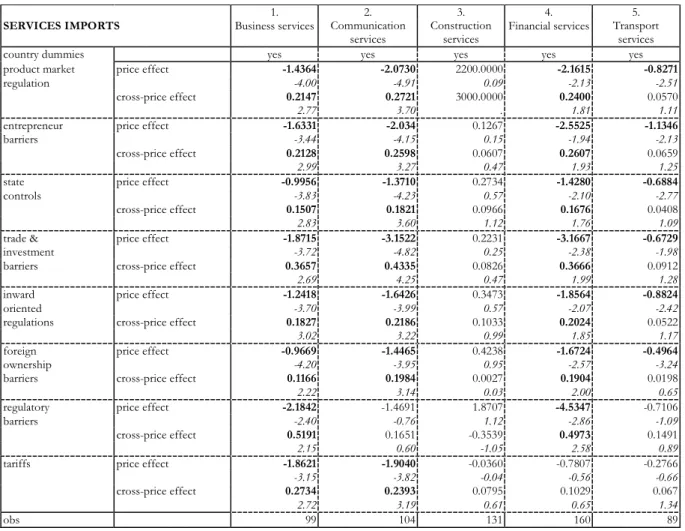
Since total services comprise a very heterogeneous collection of highly different activities, it is interesting to analyse the relationship between individual modes of delivery and their reaction on regulatory changes for each service sector separately. For this we have replicated the set of estimates for each service activity separately. The price and cross-prices elasticities are summarized in Tables 2A and 2B. The evidence is more disperse with fewer instances of evidence for complementarity than for total services. Looking at the estimates for cross-border trade, we can highlight one service sector with evident complementary effects that stands out because most of regulations show a significant direct and complementary effect. Communication services show a strong evidence of complementarity in their response to all regulatory changes, except the regulatory obstacles to trade and investment. We also find some evidence for significant effects of regulatory barriers for other business and financial services. In the latter case – like for transportation services - we find an unexpected positive direct effect from higher tariffs on trade value. This may be explained by a statistical peculiarity in the case of transportation services, which are often constructed from merchandise trade flow statistics. Higher tariffs might increase the costs of shipping goods, which may falsely be counted as being part of the transportation service. Table 2B shows weaker evidence for FDI, with only some direct price effects for communication, construction and financial services. Transportation services again show an unexpected positive direct effect from tariffs.
To sum up, we find a robust complementary effect between commercial presence and cross-border trade in services, which is not always captured when we do not control for cross-pice effects linked to regulation. The composite delivery approach allows us to capture this effect through the cross-price effect when changes in product market regulations (being an indication of market access barriers) which affect both FDI and cross-border trade are taken into account. From this perspective the complementarity is clearly reciprocal between the two modes of supply. This is especially true when obstacles to foreign ownership are considered. Looking at individual service sectors, we again find a complementary relationship when the service activity shows a significant direct reaction to changes in the regulatory environment. The sensitivity towards such changes differs however between service sectors, with some of them, such as communications services, responding to all facets of regulation, some others being responsive to certain aspects of regulation - financial and other business services – while the rest – construction and communication – hardly show any sensitivity. At the detailed sector level the evidence for complementary effects through FDI on corss-border trade is generally stronger than for the opposite direction, though this varies by sector.
5.
Complementarity over time: trade through FDI
Having established complementarity between FDI and cross-border imports in the short-run, we next focus on how this relationship evolves over time. There is a recent literature on long-run effects and the causal relationship between international investment and trade in goods (see Barrell and te Velde 2002, Türkcan 2006, Pramadhani et al 2007, Pacheco-López 2005 or Pain and van Welsum 2004). In this section we formulate a simple partial adjustment model as used by Pesaran and Smith (1995) and Pesaran et al. (1999) and apply it to trade in services like in Pain and van Welsum (2004). Unlike Pain and van Welsum, we include controls for direct and indirect regulatory cost impacts. For our 10-year sample, the estimated long-run coefficients are meant to test for complementarity or substitution in the long run between different modes. We start with the following dynamic relationship:
ln
Y
it=
!
i+
"
iln
X
it+
#
iln
Y
i,t$1+
e
ite
it~ IN 0,
%
i 2( )
(13)where Yit is cross-border trade (or the commercial presence respectively), i=1…N is the country and
t=1…10 are years, and Xit denotes the alternative mode of trade. We want to test for the existence of a long-run relationship between the two modes. In the case of a positive relationship we can consider this as an indication of complementarity, and the opposite would be a sign of substitution. The associated long-run coefficients can be derived as
!
i ="
i(
1#$
i)
. The country-specific intercept picks up all omitted factors that vary across countries. A convenient re-parametrisation of (13) is:!
ln
Y
it=
"
i#
(
1
#
$
i)
ln
Y
i,t#1# %
i1
#
$
iln
X
it&
'
(
)
*
+
+
u
it!
ln
Y
it=
"
i#
,
i[
ln
Y
i,t#1#
-
iln
X
it]
+
u
it (14,15)From this non-linear equation, we can estimate the long-run parameters of interest:
!
and!
. In a first simple experiment we assume that there are negligible differences between countries in the long-run price and cross-prices elasticities. This yields estimates that are more or less comparable to our short-run, within estimates from the previous section.6 The estimating equation then becomes:
!lnYit =
"
i #$
[
lnYi,t#1#%
lnXit]
+&
it (16)6 It is well known that the within coefficients show a downward bias when there is heterogeneity between countries
or endogeneity in the model. As a first point to note, the composite delivery approach, controlling for cross-price interactions, is likely to minimize the endogeneity problem compared to the uncontrolled one. Secondly, in our sample, only Asian countries show a different behaviour in the evolution of services trade. Moreover, Pesaran et al. (1999) also argue that short-time coefficients are more likely to vary across countries than the long-run parameters. Although we are aware of the simplification of assuming homogeneous coefficients, we can stress that also we would like to keep the same assumptions than in the short-run analysis, where we assumed common elasticities and country fixed effect, and for the initial experiment the main aim is to detect significant relationships. A previous analysis controlling for heterogeneity by including dummies for five different geographic regions revels the downward bias of the within estimation but our elasticities keep their significance regardless whether we control for heterogeneity or not.
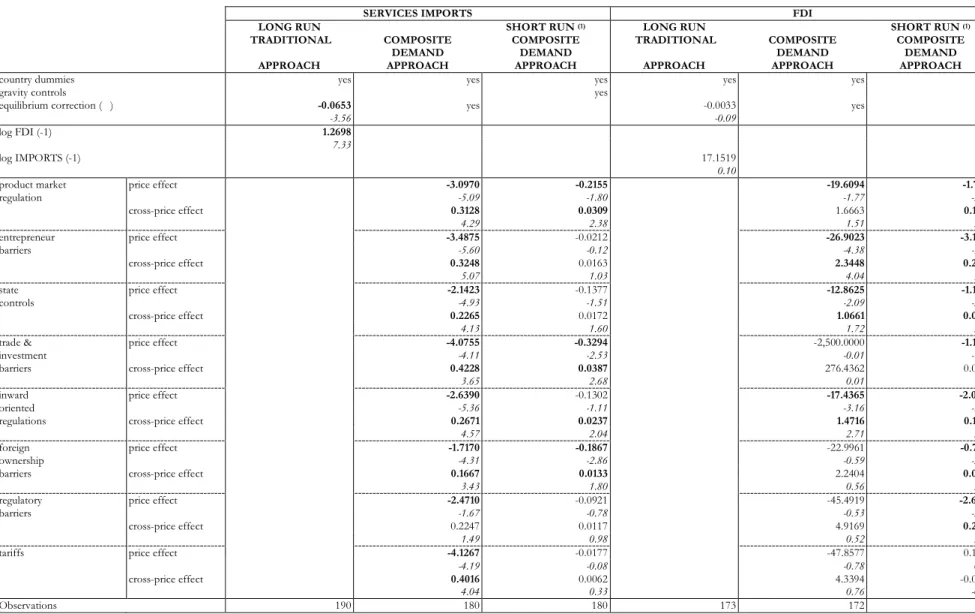
Estimates for equation (16) are reported in Table 3, both for services imports and for FDI. In addition to the long-run composite delivery-based estimates (where we control for cross-price regulatory impacts), we also report traditional (uncontrolled) long-run estimates and a set of short-run estimates based on exactly the same sample to allow for direct comparison.7
The most striking result is that the direct effect and the indirect complementarity from FDI towards services imports are both reinforced in the long run, while the evidence becomes weaker in the opposite direction. Also, the standard (uncontrolled) approach yields a significant complementarity from FDI towards cross-border trade, but again no evidence from imports to investment. A detailed analysis by components of regulation indicates that services imports are affected over time not only by changes in foreign ownership barriers but also by other trade and investment barriers – such as regulatory barriers and tariffs – and by inward oriented regulations – both barriers to entrepreneurship and state control. In contrast, for commercial presence, while inward oriented regulations have a significant impact in the short and long-run, outward oriented trade and investment barriers have only a short-run effect, but this is lost in the long-run.
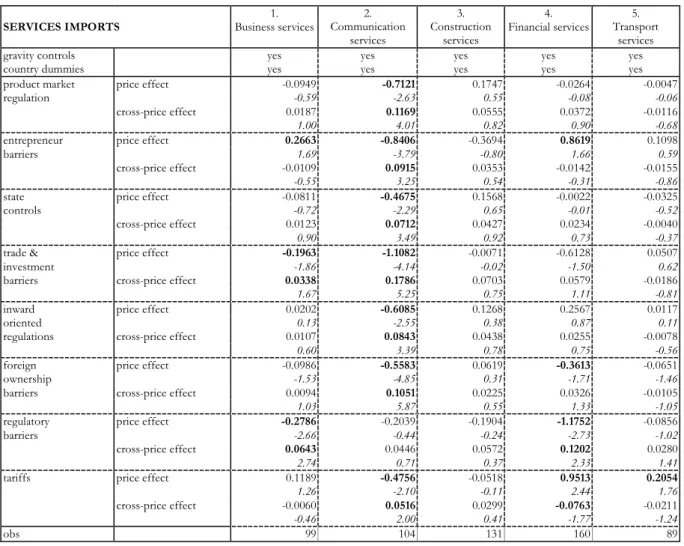
The stronger impact and complementarity from commercial presence towards cross border trade is evident also for individual services. Tables 4A and 4B summarize the price and cross-price effects by individual service sectors. Table 4A presents the short-run results, and Table 4B reports corresponding long-run elasticities. The estimates are always based on the long-run sample in order to control for potential sample bias. Communication services are sensitive to all dimensions of regulation, except regulatory barriers to trade and investment. The same result was observed in the short-run. Other business services show a very significant direct price and complementary effect in all regulatory dimensions in the long run. Financial services, which show complementary effects in the shortrun only when regulatory barriers to trade and investment change, are sensitive to all kind of regulatory changes, except tariffs, in the longrun. Construction services never show an effect from any aspect of product market regulation, and transportation services reveal a significant price effect from all inward oriented regulations together with foreign ownership barriers but they never receive a significant indirect effect derived from a complementary relationship with FDI. Furthermore, the counterintuitive positive effects from tariffs in financial and transport services observed in the short-run seem to be adjusted over time, showing the expected negative effect in the long run. It also appears that trade and investment barriers in general have the largest impact in all services. Looking into the subdomains of this index, this trade inhibiting effect arises primarily from regulatory barriers in business services and financial services, and from controls on foreign ownership and high tariffs in communication services (see Table 4).
In summary, we have found a complementary relationship between cross-border imports and FDI triggered by their reaction to changes in outward oriented regulatory measures in the short-run. Over time,
7 It can be noticed also that the short-run results are practically the same for this long-run sample and for the entire
sample in the previous section. Only the index for state control is not significant for cross-border imports of services in the long-run sample. The differences in sample size arise from the calculation of growth rates for the long-run approach.
our analysis reveals a more stable complementary relationship in reaction to changes in almost all aspects of regulation, especially so for communication, financial and business services. Some additional considerations merit further study in this context, such as the impact of country heterogeneity on the elasticities which we have obtained and the efficiency of the estimation methods used. Our analysis as it stands shows a significant and robust complementary relationship between the two main modes of services trade (cross-border and through foreign affiliates) in all producer related services but construction and transport. The general pattern is also one of a much cleaner view of these relationships over the longrun.
6.
Conclusions
In this paper we have focused on the relationships between different modes of services trade. This has involved testing for whether the most important modes of delivery (cross-border trade and commercial presence) act as complements or substitutes. The empirical literature uses a traditional gravity approach when testing for this relationship - often with inconclusive evidence. In contrast, we offer here an analytical framework for studying cross-border and establishment modes (i.e. and trade and FDI) based on a model of joint delivery of services. Based on this framework, we work with a new set of estimating equations that includes not only direct interaction between modes, but also indirect interaction linked to cross-price effects. We capture these cross-effects through the impact of regulatory indexes. Our composite delivery approach, which combines FDI and services imports as different ways to serve domestic demand offers, an avenue for testing the hypothesis of complementarity versus substitution through the cross-price effects, which we can link directly to measures of existing regulations and other barriers to trade in services. Our approach predicts a complementary growth between FDI inflows and cross-border imports when the substitution elasticity is higher than the demand elasticity, and a substitutive effect in the opposite case.
Working with a new panel dataset spanning OECD trade and FDI in services for 1994-2004, we estimate both the standard (uncontrolled) and composite delivery approach (where we control for cross-price effects) model. For the aggregate of total services, the standard approach yields a complementary effect from FDI towards services imports, which is not significant when looking at the effects of cross-border imports on FDI. The composite delivery approach reveals a reciprocal complementary relationship in reaction to changes in domestic regulation (serving as an indicator of implicit and explicit barriers to trade in services). Moreover, we can distinguish which types of regulations have a larger impact. While cross-border service imports are more sensitive to outward oriented barriers, trade through local presence (proxied for by FDI stocks) is sensitive both to inward oriented regulations and trade and investment barriers and here in particular to changes in barriers restricting foreign ownership. Not all producer service sectors react alike. We can identify stronger and more stable effects to changes in regulatory regimes in communication services, where imports receive a clear positive impact from changes in FDI regulations.
The short-run evidence is corroborated in the long-run, showing a reinforcement of the complementary effect that imports receive from FDI when regulations change. The effect from cross-border trade on FDI is weaker. Total service imports grow directly in response to lowered regulatory obstacles as measured through any aspect of regulation, and they grow also through the FDI channel, again indicating net complementarity. On the other hand, FDI in services grows only when inward oriented domestic regulations are removed, with no impact from outward oriented barriers in the long run. A detailed analysis by individual service sectors indicates again that cross-border trade in insurance and business services grows in response to any individual regulations being reduced, and communications and financial services are sensitive to almost all barriers. Only for transport and construction services imports do we find no evidence of net complementarity.
References
Arellano, M. and S.R. Bond (1991). “Some tests of specification for panel data: Monte Carlo evidence and an application to employment equations”, Review of Economic Studies 58, 277-297.
Bagchi-Sen, S. (1995). “FDI in US Producer Services: A Temporal Analysis of Foreign Direct Investment in the Finance, Insurance, and Real Estate Sectors”, Regional Studies, Vol. 29, pp. 159-170.
Banga, R. (2005). “Foreign Direct Investment in Services: Implications for Developing Countries”, Asia-Pacific Trade and Investment Review 1(2), 55-72.
Barrel, R. and D.W. te Velde (2002). “European Integration and Manufactures Import Demand. An Empirical Investigation of Ten European Countries”, German Economic Review, 3(3): 263-93.
Bloningen, B.A. (2001). “In search of substitution between foreign production and exports”, Journal of International Economics 53, 81–104
Blundell, R. and S.R. Bond (1998). “Initial conditions and moment restrictions in dynamic panel data models”, Journal of Econometrics 87, 115-143.
Bos, J. and M. van de Laar (2004). “Explaining Foreign Direct Investment in Central and Eastern Europe: an Extended Gravity Apprach”, DNB Working Papers 008, Netherlands Central Banlk, Research Department.
Brenton, P., Di Mauro, F. and M. Lücke (1999). “Economic Integration and FDI: An Empirical Analysis of Foreign Investment in the EU and in Central and Eastern Europe”, Empiric, 26(2), 95-121.
Buch, C. and A. Lipponer (2004). “FDI versus cross-border financial services: The globalisation of German banks”, Deutsche Bundesbank Discussion Paper series 1 05/ 2004.
Conway, P., V. Janod and G. Nicoletti (2005). “Product Market Regulation in OECD countries, 1998 to 2003”, OECD Economics Department Working Paper, nº 419.
Egger, P. and M. Pfaffermayr (2005). “Trade, Multinational Sales, and FDI in a Three-factor Mode”, Review of International Economics, 13(4), 659-675.
Fontagné, L. (1999). “Foreign Direct Investment and International Trade: Complements or Substitutes?”, STI Working Papers 1999/3.
Fontagné, L. and M. Pajot (1999). “Investissement direct à l’etranger et échanges extérieurs : un impact plus fort aux Etats-Unis qu’en France”, Economie et Statistique, (326-327) : 31-52.
Fontagné, L. and M. Pajot (2000). “Foreign Trade and FDI Stocks in British, US and French Industries: Complements or Substitutes?” in Inward Investment, Technological Change an Growth, The Impact of Multinational Corporations on the UK Economy (Ed. N. Pain). Palgrave Macmillan.
Francois, J.F (1990). “Trade in Nontradables: Proximity Requirements and the Pattern of Trade in Services”, Journal of Economic Integration, 5(1), 31-46.
Francois, J.F. (1993). “Explaining The Pattern of Trade in Producer Services.” International Economic Journal 7(3): 23 – 31.
Francois, J. and I. Wooton (2001). “Market structure, trade liberalization and the GATS,” European Journal of Political Economy 17(2):389-402.
Hejazi, W. and A.E. Safarian (2001). “The complementarity between U.S. foreign direct investment stock and trade”,Atlantic Economic Journal 29 (4), 420-437.
Hill, T.P. (1977) “On goods and services”. The Review of Income and Wealth, 23, 315-338. Hoekman, B. (2006). “Liberalizing Trade in Services: A Survey”, Policy Research Working Paper.
Kolstad, I. and E. Villanger (2008 forthcoming). “Determinants of foreign direct investments in services”, European Journal of Political Economy.
Li, D., Moshirian F. and A.B. Sim (2003). “The Determinants of Intra-industry Trade in Insurance Services”, Jorunal of Risk and Insurance 70(2), 269-87.
Magalhães, M. and Africano, A.P. (2007), “A Panel Analysis of the FDI Impact on International Trade”, FEP Working Papers.
Moshirian, F. (1997). “Foreign Direct Investment in Insurance Services in the United States”, Journal of Multinational Financial Mangement 7(2), 159-73.
Moshirian, F. (2001). “International Investment in Financial Services”, Journal of Banking and Finance 25, 317-337.
Moshirian, F., Lee, D. and A.B. Sim (2005). “Intra-Industry Trade in Financial Services”, Journal of International Money and Finance 24 (7), 1090-1107.
Pacheco-López, P. (2005). “Foreign Direct Investment, Exports and Imports in Mexico”, The World Economy 28(8), 1157-72.
Pain, N. and K. Wakelin (1998). “Export Performance and the Role of Foreign Direct Investment”,
Manchester-School. Supplement 66(0), 62-88.
Pain, N. and D. van Welsum (2004). “International Production Relocation and Exports of Services”,
OECD Economic Studies nº 38, 2004/1.
Pesaran, M.H. and R.P. Smith (1995). “ Estimating Long-Run Relationships from Dynamic Heterogeneous Panels”, Journal of Econometrics, 68, 70-113.
Pesaran, M.H., Y. Shin and R.P. Smith (1999). “Pooled Mean Group Estimator of Dynamic Heterogeneous Panels”,Journal of the American Statistical Association, 94, 621-634.
Pfaffermayr, M. (1996). “Foreign Outward Direct Investment and Exports in Austrian Manufacturing: Substitutes or Complements? ”,Weltwirtschaftliches-Archiv. 132(3): 501-22
Pramadhani, M., R. Bissoondeeal and N. Driffield (2007), “FDI, Trade and Growth, A causal link?”, Research Paper 0710, Aston Business School.
Türckan, K. (2006), “Foreign Direct Investment and Intermediate Goods Exports: Evidence from USA”, ETSG Annual Conference.
Windmeijer, F. (2005). “A Finite Sample Correction for the Variance of Linear Two-Step GMM Estimators”,Journal of Econometrics 126(1), 25-51.
Zarotiadis, G. and N. Mylonidis (2005), “FDI and Trade in the UK: Substitutes or Complements?”, ETSG Conference, Dublin.
Tables and Figures
Figure 1:
Growth of Total Trade in Services, OECD members.
Source: IMF BOP Statistics.
Figure 2:
Sectoral Pattern of Trade in Services.
Source: IMF BOP Statistics, IMF IFS Statistics.
0 1000 2000 3000 4000 5000 6000 1994 1995 1996 1997 1998 1999 2000 2001 2002 2003 2004 USD billion cross-border FDI 0 200,000 400,000 600,000 800,000 1,000,000 1,200,000 1,400,000 1,600,000 1,800,000 1994 2003 1994 2003 U S D m illi on
Figure 3:
Correlation between alternative modes by sector, average 2001-2004.
Total Services 0 2 4 6 8 10 12 14 0 5 10 15log (FDI inw ard stock)
log (c ro ss -b o rd e r im po rt s) Transportation Services 0 2 4 6 8 10 12 0 2 4 6 8 10 12
log (FDI inw ard stock)
log (c ro ss -b o rd e r im po rt s) Travel Services 0 2 4 6 8 10 12 0 2 4 6 8 10 12
log (FDI inward stock)
Communication Services 0 2 4 6 8 10 0 5 10 15
log (FDI inw ard stock)
log (cross-border imports) Construction Services 0 1 2 3 4 5 6 7 8 9 -2 0 2 4 6 8 10 log (FDI inward stock)
Financial Services 0 2 4 6 8 10 0 5 10 15
log (FDI inw ard stock)
log (cross-border imports) Insurance Services 0 2 4 6 8 10 12 0 2 4 6 8 10 12 14
log (FDI inward stock)
Other Business Services
0 2 4 6 8 10 12 0 5 10 15
log (FDI inw ard stock)
log
(cross-border
imports)
TABLE 1A. GRAVITY EQUATION. FDI VERSUS SERVICES IMPORTS COMPLEMENTARITY. TOTAL SERVICES IMPORTS.
TRADITIONAL
APPROACH COMPOSITE DELIVERY APPROACH PRICE AND CROSS-PRICE ELASTICITIES
SERVICES IMPORTS product market
regulation entrepreneur barriers state controls trade & investment barriers inward oriented regulations foreign ownership barriers regulatory barriers tariffs log (GDP) 0.7125 1.0994 1.2540 1.0219 1.0385 1.1491 0.8871 1.1269 1.1666 4.03 8.88 8.55 8.24 8.57 9.17 7.66 9.23 8.60 log (pop) -0.5907 -0.6562 -0.8323 -0.5158 -0.7151 -0.6505 -0.5996 -0.8166 -0.8685 -1.20 -1.66 -2.03 -1.28 -1.75 -1.68 -1.54 -1.87 -2.29 log (dist) -2.2697 -1.2950 -1.2980 -1.4686 -1.6083 -1.1868 -1.9312 -1.8195 -1.5947 -6.36 -3.25 -2.98 -3.62 -3.75 -3.00 -4.85 -4.00 -3.66 log FDI(t-1) 0.1075 3.11
product market price effect -0.2533
regulation -2.18
cross-price effect 0.0369 2.98 entrepreneur price effect -0.0651
barriers -0.40
cross-price effect 0.0224 1.55 state price effect -0.1637
controls -1.87
cross-price effect 0.0209 2.08 trade & price effect -0.3803
investment -2.90
barriers cross-price effect 0.0451 3.13 inward price effect -0.1626
oriented -1.47
regulations cross-price effect 0.0289 2.65 foreign price effect -0.1999
ownership -3.12
barriers cross-price effect 0.0158 2.18 regulatory price effect -0.1223
barriers -1.01
cross-price effect 0.0150 1.22 tariffs price effect -0.0720 -0.36
cross-price effect 0.0113 0.64
country dummies yes yes yes yes yes yes yes yes yes
groups 24 24 24 24 24 24 24 24 24
adj R2 0.76 0.69 0.71 0.68 0.68 0.69 0.69 0.67 -0.67
obs 190 198 198 198 198 198 198 198 198
TABLE 1B. GRAVITY EQUATION. FDI VERSUS SERVICES IMPORTS COMPLEMENTARITY. TOTAL SERVICES FDI.
TRADITIONAL
APPROACH COMPOSITE DEMAND APPROACH PRICE AND CROSS-PRICE ELASTICITIES
FDI product market
regulation entrepreneur barriers state controls trade & investment barriers inward oriented regulations foreign ownership barriers regulatory barriers tariffs log (GDP) 3.9123 2.8492 2.9294 2.9169 3.1872 2.7827 3.4689 3.4206 3.4949 12.48 9.79 9.59 9.83 13.17 8.64 13.45 17.99 12.11 log (pop) -2.8099 -1.7855 -2.1818 -2.1557 -1.8965 -2.0190 -2.3035 -2.5517 -2.3503 -2.70 -2.08 -2.27 -2.36 -2.12 -2.31 -2.17 -2.60 -2.51 log (dist) -2.5450 -3.7913 -3.0690 -3.9796 -3.4523 -3.7149 -2.9180 -3.1673 -3.8191 -2.41 -3.51 -2.95 -3.64 -3.20 -3.54 -2.72 -3.08 -3.68 log IMPORTS (-1) -0.0258 -0.11
product market price effect -1.5087
regulation -2.23
cross-price effect 0.1194
1.84
entrepreneur price effect -2.5955
barriers -2.73
cross-price effect 0.2298
2.64
state price effect -0.9144
controls -1.76
cross-price effect 0.0686
1.36
trade & price effect -1.1096
investment -1.76
barriers cross-price effect 0.0890
1.32
inward price effect -1.6811
oriented -2.21
regulations cross-price effect 0.1373
1.96
foreign price effect -0.6778
ownership -2.10
barriers cross-price effect 0.0684
2.08
regulatory price effect -3.1219
barriers -3.75
cross-price effect 0.3293
3.64
tariffs price effect 0.2464
0.50
cross-price effect -0.0394
-0.88
country dummies yes yes yes yes yes yes yes yes yes
groups 23 24 24 24 24 24 24 24 24
adj R2 0.77 0.81 0.81 0.82 0.81 0.82 0.80 0.83 0.80
obs 190 198 198 198 198 198 198 198 198
TABLE 2A: SUMMARY OF PRICE AND PRICE EFFECTS OF REGULATIONS ON CROSS-BORDER SERVICES, BY SERVICE
1. 2. 3. 4. 5
SERVICES IMPORTS Business
services Communication services Construction services Financial services Transport services
gravity controls yes yes yes yes yes
product market price effect -0.0622 -0.6487 0.1546 0.2563 -0.0048
regulation -0.41 -2.60 0.48 0.72 -0.05
cross-price effect 0.0191 0.1053 0.0473 0.0060 -0.0248
1.16 4.04 0.73 0.14 -1.49
entrepreneur price effect 0.2610 -0.8011 -0.4090 1.2758 0.1889
barriers 1.80 -4.20 -0.87 2.44 0.94
cross-price effect -0.0075 0.0885 0.0336 -0.0469 -0.0278
-0.44 3.61 0.53 -1.00 -1.55
state price effect -0.0618 -0.4225 0.1545 0.1750 -0.0556
controls -0.59 -2.23 0.64 0.77 -0.73
cross-price effect 0.0130 0.0606 0.0346 -0.0024 -0.0132
1.12 3.20 0.75 -0.07 -1.26
trade & price effect -0.1772 -0.9984 0.0169 -0.3391 0.0922
investment -1.75 -3.88 0.04 -0.80 1.08
barriers cross-price effect 0.0340 0.1636 0.0640 0.0207 -0.0346
1.92 5.13 0.72 0.39 -1.54
inward price effect 0.0390 -0.5740 0.1112 0.5310 -0.0175
oriented 0.28 -2.64 0.32 1.64 -0.14
regulations cross-price effect 0.0111 0.0757 0.0387 -0.0011 -0.0185
0.73 3.40 0.71 -0.03 -1.35
foreign price effect -0.0838 -0.4679 0.0513 -0.2168 -0.0623
ownership -1.46 -4.49 0.28 -0.96 -1.15
barriers cross-price effect 0.0104 0.0911 0.0183 0.0103 -0.0162
1.33 5.94 0.46 0.37 -1.56
regulatory price effect -0.2724 -0.1407 -0.3038 -0.8247 -0.2008
barriers -3.02 -0.36 -0.43 -1.99 -1.39
cross-price effect 0.0653 0.0355 0.0818 0.0769 0.0584
3.37 0.66 0.58 1.68 1.71
tariffs price effect 0.1308 -0.4452 0.0472 1.1370 0.2968
1.42 -2.12 0.10 2.69 2.46
cross-price effect -0.0088 0.0481 0.0212 -0.0959 -0.0355
-0.69 1.97 0.30 -2.06 -2.14
obs 107 115 143 178 101
Note: Each cell corresponds to a separate gravity regression. Detailed estimations in Appendix 1A. Figures in bold mean significant at the 10% level or more; t-statistics in italics.
TABLE 2B: SUMMARY OF PRICE AND CROSS-PRICE EFFECTS OF REGULATIONS ON FDI, BY SERVICE
1. 2. 3. 4. 5
FDI Business
services Communication services Construction services Financial services Transport services
gravity controls yes yes yes yes yes
product market price effect 0.4660 0.4028 -0.8930 -0.7023 0.0376
regulation 0.28 0.63 -2.05 -1.80 0.02
cross-price effect -0.0922 -0.0951 0.0476 0.0349 -0.0990
-0.52 -0.89 0.85 0.79 -0.51
entrepreneur price effect 2.1196 -14.3930 -0.1692 -0.2798 2.3042
barriers 0.80 -2.52 -0.33 -0.64 0.98
cross-price effect -0.2166 0.0627 0.0011 0.0272 -0.3043
-0.80 0.68 0.02 0.59 -1.22
state price effect 0.5465 0.2097 -0.4790 -0.5553 -0.2178
controls 0.45 0.40 -1.62 -2.01 -0.18
cross-price effect -0.0666 -0.0624 0.0305 0.0176 -0.0286
-0.52 -0.76 0.82 0.58 -0.21
trade & price effect 1.1757 11.6320 -0.8438 -0.6011 0.0253
investment 0.73 1.62 -2.01 -1.43 0.02
barriers cross-price effect -0.2178 -0.1731 0.0588 0.0459 -0.0644
-1.07 -1.27 0.83 0.70 -0.27
inward price effect 0.7832 -0.6636 -0.6827 -0.6446 0.2045
oriented 0.44 -1.08 -1.63 -1.68 0.12
regulations cross-price effect -0.0895 -0.0294 0.0339 0.0321 -0.1151
-0.50 -0.34 0.70 0.84 -0.63
foreign price effect 0.6240 0.7570 -0.3057 -0.2615 -0.1422
ownership 0.79 1.72 -1.63 -1.04 -0.16
barriers cross-price effect -0.1061 -0.0710 0.0290 0.0197 -0.0095
-1.12 -1.02 0.81 0.58 -0.08
regulatory price effect 1.5535 -0.8522 -0.9596 -0.9030 0.2521
barriers 0.61 -1.05 -1.48 -1.08 0.13
cross-price effect -0.2411 0.2456 0.0890 0.1287 -0.0944
-0.71 1.40 0.75 0.91 -0.35
tariffs price effect -0.0236 -0.1966 0.2329 -0.3838 3.6316
-0.01 -0.32 0.55 -1.19 2.68
cross-price effect -0.0167 -0.0872 -0.0136 0.0208 -0.4051
-0.09 -0.92 -0.26 0.54 -2.43
obs 107 115 143 178 101
Note: Each cell corresponds to a separate gravity regression. Detailed estimations in Appendix 1B. Figures in bold mean significant at the 10% level or more; t-statistics in italics.
TABLE 3: LONG RUN VERSUS SHORT RUN ESTIMATION . TOTAL SERVICES IMPORTS AND FDI.
SERVICES IMPORTS FDI
LONG RUN SHORT RUN (1) LONG RUN SHORT RUN (1) TRADITIONAL COMPOSITE
DEMAND COMPOSITE DEMAND TRADITIONAL COMPOSITE DEMAND COMPOSITE DEMAND
APPROACH APPROACH APPROACH APPROACH APPROACH APPROACH
country dummies yes yes yes yes yes yes
gravity controls yes yes
equilibrium correction ( ) -0.0653 yes -0.0033 yes
-3.56 -0.09
log FDI (-1) 1.2698
7.33
log IMPORTS (-1) 17.1519
0.10
product market price effect -3.0970 -0.2155 -19.6094 -1.7131
regulation -5.09 -1.80 -1.77 -2.75
cross-price effect 0.3128 0.0309 1.6663 0.1450
4.29 2.38 1.51 2.42
entrepreneur price effect -3.4875 -0.0212 -26.9023 -3.1044
barriers -5.60 -0.12 -4.38 -3.75
cross-price effect 0.3248 0.0163 2.3448 0.2777
5.07 1.03 4.04 3.66
state price effect -2.1423 -0.1377 -12.8625 -1.1844
controls -4.93 -1.51 -2.09 -2.55
cross-price effect 0.2265 0.0172 1.0661 0.0992
4.13 1.60 1.72 2.21
trade & price effect -4.0755 -0.3294 -2,500.0000 -1.1383
investment -4.11 -2.53 -0.01 -1.73
barriers cross-price effect 0.4228 0.0387 276.4362 0.0991
3.65 2.68 0.01 1.40
inward price effect -2.6390 -0.1302 -17.4365 -2.0770
oriented -5.36 -1.11 -3.16 -3.18
regulations cross-price effect 0.2671 0.0237 1.4716 0.1773
4.57 2.04 2.71 2.99
foreign price effect -1.7170 -0.1867 -22.9961 -0.7150
ownership -4.31 -2.86 -0.59 -2.10
barriers cross-price effect 0.1667 0.0133 2.2404 0.0739
3.43 1.80 0.56 2.11
regulatory price effect -2.4710 -0.0921 -45.4919 -2.6277
barriers -1.67 -0.78 -0.53 -2.81
cross-price effect 0.2247 0.0117 4.9169 0.2767
1.49 0.98 0.52 2.74
tariffs price effect -4.1267 -0.0177 -47.8577 0.1621
-4.19 -0.08 -0.78 0.31
cross-price effect 0.4016 0.0062 4.3394 -0.0301
4.04 0.33 0.76 -0.64
Observations 190 180 180 173 172 172
(1) Short run estimation for the composite demand approach with the long run sample, to control for potential sample bias. Note: Figures in bold mean significant coefficients at 10%-level or more; t-statistics in italics.