• No results found

Material risks to sustainable low carbon infrastructure transitions

N/A
N/A
Protected

Academic year: 2021

Share "Material risks to sustainable low carbon infrastructure transitions"

Copied!
29
0
0

Loading.... (view fulltext now)

Full text

(1)

School of something

FACULTY OF OTHER

SRI & IRI

FACULTIES OF ENVIRONMENT & ENGINEERING

Material risks to sustainable low

carbon infrastructure transitions

Jonathan Busch

(2,1)

Phil Purnell

(1)

, Julia Steinberger

(2)

, Katy Roelich

(1,2)

, David Dawson

(1,2)

,

Ruairi Revell

(1)

(1)

!

Institute for Resilient Infrastructure, School of Civil Engineering

(2)

!

Sustainability Research Institute, School of Earth and Environment

(2)
(3)
(4)
(5)
(6)

Embedding new low CO

2

technology

introduces

critical materials

into

infrastructure:

!

e.g. N

Ndd - motors/generators for wind

turbines & electric vehicles

!

Not just elements: e.g. aggregates

!

Scale of infrastructure means that change

in demand can be a

step-change

::

Multiples, not fractions

!

Previously abundant materials

may

become critical

(7)

Properties

Criticality

Model

Exposure to

disruption

Re

co

ve

ra

bi

lit

y

irem

u

e

q

n

e

ts

r

l

(K

a

i

g

r

)

e

t

a

M

xe

d

ni

no

it

pu

rsi

d

yl

p

p

u

S

P

ot

en

tia

l s

ub

sti

tuti

ons

Technology

mix

Material

intensity

Material

data

Strategy/

Technology

Technology

options

Local

properties

(8)
(9)

PURPOSE:"

"understand the stocks and flows of materials in

infrastructure."

"

OUTCOME:"

"Identify where/when supply risks appear and what

interventions can mitigate against them. "

"

!

(10)

Three key features:"

"1. Infrastructure "

"

"

focused on the scale and complex technological basis of

"

infrastructure.

"

"2. Dynamic "

"

"

to enable a dynamic assessment of criticality.

"

"

3. Hierarchical!

!

!

to allow analysis of recovery and substitution of materials and

"

technologies.

"

"

"

!

(11)

In-use Stock

In-use Stock

Uptake

In-use Stock

In-use Stock

Infrastructure

Technology

Structure

Component

Material

Material Mix

Recovery Recovery Recovery

Waste

Waste

Waste

Virgin

Inflow

Virgin

Inflow

Virgin

Inflow

(12)

Low Carbon Vehicles!

in the!

(13)

The Economics of

Low Carbon Cities

A Mini-Stern Review

for the Leeds City Region

Andy Gouldson, Niall Kerr, Corrado Topi, Ellie Dawkins, Johan Kuylenstierna, Richard Pearce.

C

2

Centre for Climate Change Economics and Policy

(14)

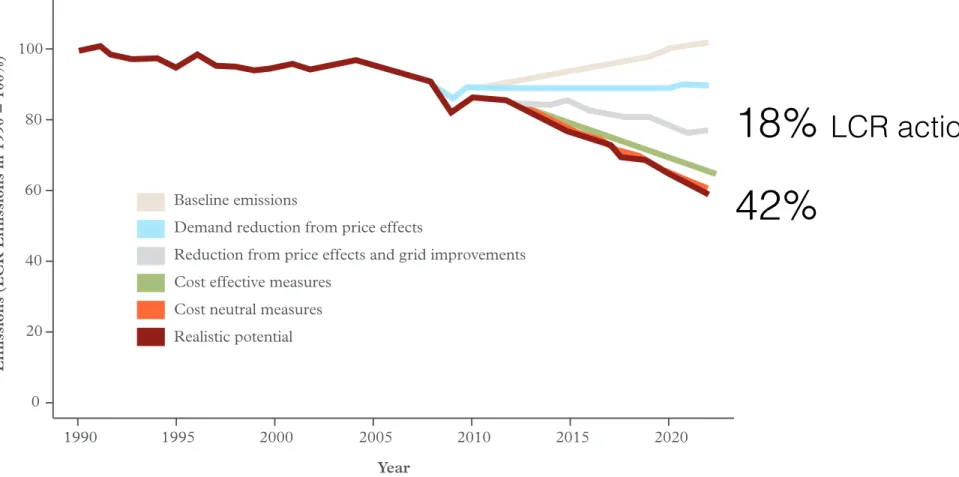
1990 1995 2000 2005 2010 2015 2020 0 20 40 60 80 100 Year Emissions (LCR Emissions in 1990 = 100%) Realistic potential

Demand reduction from price effects

Reduction from price effects and grid improvements Cost effective measures

Cost neutral measures Baseline emissions

Figure 1: Baselines and Analysis of Price Effects, Grid Decarbonisation and Cost Effective, Cost Neutral and Realistic Potential

42%

18%

LCR actions

(15)

!

Transport Sector!

!

Carbon emissions reduction of 2.5% between 1990

and 2022, and:!

the carbon savings available through the

widespread adoption of hybrid and electric

vehicles are by far the most significant.!

!

“ "

(16)

!

Technologies!

Vehicles

Internal

Combustion

Engine

Hybrid

Plug-in

Hybrid

Electric

Catalytic

Converter

Battery

NiMH

NdFeB

Motor

Battery

Li-ion

(17)

!

Lithium!

>80% of global lithium reserves are in Chile and China.

!

Risk Lists:!

!

B

BG

GSS

66..77//1100

A

AEEA

A//D

Deeffrraa

H

Hiigghh R

Riisskk

(18)

!

Neodymium!

“The US and the EU asked

Beijing to clarify its policy

on mineral exports after

C

Chhiinnaa ssttooppppeedd sshhiippppiinngg ttoo

JJaappaann..

“The stoppage followed a

spat between China and

Japan last month over

islands whose ownership is

disputed.”

(19)

!

Scenario: Business as Usual (BAU)!

0!

50000!

100000!

150000!

200000!

250000!

2007

!

2008

!

2009

!

2010

!

201

1!

2012

!

2013

!

2014

!

2015

!

2016

!

2017

!

2018

!

2019

!

2020

!

2021

!

2022

!

Vehicle

sales

!

Year!

ICE Vehicles

Hybrid Vehicles

(20)

!

Scenario: Ambitious (Amb)!

0

20000

40000

60000

80000

100000

120000

2007 2008 2009 2010 2011 2012 2013 2014 2015 2016 2017 2018 2019 2020 2021 2022

Vehicle

sales

!

Year

!

ICE Vehicles

Hybrid Vehicles

Plug-in Hybrid Vehicles

Electric Vehicles

(21)
(22)

!

Results: Lithium demand !

0!

10!

20!

30!

40!

50!

60!

70!

80!

2007!

2008!

2009!

2010!

2011!

2012!

2013!

2014!

2015!

2016!

2017!

2018!

2019!

2020!

2021!

Lithium (g/yr)

!

Year!

Amb Low

Amb High

(23)

!

Results: Neodymium demand!

0

!

5

!

10

!

15

!

20

!

25

!

30

!

35

!

40

!

45

!

2008

!

2009

!

2010

!

2011

!

2012

!

2013

!

2014

!

2015

!

2016

!

2017

!

2018

!

2019

!

2020

!

2021

!

Neodymium (g/yr)

!

Year!

BAU Low

BAU High

Amb Low

Amb High

(24)

!

Results: Neodymium stocks!

0

!

100000

!

200000

!

300000

!

400000

!

500000

!

600000

!

700000

!

800000

!

900000

!

2010

!

2011

!

2012

!

2013

!

2014

!

2015

!

2016

!

2017

!

2018

!

2019

!

2020

!

2021

!

2022

!

Neodymium (kg)

!

Year!

BAU Low

!

BAU High

!

Amb Low

!

Amb High

!

(25)
(26)

!

Key outcomes!

!

Step changes in Lithium and Neodymium demand on the

order of current consumption.!

!

!

Short timescale of lithium demand increase may cause

problems for supply.!

!

Significant resources of Neodymium and Lithium will be

in in-use technologies.!

!

Technological solutions to climate change bring their own

(27)

!

Future work!

!

Vulnerability analysis based on dynamic demand and

geopolitical factors.!

!

Potential for recovery in reducing future demand.!

!

!

Work with technology stocks and flows – recovery of

components for re-use. (e.g. magnets not neodymium)!

!

Expanded system boundaries – include renewable

(28)

Thanks!

Contact: [email protected]!

(29)

Figure

Figure 1:  Baselines and Analysis of Price Effects,  Grid Decarbonisation and Cost Effective,  Cost Neutral and Realistic Potential

References

Related documents

Gignoux ( 2011 ) and serves as a lower bound estimate of IOp. Indeed, it is de- signed in such a way that adding new potentially unobserved circumstances can only increase the share

Level II Certification Level III Certification 5 days classroom LOG-201B Intermediate Acquisition Logistics LOG LOG - - 201B 201B Intermediate Intermediate Acquisition

Neethling, L. The determinants of academic outcomes. The 2015 Conference of the Economic Society of South Africa. Predicting freshman persistence and voluntary dropout decisions

The development of intercultural communication has received renewed attention in the professional literature in the past decade. In response to changes brought about by a

The primary outcome was HbA1c across the study duration, and the primary null hypothesis to be tested was that there was no signi fi cant difference in HbA1c change from baseline

It is concluded that from elemental analysis, IR, conductance, electronic spectra, magnetic and conductance measurements, the ATS-Schiff base behaves as a

The principles of international criminal law have witnessed a major development and generated concepts and new principles at the level of wished International justice, devoted by

Cost analysis shows that the simplification brought by the cluster-driven approach is justified when the expected planning costs resulting from scheduling 1 PM strategy instead of