Dis cus si on Paper No. 14-071
Combining Technology and Work
Organization: An Analysis of Complemen
tarity between IT and Decentralization
across Firms of Different Size
Dis cus si on Paper No. 14-071
Combining Technology and Work
Organization: An Analysis of Complemen
tarity between IT and Decentralization
across Firms of Different Size
Fabienne Rasel
Download this ZEW Discussion Paper from our ftp server:
http://ftp.zew.de/pub/zew-docs/dp/dp14071.pdf
Die Dis cus si on Pape rs die nen einer mög lichst schnel len Ver brei tung von neue ren For schungs arbei ten des ZEW. Die Bei trä ge lie gen in allei ni ger Ver ant wor tung
der Auto ren und stel len nicht not wen di ger wei se die Mei nung des ZEW dar.
Dis cus si on Papers are inten ded to make results of ZEW research prompt ly avai la ble to other eco no mists in order to encou ra ge dis cus si on and sug gesti ons for revi si ons. The aut hors are sole ly
Combining Technology and Work Organization:
An Analysis of Complementarity between IT and
Decentralization across Firms of Different Size
Fabienne Rasel
∗September 2014
Abstract
This paper examines whether information technology (IT) and decentralized work organization are complementary only for large firms or also for smaller firms. Empirical evidence, which suggests complementarity between IT and decentraliza-tion, is mainly based on large firms. Using data from a sample of 3292 SMEs and of 598 larger firms from the manufacturing and service sector in Germany, I can observe firms’ IT intensity in terms of enterprise software and computer use and whether firms have a decentralized work organization. I find that SMEs with de-centralized work practices tend to use IT more intensively. Moreover, for the sample of SMEs, IT and decentralized work organization are individually associated with higher productivity but the combination of IT and decentralization does not yield a productivity premium. Contrarily, for the sample of larger firms, the results show that the productivity of IT depends positively on decentralization. The findings sug-gest that combining IT and decentralized work organization seems to be a successful strategy only for larger firms.
Keywords: information technology; decentralized work organization;
comple-mentarity; productivity; enterprise software; firm-level data
JEL codes: D22, D24, L20, O33
∗ZEW Mannheim and Center for Doctoral Studies in Economics, University of Mannheim, email:
rasel[at]zew.de, Centre for European Economic Research (ZEW), ICT Research Department, L7, 1; 68161 Mannheim; Germany. For further projects of the author see: http://www.zew.de/staff_frl. I thank Irene Bertschek, Michael Kummer, Francois Laisney, Jörg Ohnemus, Michael R. Ward, Michael Zhang and participants at ZEW internal seminars, the PhD seminar in Industrial Organization at the University of Mannheim, the ZEW Summer Workshop for Young Economists 2014 and the EARIE 2014 for valuable comments and Jakub Tecza for helpful research assistance. Financial support for this research from the German Federal Ministry of Education and Research (BMBF) within the project "The Productivity of IT-based Services" is gratefully acknowledged. All remaining errors are mine.
1
Introduction
Information and communication technologies (ICT) have been important drivers of productivity growth and innovation over the last 20 years.1 Moreover, empirical evidence has shown that ICT productivity returns are not identical across firms and countries but they may vary depending on different work organization and human resource practices (e.g. Bresnahan et al. (2002), Bloom et al. (2012)). Thus, a key conclusion from this evidence is that effective use of ICT should be accompanied with appropriate work organization. In particular, workplace practices that allow for decentralized decision-making and reward individual effort have turned out to improve the effective use of ICT. However, most of the empirical evidence is from large firms, mainly due to data availability, and it remains an open question whether the findings on effective implementation of ICT can be generalized for smaller firms. Generally, firms of different size may differ in their ability to employ ICT or they may have made different levels of complementary organizational investments (Tambe and Hitt (2012)).
This paper tests the hypothesis on the complementarity between IT and decentralized work organization for small and medium-sized firms (SMEs) and compares the results from the sample of smaller firms to those from larger firms. The empirical analysis sheds light on the relationship between IT use, decentralized work organization practices and productivity for firms of different size. The data I use is a unique sample of 3292 SMEs and 598 larger firms from the manufacturing and service sector in Germany. It is an unbalanced panel covering the years 2004, 2007 and 2010. For the empirical analysis of the relationship between IT and decentralization and their productivity contributions, I proceed in two steps. First, I analyze by conditional correlation regressions whether firms with decentralized work practices are more IT intensive. Second, I examine the productivity impacts of these two factors by estimating a Cobb-Douglas production function that is augmented by IT and work organization as additional inputs and that allows for interaction effects between these two inputs.
My main measure for firms’ IT intensity is the firms’ usage intensity of enterprise software systems. The considered enterprise software systems are enterprise resource planning (ERP), supply chain management (SCM) and customer relationship management (CRM), which are among the most widely diffused enterprise software systems. Such systems assist firms in col-lecting, storing and using information in the value creation process. Therefore, they can be viewed as good proxies to capture the improved information availability through modern IT. Additionally, I take account of firms’ IT intensity by the share of employees using mainly com-puters for work. Decentralized work organization is measured by the existence of a business unit with own profit and loss responsibility. Moreover, firms’ use of performance pay is used as another measure that reflects decentralization of work and responsibility. Performance pay also indicates whether firms remunerate good performance.
To the best of my knowledge, this paper is the first analysis on complementarity between IT and decentralization that compares findings from smaller firms to larger firms. Even though Tambe and Hitt (2012) compare IT returns between midsize and large firms, they cannot include work organization in their productivity analysis due to data limitations. The comparison between SMEs and larger firms allows examining whether findings from large firms are valid for firms of smaller size, too. There might be reasons to expect the complementarity of IT and decentrali-zation not to be present for small firms because of different IT usage ability and different levels of IT-related complementary investments across firm size, such as skills or appropriate work organization (Tambe and Hitt (2012), Giuri et al. (2008)). Small firms might on average have lower demand for IT-related complements, for instance, due to a lower amount of information that has to be processed and coordinated (Giuri et al. (2008)). Moreover, the paper contributes to a better understanding of the role of IT, work organization and their interactions for explaining productivity differences among firms of smaller size, given that there is few evidence on the productivity contributions of combining these two factors for smaller firms.
My results show that in line with the complementarity hypothesis, SMEs with a decentralized work organization and performance pay use IT more intensively. Large firms are only signifi-cantly more IT intensive when using performance pay. Although both, IT and decentralization, are individually associated with higher SME productivity, the results do not reveal robust evi-dence for a productivity effect from combining IT and decentralization. Only the combination of IT and performance pay is weakly associated with higher productivity for SMEs. In con-trast, the results for large firms show a significant productivity effect for the combination of IT and decentralization as it has already been found in prior research. The comparison of the results for SMEs and larger firms suggests that only larger firms benefit from combining IT and decentralized work organization.
The remainder of the paper is organized as follows: In the next section, I give an overview of the key insights from the literature on IT productivity. The focus is on the complementary relation between IT and organizational practices and on enterprise software systems. The third section presents the data and descriptive statistics. Section four illustrates the empirical methods to test for complementarity. Section five discusses the empirical results and conducts robustness checks and section six concludes with suggestions for future research.
2
Literature and Background Discussion
ICT productivity returns have been shown to vary across countries and firms, which has been summarized in the so-called "productivity puzzle" of ICT.2 One explanation for the measured heterogeneity in the productivity contributions of ICT is seen in different levels of complementary organizational investments, such as workplace organization and business process re-engineering
across firms and countries. For instance, Brynjolfsson and Hitt (2003) suggest that a possible explanation why estimated IT output elasticities from firm-level studies have often been higher than the IT contribution found with aggregate data from national accounts, might be due to complementary organizational factors. Decentralized work organization is an example for such a complementary factor, that is partly captured by the estimated IT coefficient if it is not explicitly considered in the analysis. Several studies can incorporate work organization and highlight the importance of decentralized work organization in order to derive the full potential of IT (e.g. Bresnahan et al. (2002), Black and Lynch (2001) or Bloom et al. (2012)). This interdependence between ICT and appropriate work practices and organization is summarized in the hypothesis
on complementarity between ICT and work organization.3
The theoretical framework for organizational complementarities is derived in the canonical paper on production complementarities by Milgrom and Roberts (1990). They define that organiza-tional factors are complements when there are nonconvexities with respect to the output function in a firm’s decision whether to adopt any or all of a group of activities that complement new technologies. The nonconvexities in the output function imply that the performance gain of implementing (weakly) complementary organizational factors jointly is higher (or at least equal) than the sum of the performance gains when the factors are implemented in isolation. Based on this reasoning, two factors are also considered as complementary when firms rather adopt the cluster of practices than the practices individually. In terms of factor demand, two factors are complementary if a rise in demand for one factor also raises demand for the other factor. Complementarities between organizational practices can explain differential productivity effects between firms with different levels of those practices.
A complementary relationship between IT and a decentralized work organization can be theo-retically underpinned by the difficulty to communicate specific knowledge and limits of people’s information processing capacity. If knowledge that is valuable for firm performance is held by employees but difficult to transmit, and information overload puts a constraint on the amount of information that can be processed by decision-makers at the top of the hierarchy, then IT is optimally associated with decentralized authority that gives decision rights to lower levels of the hierarchy (Hitt and Brynjolfsson (1997)).
Generally, an organizational structure can be characterized as decentralized if not only the top management has decision-making authority but also employees at lower levels of the hierarchy.4 The scope of decision authority may cover decisions about investment, recruiting, product in-novations or pace of work. Thus, decentralization implies that decision-making is spread more evenly throughout the firm in contrast to a centralized firm where decisions are only made at the top of the organizational hierarchy. Decentralization of decision rights implies decentralization
3See Brynjolfsson and Milgrom (2013) for an overview of the theory behind organizational
comple-mentarities, a definition and empirical studies analyzing complementarities between IT and workplace variables.
4See e.g. Bloom et al. (2010) for an overview about the concept of decentralization in economics. The
of information processing and especially large firms may implement it, given limited capacity of individuals for information-processing and decision-making (Radner (1993)). Possible benefits of decentralization are the reduction of information transfer and communication costs or increased speed of reacting to market changes. Since modern IT reduce information access and processing costs, they are seen as one determinant for decentralization. This mechanism of reduced infor-mation costs causing firms to decentralize is theoretically formalized by Garicano (2000). In his model, the firm is conceptualized as a cognitive hierarchy that has to solve problems of varying difficulty and optimally decentralizes with decreasing information costs.
One of the first empirical studies on the relationship between IT and workplace organization is by Bresnahan et al. (2002) who find that the productivity of IT in large US firms is higher if firms also use workplace practices that allow for decentralized decision-making by teams and employees. Moreover, they analyze the consequences of IT for the skill composition of labour demand and show that firms using the combination of IT and decentralized work organization tend to use more high-skilled labour, which makes them pointing towards the role of IT-enabled organizational change. Black and Lynch (2001) show that US plant productivity is improved the higher the share of nonmanagers using the computer and the higher the education level of workers is. Tambe et al. (2012) find that the combination of IT, decentralization and external focus, which captures a firm’s intensity to observe the market environment and availability to uncover market opportunities, is associated with significantly higher productivity for moderate-size and large US firms.
Recently, Bloom et al. (2013) point towards the differential impact of information versus com-munication technology on the allocation of decision rights within the firm: They show that in-formation technology, measured by ERP, increases worker and plant manager autonomy, making them conclude that IT facilitates information access at lower levels of the hierarchy. Contrarily, communication technology, measured by data networks, decreases decision autonomy at lower levels of the hierarchy because decisions from employees can be more easily transferred to the top of the hierarchy. Mahr and Kretschmer (2010) show that the corporate learning type determines whether IT is more effective with greater decentralization or centralization: German manufac-turers with an explorative learning type have higher IT productivity returns with greater degree of decentralization, while IT and centralization turn out to be complementary for exploitative learning type firms.
The complementarity relationship between IT and work methods has also been shown to explain geographical variation in IT returns. Bloom et al. (2012) argue that the US advantage in IT-related productivity effects in comparison to Europe, that has been observed from the mid-1990s, can be attributed to differences in used work and human resource practices between the US and Europe: They show that people management practices which foster individual target setting and monitoring, promotions, rewards, hiring and firing are complementary to IT capital and that US-owned firms employ such practices more intensively than European firms.
Evidence on ICT productivity returns and organizational complementarities in SMEs is still scare. Tambe and Hitt (2012) find on average higher long-run IT returns for large than for midsize US firms, whereas the midsize firms materialize the gains from IT more quickly. They argue this pattern of IT returns to be consistent with the hypothesis that small firms have lower adjustment costs but large firms are better equipped to benefit from IT-related comple-ments. Arvanitis (2005) finds for Swiss firms, mainly SMEs, no evidence for complementarity between IT and decentralized workplace practices and that the productivity contribution of flexible and decentralized workplace practices is lower than the contribution of ICT or human capital. Bugamelli and Pagano (2004) argue that complementary investments in organizational capital and human capital have acted as barriers to investment in ICT for Italian manufacturing firms, among them mainly SMEs. Also for Italian, mainly SMEs from the manufacturing sector, Giuri et al. (2008) find that productivity gains from combining IT and organizational change do not seem to be present in small firms. They only find evidence for complementarities between organizational change and skills. However, given differences in characteristics between small and large firms related to complexity and flexibility of work routines, financial capabilities, amount of information or skill composition that originate from the different size, the authors argue that there might be reasons to believe that complementarities between IT and organizational change are generally less present in SMEs: For instance, since large firms have to coordinate more information, tasks and people, they will have greater demand for ICT and complementary investments such as workplace reorganization and should also benefit more from implementing the complementary system.
In empirical studies, ICT capital is often measured by investment in hardware, software and/or telecommunication equipment, possibly used to construct an ICT capital stock variable, or by the number of computers per employee available in the firm. A particular type of information technology applications are enterprise software systems. Enterprise resource planning (ERP), supply chain management (SCM) and customer relationship management (CRM) are three widely employed enterprise software systems. These software systems have changed drastically how firms can store, access, share, exchange and analyze information relevant for business op-erations. In particular, these systems have increased the speed of information gathering and availability and they feature an integrated database. Consequently, the improved information basis should support firms in making more solid decisions and in particular, in reacting more timely to problems and market trends. Moreover, enterprise systems also allow for transaction automation, for instance of financial transactions within ERP systems.
While ERP is a general purpose software covering information from various business processes,
SCM and CRM software provide support for specific business processes of the value chain.5
Moreover, ERP is a software to organize information mainly from inside the firm, SCM and CRM reach beyond internal firm boundaries. ERP system is the generic name for a large-scale database that integrates data and information in real-time from any part of the business activity, 5This paragraph is based on information about properties and benefits of enterprise software systems
such as machine failures within the process of production, financial or marketing data or the data from the human resource department, and stores this data centrally in a unified system. The real-time accessibility of all kind of data allows managers to obtain an up-to-date overview of the performance of the different business functions, which makes it possible to recognize problems and market opportunities at an early stage. SCM and CRM are both software systems, which are meant to support specific business processes. SCM software capabilities help organizing the value chain and operations management in contact to suppliers or buyers. They provide real-time planning capabilities with the aim to improve the efficiency of the value chain and to react more quickly to demand and supply. CRM software provides tools to systemize customer relationship management with the aim to improve customer satisfaction and customer loyalty. While there is a large literature, generally from the Information Systems (IS) and business studies literature, on qualitative assessments of enterprise software systems and case-study based evidence, often for one specific enterprise software system, there are few econometric studies that assess the performance effects of enterprise software systems using firm-level data from a larger sample of firms. The existing evidence is mixed, although, pointing towards a positive relationship between the use of some of the systems and performance. With data from Korean SMEs, SCM use is significantly and positively associated with total factor productivity (TFP), while ERP and CRM are not (Shin (2006)). German firms benefitted most from the systems when they had adopted all three systems, ERP, SCM and CRM, together (Engelstätter (2013)). US firms with positive performance gains from ERP adoption kept on investing in SCM and/or CRM, which led to additional improvement gains (Aral et al. (2006)). There are only few studies on complementarities between enterprise software systems as particular examples of IT and work organization. López (2012) finds that CRM use and organizational change are complementary in Spanish firms from the manufacturing and service sector, while no significant productivity increase is found for the combination of ERP use with organizational change. Aral et al. (2012) show that the combination of human resource practices, which monitor employees’ performance, and performance pay complements special software for human capital management, which is often part of an ERP system.
The purpose of this paper is to shed new light on the complementarity between IT and decen-tralized work organization and on the productivity of these two factors in SMEs in comparison to large firms. The next section presents the data set, which is followed by a discussion of the empirical strategies to test for complementarity.
3
Data
The data used for the analysis comes from three waves of the ICT survey collected from the Centre for European Economic Research (ZEW) with which an unbalanced panel data set is
constructed that includes information from the three years 2004, 2007 and 2010.6 The ICT survey is a firm-level survey with the focus on the diffusion and the use of information and com-munication technologies of firms from the manufacturing and service sector located in Germany with a firm size starting with five employees. The survey has been until now conducted five times, for the first time in 2000, then in 2002, 2004, 2007 and in 2010. For each wave roughly 4,400 firms were surveyed and the data is stratified according to industries, to three size classes and to two regions (East/West Germany). The survey is constructed as an unbalanced panel. Consequently, some firms were surveyed in each wave, others only in certain waves and others only once. With respect to the topics and questions asked, some questions are repeated in each wave, others were only asked in some of the waves. For the analysis in this paper, I use data from the waves of 2004, 2007 and 2010 because from 2004 onwards information on enterprise software use intensity and information on work organization is available. Hence, the time frame of the data represents the diffusion of ICT after 2000, where at least basic ICT, such as the personal computer, might be already more widely diffused among firms. Firms may also have made different choices of complementary investments so that many combinations of IT and work organization might exist. Due to item-non response of variables used in the empirical analy-sis and an unbalanced panel structure, there are 3890 firms in my estimation sample and an overall number of observations of 5260 is obtained.7 Thus, the majority of firms in the sample participated only once in the survey.
Since I want to compare results from smaller firms to those from larger firms, I divide the estimation sample according to employment size. Based on international classifications8, the maximum employment level for a firm to be an SME is not more than 250. Therefore, I classify all firms with at most 250 employees as SMEs. Those firms with exactly 250 employees are included because the descriptive statistics indicate that a large number of firms declare to have 250 employees, which in a telephone-based survey might be said by the interviewee if she does
not know the exact number but expects 250 employees as a decent guess.9 Based on this
classification, 3292 firms are classified as SMEs with an overall number of 4493 observations. Thus, on average 80 percent of the surveyed firms belong to the category of SMEs. Table 12 in the appendix shows the sector composition of the estimation sample in comparison to the totally available data of firms with at most 250 employees. Since the distribution of the estimation sample is not significantly different from the complete data set, it can be assumed that the used sample is representative with respect to the industries. The remaining 598 firms are classified as large firms with totally 767 observations. The industry composition of this sample is similar to the composition of the totally available data for large firms, too (Table 13 6The data is accessible at the ZEW Research Data Centre:
http://kooperationen.zew.de/en/zew-fdz/home.html
7This sample is based on a data set that excludes productivity outliers keeping only firms within the
first and 99th percentile of the labour productivity distribution. Labour productivity is measured by total sales over the number of employees. In total, 51 observations are dropped.
8See e.g. the definition of SMEs by the European Commission:
http://ec.europa.eu/enterprise/policies/sme/facts-figures-analysis/sme-definition/
9The empirical results presented in section 5 do not change qualitatively when firms with exactly 250
in the appendix). As the focus of the empirical analysis is on SMEs, the following descriptive statistics refer only to them. Descriptive Statistics for large firms can be found in the appendix (Table 14 to 17).
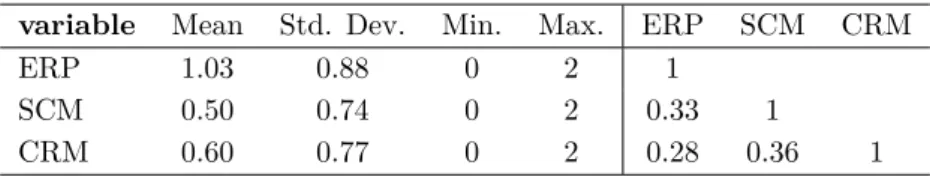
Enterprise software use as a particular type of IT and work organization are the main variables I use in order to test for complementarity between IT and decentralized work organization. The section on enterprise software systems in the survey covers whether firms use an ERP, a SCM or a CRM software asking the firms for no (0), minor (1) or broad (2) use. The question on ERP use was already asked in the 2000 wave, while the questions on SCM and CRM were asked in this form for the first time in 2004. Table 1 shows means and standard deviations for the software use intensity and correlations between them. Among the three software systems, ERP is the most intensively used system. This order is plausible because ERP is the most general software among the three systems. Regarding only the average use of the three software systems (not reported in Table 1), i.e. without distinguishing between usage intensity, across all years 62 percent of the firms in the SMEs sample use ERP, followed by 43 percent using CRM and 35 percent using SCM. For the sample of large firms, almost all firms use ERP (mean = 93.20 percent), and also SCM (mean = 72.40 percent) and CRM (mean = 71.70 percent) are widely diffused. Heterogeneity across large firms is present in the usage intensity (Table 14 in the appendix). The mean usage intensity by large firms is slightly higher for all three software systems in comparison to the small firms. However, at least for SCM and CRM the variation in usage intensity according to the standard deviation is fairly similar for firms of both size categories.
Table 1: Means, Standard Deviations, and Correlations for Enterprise Software Use for SMEs
variable Mean Std. Dev. Min. Max. ERP SCM CRM
ERP 1.03 0.88 0 2 1
SCM 0.50 0.74 0 2 0.33 1
CRM 0.60 0.77 0 2 0.28 0.36 1 Data Source: ZEW ICT Panel 2004, 2007, 2010. N = 4493.
To measure a firm’s IT intensity, I construct an IT intensity indicator based on the usage inten-sity of these three enterprise software systems. I standardize each factor individually through z-scoring and then I sum up the standardized factors and standardize this sum again. The
standardization S is obtained by subtracting the mean µx of the respective variable x within
the overall sample and by dividing by the sample standard deviationSDx of the variable. The
following equation summarizes the construction of the IT intensity indicator:
IT =S(S(ERP) +S(SCM) +S(CRM))
S ∼= x−µx
I add the standardized individual software values into an aggregate IT indicator, which implies that each factor gets equal weight in the indicator, because the hypothesis for equality of coef-ficients among the three standardized software values could not be rejected after a productivity
regression when the standardized values are entered into the regression individually.10 This
standardization yields that the mean of the standardized variables is zero and the standard deviation is one. It provides for each firm a normalized measure of enterprise software systems usage intensity that relates the individual firm’s software intensity to the overall sample mean value and its dispersion. Firms with identical enterprise software use intensity for all three sys-tems have the same value with respect to this indicator and higher values reflect that firms use more of the three considered systems and indicate to use the systems more intensively.
Regarding the interpretation of the indicator, this IT measure provides a picture of the intensity of a firm’s reliance on information for decision-making and for business process organization. Since enterprise software systems facilitate to gather, collect and analyze information, they sup-port in making decisions about product characteristics or strategic considerations as well as in organizing business processes more efficiently. Thus, this IT indicator captures the improved in-formation availability enabled through IT, which is also part of the theoretical arguments behind the complementarity hypothesis between IT and work organization: Improved information use combined with work organization that allows decentralized decision-making and sets incentives for good performance should be particularly beneficial for firms because information can be used timely to recognize problems and trends. For instance, the information can be used to develop new products or services, which might increase productivity. Moreover, IT allows observing performance more easily. Although this IT indicator captures explicitly only a specific part of the firm’s IT use since it only considers enterprise software use, the advantage of its narrow scope is its economic interpretation as proxy for a firm’s intensity of technology-supported use of information as an input into the production process. Even if this IT measure based on the enterprise software systems mismeasures a firm’s IT intensity as well as the extent of the use of information in business processes, the measurement error is likely to downward bias the es-timates for this indicator.11 Moreover, firms with higher values of this indicator will likely also have a higher overall IT capital stock including hardware, all kind of software and telecommuni-cation equipment, which will be needed to make the enterprise software systems work effectively. Therefore, this indicator can be interpreted as a proxy for firms aggregate IT intensity, too. Nonetheless, it still might be that firms with low enterprise software use intensity are IT intensive (Type II error) when they use other types of IT intensively, such as the personal computer (PC). Since the data includes information on a firm’s share of employees working mainly at the computer, I use it as an additional measure for a firm’s overall IT intensity. The share of employees working mainly with the PC can be interpreted as a measure for IT capital or alternatively for labour heterogeneity (Bertschek and Meyer (2009)). This IT measure captures
10The test for equality of coefficients is based on coefficient estimates from the regression specification in
Table 8, column (2).
part of a firm’s hardware and software equipment as well as the extent of the firm’s dependence on the computer as a working tool within its business model.
I measure decentralized work organization by the existence of a business unit with own profit and loss responsibility (BU), such as a profit centre. A similar measure for decentralization is used by Acemoglu et al. (2007) who define a firm as decentralized when its business units are organized as profit centres.12 This measure of decentralization refers particularly to the extent of decision autonomy and responsibility at the manager level below the central management board. Moreover, I include the information whether a firm offers performance pay (PP) to its employees as a further measure for decentralized work practices. This measure reflects the firm’s use of incentive-setting to reward good performance.13
Since the information on both work organization variables is binary, I incorporate them as dummy variables into the regression. In robustness checks, I also compute a count variable that adds the two variables into one measure for decentralization. The organizational practices variables were not asked in the wave of the 2007 survey. In order to not loose information on software use and firm performance from 2007, I replace the organizational practices variables in 2007 with the information of 2010. When this information is not available, due to item non-response or the unbalanced panel structure, I replace the 2007 values with information from 2004. This replacement strategy relies on the assumption of organizational factors being quasi-fixed in the short-run, which is usually made in empirical analyses on the effects of organi-zational practices when only cross-sectional information on those practices is available (see, e.g. Bresnahan et al. (2002) or Bloom et al. (2012)). The work organization variables I use are close to time-invariant in the sample of SMEs as it is indicated by transition probabilities and persis-tence statistics for those firms with multiple participation in the survey (not reported; available upon request). Thus, the assumption of the work organization practices being quasi-fixed in the period of analysis can be supported by the data. This assumption holds also for large firms. Table 2 shows descriptive statistics for the two work organization variables. Across all years, 52 percent of the firms use performance pay, and 28 percent of them have a business unit with own profit and loss responsibility. As for the enterprise software use intensity, the average use of the two work practices is higher in the sample of large firms with 70 percent having a business unit with own profit and loss responsibility and even 85 percent of the firms using performance pay (Table 15 in the appendix).
12Acemoglu et al. (2007) provide a description of the decision authority that managers of business units,
which are organized as profit centres, have. In particular, managers of profit centres have the responsi-bility to monitor revenues and costs. See p. 1773ff.
13Recent research shows empirical evidence for complementarity of decentralization, measured in terms
of the delegation of decision rights from principals to middle management, with performance pay (e.g. Hong et al. (2014)). In this paper, I do not account for a possible complementarity between decentral-ization and performance pay.
Table 2: Means, Standard Deviations, and Correlations for Work Organization Variables for SMEs
variable Mean Std. Dev. Min. Max. Business Unit Performance Pay Business Unit 0.28 0.45 0 1 1
Performance Pay 0.52 0.50 0 1 0.22 1 Data Source: ZEW ICT Panel 2004, 2007, 2010. N = 4493.
Like the IT indicator measures only part of a firm’s IT use, the variables to measure decentralized work organization capture only a small part of a firm’s work organization. Thus, they might mismeasure firms’ decentralization degree and if so, the estimates are downward biased. The mismeasurement problem refers in particular to the intensity of the use of the considered work practices, given that the information on work practices I have is only binary and I do not know how many employees within the firm, for instance, are affected by performance pay or what the scope of decision autonomy is that employees have. Nevertheless, firms which use these work practices might on average probably be more likely to also use other work practices that allow decentralized decision-making and reward performance. In the robustness checks, I also incorporate a dummy variable equal to one when the firm makes use of self-responsible team work. This information serves as another measure for decentralized work that reflects delegation of decision autonomy to employees and not only to managers.
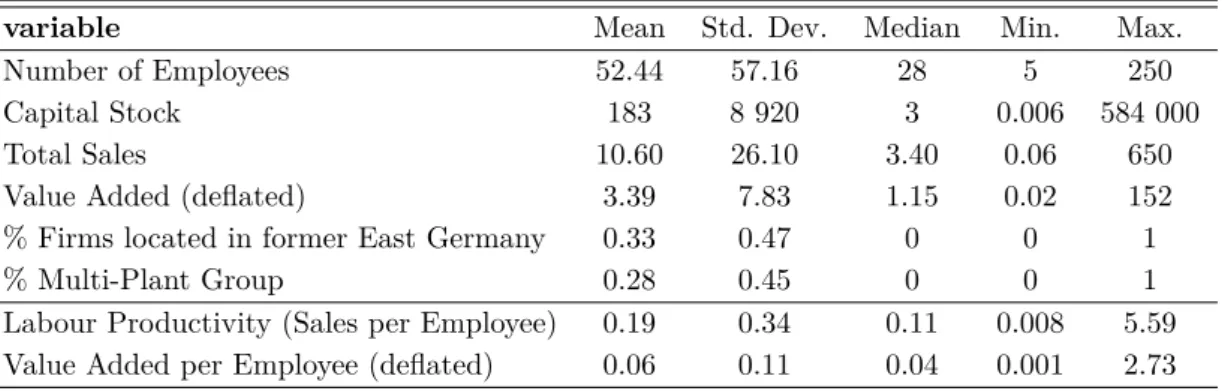
Table 3: Production Function Variables for SMEs
variable Mean Std. Dev. Median Min. Max. Number of Employees 52.44 57.16 28 5 250 Capital Stock 183 8 920 3 0.006 584 000 Total Sales 10.60 26.10 3.40 0.06 650 Value Added (deflated) 3.39 7.83 1.15 0.02 152 % Firms located in former East Germany 0.33 0.47 0 0 1 % Multi-Plant Group 0.28 0.45 0 0 1 Labour Productivity (Sales per Employee) 0.19 0.34 0.11 0.008 5.59 Value Added per Employee (deflated) 0.06 0.11 0.04 0.001 2.73
Data Source: ZEW ICT Panel 2004, 2007, 2010. N = 4493.
The values of gross investment, sales, value added and the respective per capita values are expressed in million Euros. Deflated Values are in prices of 2005.
Table 4: Logarithmic Production Function Variables for SMEs
variable Mean Std. Dev. Min. Max. log(Employment) 3.40 1.08 1.61 5.52 log(Capital Stock) 14.95 1.79 8.71 27.09 log(Value Added) 14.03 1.40 10.05 18.84
Data Source: ZEW ICT Panel 2004, 2007, 2010. N = 4493.
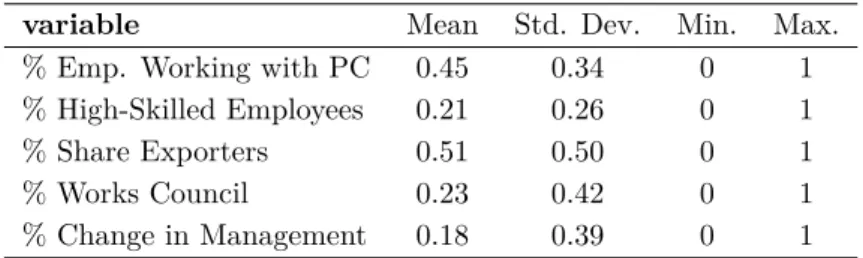
Besides information on ICT, the ICT survey covers information on general firm characteristics, such as total sales, investment or human capital composition of the workforce. Table 3 to Table 5 provide descriptive statistics of further variables used in the empirical analysis. I capture firm performance through deflated value added. Since I do not have exact information, neither on firms’ materials and intermediate inputs nor on firm-specific prices, I use industry-wide information on gross value added together with information on the price evolution from the German National Statistics Agency (Destatis) and combine it with firms’ reported total sales from the survey to obtain a proxy for real value added. Labour input is measured by the number of employees and capital input is obtained by constructing a capital stock from the available gross investment data. In the appendix, I explain in detail the construction of my measures for value added and for the capital stock (see A.2 and A.3, respectively). Moreover, I use as control variables information on the share of high-skilled employees (degree from university, university of applied sciences or university of cooperative education), export status, presence of a works council and whether a change in management happened in the year before the survey period.
Table 5: Means and Standard Deviations for further Firm Characteristics for SMEs
variable Mean Std. Dev. Min. Max. % Emp. Working with PC 0.45 0.34 0 1 % High-Skilled Employees 0.21 0.26 0 1 % Share Exporters 0.51 0.50 0 1 % Works Council 0.23 0.42 0 1 % Change in Management 0.18 0.39 0 1 Data Source: ZEW ICT Panel 2004, 2007, 2010. N =4493.
4
Empirical Methods
In order to test for complementarity between IT and decentralized work organization, I conduct correlation and productivity analyses. These are the two most widely used empirical methods to
study organizational complementarities.14 These two methods complement each other because
each test has the highest statistical power if the other is weakest (Brynjolfsson and Milgrom (2013)). For the correlation analysis and the productivity analysis, I apply pooled ordinary least squares (OLS) with robust standard errors clustered across firms to account for multiple
participation in the survey. Thus, I exploit variation across firms to obtain my coefficient
estimates.
14Athey and Stern (1998) are among the first to discuss an empirical framework to measure organizational
complementarities empirically. See Brynjolfsson and Milgrom (2013) for a survey on the theory and econometrics of studying complementarities in organizations.
4.1
Correlation Analysis
As it has been done in prior work (e.g. Bloom et al. (2012) and Tambe et al. (2012)), I
run a conditional correlation analysis between IT (IT) and the two measures for decentralized work organization (BU and P P) to study whether firms with self-responsible business units or performance pay are also more IT intensive. I use the following regression specification:
ITit =γBUBUit+ωP PP Pit+δlln(f irmsizeit) +λ0Xit+uit
whereistands for the individual firm and tfor the time period.
In the most basic regression specification, I control for firm size through the logarithm of the number of employeesln(f irmsize), for multi-establishment group, for region through a dummy variable if located in East Germany and for a full set of time-interacted industry fixed effects included in the control vectorX.15
In further regression specifications, the control vector includes also the share of high-skilled employees, the share of employees working mainly with the computer, whether the firm exports, existence of a works council or whether the firm experienced a change in management within the period of analysis. All additional control variables serve to rule out alternative explanations for the results of the relationship between IT and work organization. I control for the share of high-skilled employees to take account of the firm’s human capital composition since it has been shown that IT and high-skilled human capital are complementary and are an important factor to explain heterogeneity in IT returns (see, e.g. Draca et al. (2007) for a survey). Furthermore, it has been shown that IT-intensive firms with decentralized work organization employ more high-skilled workers (Bresnahan et al. (2002)). The computer work share is an alternative measure to the enterprise software indicator for firms’ overall IT intensity. It will likely be positively correlated with decentralized work practices if more IT-intensive firms also adopt more decentralized work methods. Moreover, firms with a higher share of employees working mainly at the computer are likely to use enterprise software systems more intensively, too. Additionally, the computer work share can be regarded as measure for labour heterogeneity (Bertschek and Meyer (2009)). Firm’s exporting activities account for the impact of international activities and exposure to foreign competition. Exporting firms have shown to be more technology intensive and more pro-ductive than non-exporters (see, e.g. Bernard et al. (2012), Bertschek et al. (2014)). Moreover, increased foreign import competition has been found to be associated with more decentralization 15This regression specification does not suggest the direction of causality between IT and decentralization
in light of the view in the literature that IT facilitates and thus causes decentralization. Given the properties of my data, I follow Bresnahan et al. (2002) who estimate firms’ short-run demand equations for IT as a function of work organization and human capital. They justify this specification by arguing that IT is the more easily variable factor within the complementary system than the relatively fixed factors of work organization and human capital and that the correlation coefficients provide evidence about complementarities.
and performance-based pay in US firms (Guadelupe and Wulf (2008)). A works council can be seen as a measure for employees’ voice in decision-making and a change in management might have led to higher IT and/or decentralization intensity.
Even though correlations are neither necessary nor sufficient evidence of complementarities (Athey and Stern (1998)), significant and positiveγBU and ωP P coefficients can be interpreted
as support for complementarity between IT measured by enterprise software systems and de-centralized work organization because they reflect that work practices allowing for dede-centralized decision-making and individual authority are associated with more intensive use of enterprise software systems. The correlation analysis can also be interpreted as a factor demand equation where higher IT demand leads to higher demand for decentralization if the two factors are com-plementary. The conditional correlation results reflect empirical relationships between IT and decentralized work organization. They should not be interpreted as causal because the data does not contain information neither on the date of the enterprise software adoption nor on the timing of the implementation of decentralized work organization.
4.2
Productivity Analysis
The productivity analysis is based on a production function analysis that accounts explicitly for IT and work organization as inputs into production and for possible interactions between these two factors. As it is widely used in the IT productivity literature16 and in work on the complementarity relation between IT and organization (e.g. Bresnahan et al. (2002), Bloom
et al. (2012)), I employ a Cobb-Douglas specification that is augmented for IT (IT) and
de-centralized work organization (W O={BU, P P}). The following regression equation formalizes the empirical model:
yit=αc+αllit+αkkit+αITITit+αW Oj X j W Ojit+αIT∗W Oj X j ITit∗W Ojit+λ0Xit+uit
wherej {BU, P P},istands for the individual firm and tfor the time period. The dependent variableyis logarithmized real value added. A firm’s capital stock is represented bykand labour by l, both inputs are in logarithmic values. αc represents the constant and u an idiosyncratic
error term, which captures all unobserved factors. The regression specification features that IT (IT), work organization (W O) and their interaction terms (IT ∗W Oj) are allowed to shift a
firm’s production frontier, i.e. they are modeled as part of the multi-factor productivity. Hence, if they are productivity-increasing, they make the use of capital and labour more productive. Both, IT and the work organization variables, are entered in levels individually as well as their interaction. A positive and significant interaction termαIT∗W Oj can be interpreted as support for complementarity between IT and work organization. It reflects whether the IT productivity contribution depends on work organization and thus whether these factors are interrelated with
respect to productivity. The coefficient estimates for labour and capital are output elasticities and forIT and W O they represent semi-elasticities.
Overall, the control variables are the same as in the correlation analysis. All control variables aim at reducing endogeneity concerns due to omitted variables by capturing organizational factors that will likely be relevant for observed firm heterogeneity in IT use, work organization and value added. With respect to the interpretation of the control variables, in the productivity equation, the computer work share, as another measure for a firm’s IT intensity than the measure based on enterprise software, accounts also for the possibility that the enterprise software variables do not merely capture the productivity effect of computer work if firms with higher enterprise software use also have higher shares of employees working mainly with the computer.
5
Empirical Results
5.1
Correlation Analysis for SMEs
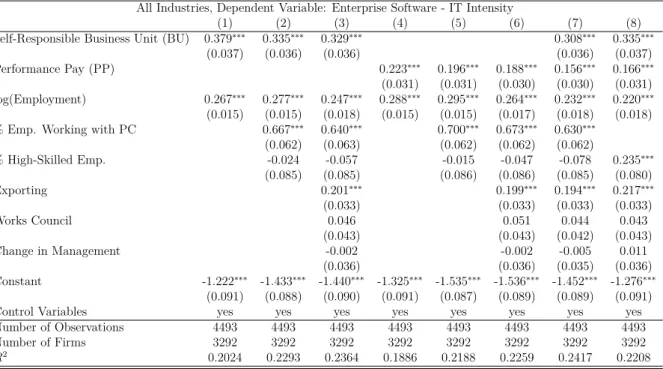
Table 6 shows correlations between the IT indicator and the work organization variables. Col-umn (1) presents a baseline estimate for the intensity of the correlation between IT and the existence of a self-responsible business unit controlling only for firm size, regional location, multi-establishment group and industry-interacted year fixed effects. The coefficient estimate of this measure for decentralized work organization is highly significant indicating that firms with a self-responsible business unit use enterprise software systems more intensively. This result remains robust controlling for additional factors of firm heterogeneity (column (2) and (3)). Among the control variables, the share of employees working predominantly with the PC and exporting increases a firm’s IT intensity statistically significantly. It might seem surprising that the share of high-skilled employees is not significantly positively related to IT intensity, given prior findings on complementarity between IT and high-skilled human capital. This result is mainly due to the high pairwise correlation between this share and the share of employees working mainly at the PC (0.62***). In a regression without the computer work share, the IT intensity as measured by the software indicator and the share of high-skilled employees are significantly and positively correlated (column (8)). These findings reflect that the computer work share captures a significant fraction of a firm’s skill intensity.
Columns (4) to (6) show conditional correlations between IT intensity and performance pay. Firms using performance pay are also more IT intensive. The correlation coefficient of per-formance pay to IT is smaller in size with 0.188 (column (6)) than the correlation coefficient between IT and the existence of a self-responsible business unit with 0.329 (column (3)). This relationship remains valid in a correlation analysis between IT and these two work organization measures together (column (7)).
Table 6: Correlations between Enterprise Software Intensity and Work Organization for SMEs
All Industries, Dependent Variable: Enterprise Software - IT Intensity
(1) (2) (3) (4) (5) (6) (7) (8) Self-Responsible Business Unit (BU) 0.379∗∗∗ 0.335∗∗∗ 0.329∗∗∗ 0.308∗∗∗ 0.335∗∗∗
(0.037) (0.036) (0.036) (0.036) (0.037) Performance Pay (PP) 0.223∗∗∗ 0.196∗∗∗ 0.188∗∗∗ 0.156∗∗∗ 0.166∗∗∗
(0.031) (0.031) (0.030) (0.030) (0.031) log(Employment) 0.267∗∗∗ 0.277∗∗∗ 0.247∗∗∗ 0.288∗∗∗ 0.295∗∗∗ 0.264∗∗∗ 0.232∗∗∗ 0.220∗∗∗
(0.015) (0.015) (0.018) (0.015) (0.015) (0.017) (0.018) (0.018) % Emp. Working with PC 0.667∗∗∗ 0.640∗∗∗ 0.700∗∗∗ 0.673∗∗∗ 0.630∗∗∗
(0.062) (0.063) (0.062) (0.062) (0.062) % High-Skilled Emp. -0.024 -0.057 -0.015 -0.047 -0.078 0.235∗∗∗ (0.085) (0.085) (0.086) (0.086) (0.085) (0.080) Exporting 0.201∗∗∗ 0.199∗∗∗ 0.194∗∗∗ 0.217∗∗∗ (0.033) (0.033) (0.033) (0.033) Works Council 0.046 0.051 0.044 0.043 (0.043) (0.043) (0.042) (0.043) Change in Management -0.002 -0.002 -0.005 0.011 (0.036) (0.036) (0.035) (0.036) Constant -1.222∗∗∗ -1.433∗∗∗ -1.440∗∗∗ -1.325∗∗∗ -1.535∗∗∗ -1.536∗∗∗ -1.452∗∗∗ -1.276∗∗∗ (0.091) (0.088) (0.090) (0.091) (0.087) (0.089) (0.089) (0.091) Control Variables yes yes yes yes yes yes yes yes Number of Observations 4493 4493 4493 4493 4493 4493 4493 4493 Number of Firms 3292 3292 3292 3292 3292 3292 3292 3292
R2 0.2024 0.2293 0.2364 0.1886 0.2188 0.2259 0.2417 0.2208
Significance levels: ∗: 10% ∗∗: 5% ∗ ∗ ∗: 1%. Control variables include industry dummy variables based on two-digit classification interacted with a full set of year fixed effects, a dummy variable for location equal to one if the firm is in one new German Bundesland (member state), i.e. formerly East Germany, and a dummy variable if the firm belongs to a multi-plant group. Robust standard errors clustered at the firm level in parentheses.
Overall, the correlation analysis provides evidence that firms with work practices that allow de-centralized decision-making and emphasize individual incentives tend to use enterprise software more intensively. Therefore, in line with the hypothesis on the complementarity between IT and decentralization, it holds for SMEs that firms with higher IT intensity are more likely to have also adopted a decentralized work organization. However, it cannot be completely ruled out that unobserved factors, such as management ability, bias the estimates or are the true driving force behind the results, even though I control for a large amount of relevant unobserved heterogene-ity. Moreover, the values on the R-Squared of the correlation regressions are only all around 0.20 to 0.25. These rather low values indicate that only a small fraction of the variation in en-terprise software use intensity is explained by work organization and the other considered firm characteristics. In the next section, I examine with productivity analyses whether combining IT and decentralized work organization leads to improved performance.
5.2
Productivity Analysis for SMEs
Table 7 shows the results from different specifications of the productivity regressions to analyze the productivity of IT and decentralized work organization and whether these organizational factors are complementary according to the productivity analysis. Column (1) provides base-line estimates for a standard Cobb-Douglas production function with labour and capital inputs. The coefficients for labour and capital are statistically significant and plausible in magnitude.
Column (2) introduces a baseline estimate for the average productivity contribution of IT mea-sured by enterprise software usage intensity for the time periods 2004, 2007 and 2010. The point estimate is about 0.096 and highly significant reflecting that firms with more intense enterprise software use are more productive. Column (3) controls for the share of employees working mainly at the PC as additional measure for a firm’s IT intensity. The coefficient of the enterprise software indicator decreases slightly in size to 0.062 but remains highly significant. This significantly positive coefficient supports the hypothesis that firms with higher intensity of technology-supported use of information within the value creation process are more productive. As found in prior analysis (e.g. Bertschek and Meyer (2009)), the estimate for the share of employees working mainly at the computer is significantly positive, too. This result indicates that higher computer work shares are linked with higher productivity levels. Altogether, firms with higher IT intensity, either through enterprise software use or employees working mainly with the computer, turn out to be the more productive ones.
Table 7: Productivity Regressions of IT and Work Organization for SMEs
All Industries, Dependent Variable: log(Value Added)
(1) (2) (3) (4) (5) (6) (7) (8) (9) IT - Index(ERP+CRM+SCM) 0.096∗∗∗ 0.062∗∗∗ 0.045∗∗∗ 0.030 0.031 0.026 0.049∗∗ 0.040∗∗∗
(0.013) (0.013) (0.013) (0.019) (0.019) (0.019) (0.020) (0.013) Self-Responsible Business Unit (BU) 0.153∗∗∗ 0.158∗∗∗ 0.155∗∗∗ 0.152∗∗∗ 0.168∗∗∗ 0.148∗∗∗
(0.030) (0.030) (0.030) (0.030) (0.031) (0.029) Performance Pay (PP) 0.095∗∗∗ 0.098∗∗∗ 0.095∗∗∗ 0.091∗∗∗ 0.095∗∗∗ 0.088∗∗∗ (0.025) (0.025) (0.025) (0.025) (0.025) (0.025) IT * BU -0.027 -0.028 -0.024 -0.024 (0.027) (0.027) (0.027) (0.027) IT * PP 0.041∗ 0.041∗ 0.038 0.037 (0.025) (0.025) (0.025) (0.025) log(Employment) 0.914∗∗∗ 0.891∗∗∗ 0.911∗∗∗ 0.889∗∗∗ 0.889∗∗∗ 0.889∗∗∗ 0.856∗∗∗ 0.839∗∗∗ 0.856∗∗∗ (0.018) (0.018) (0.018) (0.018) (0.018) (0.018) (0.019) (0.020) (0.019) log(Capital Stock) 0.125∗∗∗ 0.119∗∗∗ 0.114∗∗∗ 0.111∗∗∗ 0.110∗∗∗ 0.110∗∗∗ 0.105∗∗∗ 0.108∗∗∗ 0.106∗∗∗ (0.012) (0.012) (0.011) (0.011) (0.011) (0.011) (0.011) (0.011) (0.011) % Emp. Working with PC 0.621∗∗∗ 0.592∗∗∗ 0.593∗∗∗ 0.555∗∗∗ 0.541∗∗∗ 0.541∗∗∗
(0.057) (0.057) (0.057) (0.063) (0.062) (0.062) % High-Skilled Emp. 0.132 0.105 0.368∗∗∗ 0.104 (0.083) (0.084) (0.079) (0.084) Exporting 0.125∗∗∗ 0.140∗∗∗ 0.125∗∗∗ (0.028) (0.028) (0.028) Works Council 0.121∗∗∗ 0.118∗∗∗ 0.122∗∗∗ (0.035) (0.035) (0.035) Change in Management 0.038 0.051 0.040 (0.031) (0.031) (0.031) Constant 9.069∗∗∗ 9.270∗∗∗ 9.092∗∗∗ 9.138∗∗∗ 9.141∗∗∗ 9.147∗∗∗ 9.236∗∗∗ 9.388∗∗∗ 9.234∗∗∗ (0.148) (0.150) (0.146) (0.145) (0.145) (0.145) (0.145) (0.148) (0.145) Control Variables yes yes yes yes yes yes yes yes yes Number of Observations 4493 4493 4493 4493 4493 4493 4493 4493 4493 Number of Firms 3292 3292 3292 3292 3292 3292 3292 3292 3292 R2 0.7256 0.7293 0.7412 0.7445 0.7446 0.7448 0.7471 0.7395 0.7470
Significance levels: ∗: 10% ∗∗: 5% ∗ ∗ ∗: 1%. Control variables include industry dummy variables based on two-digit classification interacted with a full set of year fixed effects, a dummy variable for location equal to one if the firm is in one new German Bundesland (member state), i.e. formerly East Germany, and a dummy variable if the firm belongs to a multi-plant group. Robust standard errors clustered at the firm level in parentheses.
In column (4), the work organization measures for the existence of a self-responsible business unit and the use of performance pay are added to the empirical specification. They both have a significantly positive coefficient with a large magnitude. Having a self-responsible business unit is associated with approximately 15.3 percent higher productivity (coefficient: 0.153) and
using performance pay with roughly 9.5 percent higher productivity (coefficient: 0.095).17 These coefficients, although not completely equivalent, are similar to prior coefficient estimates on de-centralization or performance pay (e.g. Tambe et al. (2012) or Aral et al. (2012), respectively). These results underline the view that decentralization and high-performance work practices mat-ter for productivity.18 The inclusion of the work organization variables decreases the estimates of the software and computer work intensity measures slightly but leaves them significant. This reduction in the magnitude of the IT coefficients, when work organization is taken into account in the productivity analysis, is consistent with the results from the correlation analysis that more IT-intensive firms tend to have a decentralized work organization structure, too. Thus, when omitting work organization in the regression specification, IT captures part of its productivity contribution.
In column (5), I include pairwise interactions between enterprise software use and self-responsible business unit, and enterprise software and performance pay in order to test for complementarity. The inclusion of the interaction terms turns the coefficient on enterprise software insignificant, whereas both coefficients for decentralized work organization remain positively significant. This suggests that the return to enterprise software depends on work organization. A higher com-puter work intensity remains positively related to productivity. The coefficient of the interaction between IT and self-responsible business unit is, surprisingly, negative, even though not signifi-cant. In contrast, the interaction term between IT and performance pay is positive and weakly significant as column (5) shows.
Controlling also for the share of high-skilled employees to account for skilled human capital (column (6)) does not change the previous results. Specification (7) takes account of additional factors of firm heterogeneity which might drive the results by incorporating exporting activity, the existence of a works council and whether a change in management took place in the survey period . The consideration of these additional control variables lowers the individual coefficients
on work organization only slightly but leaves them highly significant. This result provides
confidence that the work organization variables do not pick up effects of alternative factors that are also positively related to productivity. However, the combination of performance pay and enterprise software use turns insignificant. The coefficient estimates on exporting and on works council are significantly positive, which is in line with prior findings for a positive relationship between productivity and export activities or a works council.
In specification (8), the share of computer employees is omitted to see how the coefficients evolve, given that this measure reflects IT intensity and also partly labour heterogeneity. The coefficients on enterprise software intensity and the share of high-skilled employees increase in size and both become significant. This illustrates that computer work intensity captures a large part of a firm’s IT intensity and also skill intensity as found already in the correlation analysis. Specification (9) 17The coefficients for these two work organization measures are similar in separate regressions where only
one measure is considered; results are not reported, available upon request.
18See for an empirical analysis of productivity impacts of workplace innovation, e.g. Black and Lynch
excludes the interaction terms between IT and work organization to see what are the productivity contributions without accounting for combination effects. The coefficient estimates are similar to those in column (4) or (8). Overall, these results show that more IT-intensive firms and firms with decentralized work structure and practices are more productive. However, there is no robust evidence of complementarity between IT and decentralized work organization and only weak support for a complementary relationship between IT and performance pay.
5.3
Discussion of the Results
There are several possible explanations why the interaction term between IT and decentralized work organization is not significantly positive in contrast to prior empirical work based on samples of mainly large firms. First, it might be that for smaller firms synergies from combining IT and decentralization are not that strong in comparison to larger firms. The smaller the firm size is, firms usually face less information and can act in more flexible ways so that they need less standardized work routines and possibly benefit less from decentralization (Giuri et al. (2008)). The incremental gain from combining IT with decentralized work organization might be smaller for SMEs than for larger firms, for instance, because of a smaller market share and a smaller sales volume. An alternative explanation could be that employees in SMEs can specialize less in their tasks than employees in large firms because of the smaller workforce. Even if SMEs decentralize formally, e.g. by having self-responsible business units, employees might still have to do multi-tasking. Consequently, in light of constraints on human information processing capabilities, they might benefit less from an improved information basis enabled by IT. Generally, firms of different size might have different abilities to use IT most effectively and empirical evidence has shown that small firms derive smaller marginal products from IT investments than large firms, which is consistent with the hypothesis that large firms are better equipped to benefit from IT-related complementary investments (Tambe and Hitt (2012)).
Another possibility for an insignificant interaction term might be that the indicators used in the empirical analysis to measure IT intensity and decentralization suffer from measurement error and capture only specific channels of the economic effects of IT and decentralization.19 Particularly, the variables for decentralized work organization are only binary variables. There-fore, they do not capture any intensive margin of decentralization as broader decentralization indicators that are used in prior work with other data sets do. If measurement error is present, the estimates are downward biased. Although this possibility cannot be completely ruled out, the positive and significant output elasticity coefficient estimates for IT and decentralized work organization in isolation, even when controlling for other relevant sources of firm heterogeneity, provide credibility that the measures capture at least to some extent firms’ IT and decentrali-zation intensity.
A third possibility why IT combined with decentralization is not significantly related to pro-ductivity might be that the benefits of this combination depend on other firm characteristics. These factors are possibly intangibles, given that prior research has demonstrated the role of the corporate learning type (Mahr and Kretschmer (2010)) or external focus (Tambe et al. (2012)) for the productivity effects of IT and decentralization, and of human resource analytics for the effects of IT and performance pay (Aral et al. (2012)). Finally, Tambe et al. (2012) find an insignificant interaction term between IT and decentralization, while their coefficients on IT and decentralization are individually significant. They argue that it might be that most IT-intensive firms have adopted decentralized work practices in recent years so that there are minimal marginal effects on productivity from this combination. This argument might be valid for SMEs, too, given that the time period of the data starting in 2004 is fairly recent and can be seen as rather late for IT equipment adoption, such as enterprise software. However, given that only 28 percent of the SMEs in the sample have an own business unit in contrast to 70 percent in the large firms sample, this argument might be less valid for the sample of SMEs I use for the empirical analysis. Contrarily, one reason for not finding a synergy effect from IT combined with decentralization could be that the SMEs might not have realized gains from the combination yet because a successful implementation of process innovations may take time. Given the nature of the data and the econometric techniques I can apply, there are some limi-tations to the interpretation of the results. I can control for a large part of alternative firm heterogeneity that is likely to be relevant for higher levels of IT and decentralized work organi-zation as well as higher productivity levels. This allows me to rule out alternative explanations for the positive association between IT, decentralization and productivity and to reduce en-dogeneity concerns due to omitted variable bias. One potential source of remaining relevant firm heterogeneity are unobserved individual firm fixed effects that capture quasi-fixed orga-nizational factors such as management ability. However, part of the individual time-invariant firm heterogeneity is captured already by taking explicitly account of workplace organization. Under the additional assumption that the considered work organization practices are positively correlated with management ability, the measures for work organization can be seen as a proxy for management ability so that the bias from omitted management ability will be alleviated. A direct method in a panel data analysis to check the impact of omitted variable bias on the coefficient estimates of the explanatory variables due to firm fixed effects would be to control for them using fixed effects estimation. The fixed effects estimator is valid under the assumption that the unobserved heterogeneity is correlated with the explanatory variables. This assumption is likely to be the case in my analysis, in particular for IT and decentralization as my main variables of interest. A property of the fixed effects estimator is that it does not provide estimates for fully time-invariant variables and only very imprecise estimates for rather stable variables (Cameron and Trivedi (2009)). Since the IT and organizational variables are close to time-invariant within the sample period for an individual firm with multiple participation and the majority of firms in my sample is only surveyed once, the fixed effects estimator does not seem to be an appropriate estimator for the available data. In general, fixed effects estimated IT coefficients have turned out
to be lower than estimates from pooled OLS, which do not consider individual time-invariant firm heterogeneity. One reason for this is that the fixed effects estimator eliminates any IT benefits that are persistent over time at the firm level (Cardona et al. (2013)).
Another source for biased coefficient results might be endogeneity due to simultaneity. If firms with a positive productivity shock adjust their IT levels correspondingly or if more productive firms are more likely to adopt IT and decentralized work organization, the coefficient on IT and work organization will be upward biased. This is particularly likely for the enterprise software coefficient in light of results by Aral et al. (2006) who find that firms with successful ERP adoption keep on adopting SCM and/or CRM. Generally, without explicit knowledge about firm performance at the time of IT adoption or implementation of decentralized work practices or without a meaningful variable that provides exogenous variation for differences in IT intensity and decentralization that could be used for an instrumental variable analysis, making causal interpretations about the impact of IT or work organization on productivity is problematic. Since the data set including all considered variables is not rich enough to apply panel data techniques that allow to control for simultaneity such as the Arellano and Bond System-GMM or the Olley and Pakes estimator, the results should not be interpreted as causal but they reflect empirical relationships. Prior research that could apply such techniques shows that the impact of reverse causality on IT coefficient estimates is rather limited (Tambe and Hitt (2012)).
5.4
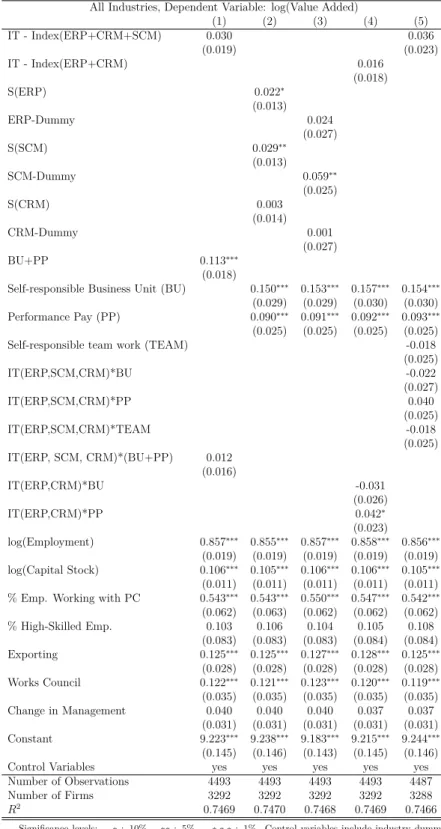
Robustness Checks for SMEs
To gauge the sensitivity of the results to the construction of the enterprise software use indi-cator and the work organization variables, I conduct the productivity analysis as of Table 7 with differently constructed indicators and the individual software variables. Table 8 shows the results for the specification with all control variables as in specification (7), Table 7. Col-umn (1) presents the results when the dummy variables for self-responsible business unit and performance pay are added in a count indicator for decentralized work organization and a cor-responding interaction term between IT and this work organization indicator is included. The coefficient on this work organization indicator is positively significant, whereas the interaction term with IT is not statistically significant. In column (2) and (3), I include once the individu-ally standardized software values and once the dummy variables for ERP, SCM and CRM that are incorporated in the enterprise software indicator. In isolation, ERP with weak significance and SCM raise productivity. This finding is similar to the productivity contributions of these three systems for Korean firms where only SCM raises productivity significantly (Shin (2006)). I also conducted the regressions with the individual software standardized and the binary values including interaction terms between them and the two work organization variables (results are not reported; available upon request). Among the interaction terms only the combination of CRM with performance pay is weakly significant.