Seismic Failure Probability and
Vulnerability Assessment of
Steel-Concrete Composite Structures
Masoud Ahmadi
1*, Hosein Naderpour
1, Ali Kheyroddin
1,
Amir H. Gandomi
2Received 27 January 2017; Revised 02 April 2017; Accepted 18 April 2017
1 Faculty of Civil Engineering,
Semnan University, Semnan, Iran
2 BEACON Center for the Study of Evolution in Action,
1450 BPS, Michigan State University, East Lansing, MI 48824, USA
*Corresponding author email: [email protected] 61 (4), pp. 939–950, 2017
https://doi.org/10.3311/PPci.10548
Creative Commons Attribution b
research article
PP
Periodica Polytechnica
Civil Engineering
Abstract
Building collapse in earthquakes caused huge losses, both in human and economic terms. To assess the risk posed by using the composite members, this paper investigates seismic fail-ure probability and vulnerability assessment of steel-concrete composite structures constituted by rectangular concrete
filled steel tube (RCFT) columns and steel beams. To enable numerical simulation of RCFT-structure, the details of compo -nents modeling are developed using OpenSEES finite element analysis package and the validation of proposed procedure is investigated through comparisons with available experimen-tal results. The seismic fragility and vulnerability curves of
RCFT-structures are created through nonlinear dynamic anal -ysis using an appropriate suite of ground motions for seismic loss assessment. These curves developed for three-, six- and
nine-story prototypes of RCFT-structure. Fragility curves are
an appropriate tool for representing the seismic failure prob-abilities and vulnerability curves demonstrate a probability of exceeding loss to a measure of ground motion intensity.
Keywords
steel-concrete structures, failure probability, performance-based seismic design, fragility curve, seismic vulnerability
1 Introduction
Steel-concrete composite structural system is progressively becoming popular in construction of buildings because of their
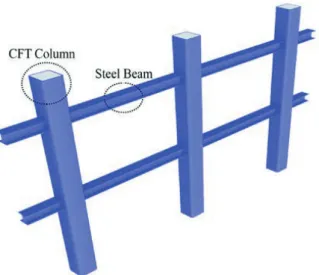
excellent performance [1, 2]. Concrete-filled steel tube (CFT) columns in combination with steel beams (Fig. 1) is one of the
most successful lateral load resisting systems in the
construc-tion industry [3, 4]. A CFT column, when designed appropri -ately, has superior strength and ductility in comparison with
hollow steel tube. The CFT column is also more economical
than conventional reinforced concrete column because of opti-mal location of steel at the periphery of the cross section, rapid construction, and role of steel tube as stay-in-place formwork.
In CFT columns, concrete delays local buckling of the steel
tube and heightens global buckling resistance of the member.
Furthermore, peripheral steel tube adds lateral confinement
to the concrete, which induces an increase in compressive strength and ductility of concrete.
In recent decades, considerable investigations have been carried out to characterize the seismic behavior evaluation of
concrete filled steel tube system. These studies were focused on components (column and connection) and CFT-frame
structures. A wide range of prior researches was conducted on
components of CFT-systems. So far, research on CFT-moment resisting frame (MRF) structures, which consist of CFT col -umns and steel beams, has been limited [5–9]. In recent years, notable studies have been dedicated to the attempt to perceive the seismic performance of composite buildings [10–12].
Sakino et al. [13] investigated the centrally loaded behavior and proposed methods to determine the axial capacity of the
CFT columns. Varma et al. [14] performed a series of experi
-mental tests on CFT beam-columns under cyclic loading. They compared their results with provisions of ACI (1999) and AIJ (1987) codes. Tort and Hajjar [15] proposed a finite element method to characterize the behavior of rectangular CFT mem
Fig. 1 Schematic illustration of the CFT-frame structure.
Perea et al. [16, 17] and Lai et al. [18] reported experimen -tal and analytical data on the axial and interaction behavior of
slender concrete-filled tubes. Skalomenos et al. [19] presented
three hysteretic models to investigate the nonlinear response
of square CFT column. Ahmadi et al. [20, 21] and Kheyrod
-din et al. [22] focused on the axial strength of CFT stub col
-umns. They suggested an empirical equation and artificial neu
-ral network method for determining the axial capacity of CFT
member using a large number of experimental specimens. Lai
and Varma [23] focused on effective stress-strain relationships of CFT columns. Xiang et al. [24] investigated the effect of
the replacement ratio on the axial behavior of square recycled
aggregate CFT column. Ricles et al. [25] and Wang et al. [26]
conducted experimental tests on exterior beam to column con-nections to investigate the inelastic performance of concon-nections
in MRF systems. Ataei et al. [27] described the experimental
results of full-scale connection of a beam to a composite
col-umn. They investigated the failure modes and rotation response
of the suggested detail, and developed equations to determine
the flexural capacity, initial stiffness, and rotational capacity. A joint element was developed by Kang et al. [28] based on the
force-transfer and damage mechanisms.
Kawaguchi et al. [5] carried out an experimental study on one-bay portal frames under constant axial load and cyclic
lat-eral loading. The results show that all frames have appropriate
hysteresis performance. Herrera et al. [6] carried out
pseudo-dynamic test on a four-story composite MRF which consist of steel-concrete columns and steel beams. Results denoted that CFT-Fame has desirable structural performance under various seismic loading levels. Tort and Hajjar [7], and Denavit and Hajjar [8, 9], developed three-dimensional distributed plastic
-ity finite element formulations for modeling inelastic behavior of composite frame under seismic loading. The exactness of
the proposed formulations was checked with a wide range of
experimental tests. The seismic analysis and damage quanti
-fication of planar CFT-frame constitute by I steel beams, and
CFT columns were investigated by Skalomenos et al. [10] and Kamaris et al. [11]. Denavit et al. [12] reported a comprehen -sive parametric study to evaluate the stability of steel-concrete composite frame structure and proposed some changes to the
AISC (2010) provisions. 2 Research significance
The main goals of this paper are to assess seismic failure probability and develop vulnerability curves of RCFT-frame
structures for using in seismic loss assessment studies and
performance-based earthquake engineering (PBEE). The past
catastrophic earthquakes reveal that large earthquakes can cause extensive losses of life and economic damages. Fragil-ity curves are an appropriate tool for representing the seismic failure probability of building and are used as a needed input for various type of loss assessment software [29]. Furthermore, vulnerability curve is one of the basic instruments to evaluate structural losses before causing economic and human losses [30]. A seismic vulnerability curve illustrates uncertain loss to a measure of ground motion intensity [31]. Nowadays, there are some gaps in the knowledge of behavior and the design
provisions of steel-concrete composite structures [32, 33]. Due to insufficient studies on CFT-frames in this research area, and
in order to avoid the extensive losses after earthquake events, fragility and vulnerability curves are developed for three
pro-totypes of RCFT-frame structures.
3 Modeling of the RCFT- structure
In this section, the details of modeling procedure of
com-ponents of the RCFT-frame structure in the Open System for Earthquake Engineering Simulation (OpenSEES) software [34] are explained. These components include: 1) RCFT col
-umn, 2) steel beam, and 3) panel zone and connection.
3.1 RCFT column
The fiber-based model of CFT columns proposed by Tort and Hajjar [7] and Denavit [8], was used as the basis for the CFT column model in this study. The concrete material of the model is based on the modified model proposed by Chang and Mander [35] and Tsai [36]. The monotonic compression response is defined by the Eqs. 1–3.
σ εc c f nxc D x
( )
=( )
' D x n r r x x r r n Lnx x r r( )
= + − − + − ≠ +(
− +)
= 1 1 1 1 1 1 1 r f h t F E Ff c c c y s c y c c = − < ≥ ' ' ' ' . . . 5 2 1 9 1 7 ε ε ε ε (1) (2) (3)Where, x, r, and n are the normalized strain, post-peak fac-tor, and normalized modulus, respectively; and fcʹ, Fy, and Es
are the compressive strength of the plain concrete, the yield stress of the steel tube, and elastic modulus of tube,
respec-tively. The stress-strain backbone curve of the tube is based on a set of hardening and flow rules that act upon the incremental strain proposed by Shen et al. [37]. To take the results of local
buckling and biaxial stress into account in the tube, monotonic
compressive response of steel tube is modified (Fig. 2).
Fig. 2 Modified stress-strain relationship of steel tube considering local buckling effect.
The parameters in modified stress-strain curve are calcu -lated as follows:
Where, εlb, Fulb, and Kslb are the strain at local buckling, residual stress, and softening slope, respectively.
Fig. 3 Monotonic curve of Modified IK deterioration model.
3.2 Steel beam
Ibarra et al. [38] developed hysteretic models that combine the strength and stiffness deterioration. Cyclic deterioration allows tracing deterioration as a function of past loading
his-tory. These hysteretic models were modified by Lignos and
Krawinkler [39] from a comprehensive database of
experimen-tal studies (more than 300 specimens) of wide flange beams (Fig. 3). The key parameters in modified curve are four defor
-mation parameters (yield rotation (θy), pre-capping plastic rota
-tion for monotonic loading (θp), post-capping plastic rotation (θpc, ultimate rotation capacity (θu)), and three strength param
-eters (effective yield moment (My), capping moment strength (Mc), residual moment (Mr)). Modified Ibarra-Medina-Krawin -kler deterioration material model was applied to model the properties of steel beam.
3.3 Panel zone and connection
The model shown in Fig. 4 represents the contribution of the panel zone to nonlinear behavior of CFT-frame structure. The
model is consist of two rigid links in order to simulate the rigid extensions of the column and beam; and a rotational spring
indi-cating the relative rotation [40]. The spring should be placed
between two nodes in a way that their horizontal and verti-cal displacement degrees of freedom to be equal. A tri-linear moment-rotation constitutive model determined by the initial stiffness and peak shear strength of panel zone is used in this
study. This relationship is resulted from the combination of a bilinear curve for steel, and a tri-linear curve for concrete. The
ultimate shear strength and the initial stiffness are determined by superimposing effects of the concrete and steel ingredients.
Fig. 4 Tri-linear shear–shear deformation curve for panel zone [40]
The contribution of the steel tube’s web to the connection
shear strength is calculated as the horizontal shear force that
can be resisted by the cross section of the tube’s web. For the shear strength of the rectangular tube (Vs) and concrete (Vc), the
theoretical mechanism proposed by Krawinkler [41] and Sheet et al. [42] were utilized in this model, which is:
εlb y s y s h t F E FE = − − 3 14 1 48 . . Fulb= +1 7 31 0 08.
(
. −R F)
≤y Fy Kslb=3 22 0 08.(
. −R E)
s (4) (5) (6)Where, Asw and Acv define the cross section of the tube’s web
and concrete core, respectively; and Fy and fcʹ are the yield
stress of the tube and the compressive strength of plain
con-crete, respectively. The effective shear zone of the rectangular steel tube and concrete are calculated by 2(h–2tf)tf, and (h–2tf) (b–2tf), respectively. Where, h is width of tube, b is depth of
it, and tf is its thickness. It is assumed that the yield
deforma-tion point corresponds to the yielding of tube. Therefore, the
strength and deformation of the web of the steel tube at the yield point are given by Eqs. 8 and 9.
Where κ = 1.2 for rectangular tube. Based on a research by Muhummud [40], the inelastic stiffness defines 20% of the elastic stiffness (κy,in = 0.2 κy,el). The efficiency and accuracy of Eqs. 7 and 9 in modeling CFT-structures were investigated by Skalomenos et al. [10]. The properties assigned to the rota -tional connection elements are obtained from transforming
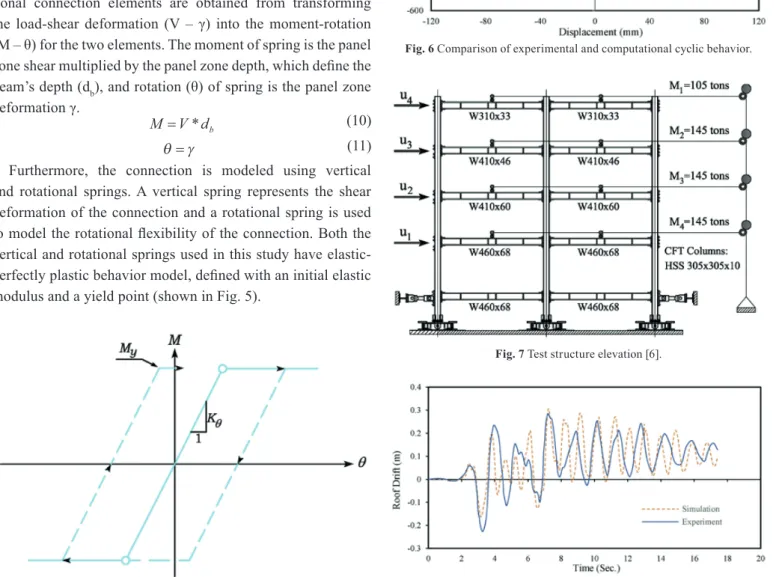
the load-shear deformation (V – γ) into the moment-rotation (M – θ) for the two elements. The moment of spring is the panel zone shear multiplied by the panel zone depth, which define the beam’s depth (db), and rotation (θ) of spring is the panel zone deformation γ.
Furthermore, the connection is modeled using vertical and rotational springs. A vertical spring represents the shear deformation of the connection and a rotational spring is used
to model the rotational flexibility of the connection. Both the
vertical and rotational springs used in this study have
elastic-perfectly plastic behavior model, defined with an initial elastic modulus and a yield point (shown in Fig. 5).
Fig. 5 Connection model spring properties (bilinear model).
4 Verification studies
To verify the precision of the modeling procedure, the cyclic performance of a CFT column and time history response of a CFT-frame will be compared to the experimental results. Varma et al. [14] investigated the response of high strength CFT members subjected to constant axial load and lateral cyclic loading. From Varma’s experiments, specimen CBC-48-80-10 is chosen for the verification study. This tested column is 0.75 scale model of a base column of a six-story perimeter MRF. Fig. 6 shows the comparison of the hysteretic response between experimental and numerical result. The results is suc -cessfully demonstrated that the proposed modeling procedure can accurately model the hysteretic performance of steel-con-crete composite column.
Fig. 6 Comparison of experimental and computational cyclic behavior.
Fig. 7 Test structure elevation [6].
Fig. 8 Comparison of analytical and experimental displacement results of
roof floor subjected to the design basis earthquake.
V V V V A F V A f u s c s sw y c cv c = + = =
(
)
⇒ 0 5774 1 99 0 5 . * ( ) . * ' . Vy=0 6. Vu γy κ s sw w V A G = M V d= * b θ γ= (7) (8) (9) (10) (11)Furthermore, the experimental study conducted by Herrera et al. [6] is chosen to evaluate the accuracy of numerical
mod-eling in nonlinear response of CFT-frame subjected to seismic
loading condition.
The tested structure is a 0.6 scale model of two bays of one of the perimeter CFT MRFs of the prototype building (Fig. 7). The frame tested under three earthquake levels: 1) the fre
-quently occurring earthquake, 2) the design basis earthquake, and 3) maximum considered earthquake. P-Δ effects due to the
lateral displacement of the interior frames are considered by
using a lean-on column. The leaning column is pinned at the base, and the lateral movement of it is restricted to each floor by a rigid strut. The lean-on column has cross-section proper -ties corresponding to the sum of the proper-ties of one-half of the gravity columns and one-half of the out of plane properties
of the columns of the MRFs which are perpendicular to the direction of loading. The seismic mass is lumped at the node on the leaning column at each floor. Fig. 8 shows the analyti
-cal and experimental displacements of roof floor under design basis earthquake. The results denoted that the developed finite element model predicts the seismic response of CFT-MRF
structure reasonably well.
5 Building models
To meet the research objectives, three prototype buildings
are designed according to the requirements of modern codes
[43–45]. They are considered to represent low-rise (three-story), mid-rise (six-(three-story), and high-rise (nine-story) buildings. The floor plan of the prototype buildings (Fig. 9), is 30mx30m area, with five bays of 6m long in each direction. Typical floor to floor height is 4.0m in all buildings. The primary lateral load resisting system consists of RCFT-frame placed on the perim
-eter of the building. To avoid biaxial bending on the corner columns, only four bays are considered as RCFT-MRFs. The buildings are supposed to be on site in Los Angeles. To inves
-tigate the nonlinear behavior of RCFT-structure, Frame-A is selected. The beam to column connections are assumed to be fully rigid in all prototype buildings. These models are imple -mented in OpenSEES.
Fig. 9 Prototype floor plan.
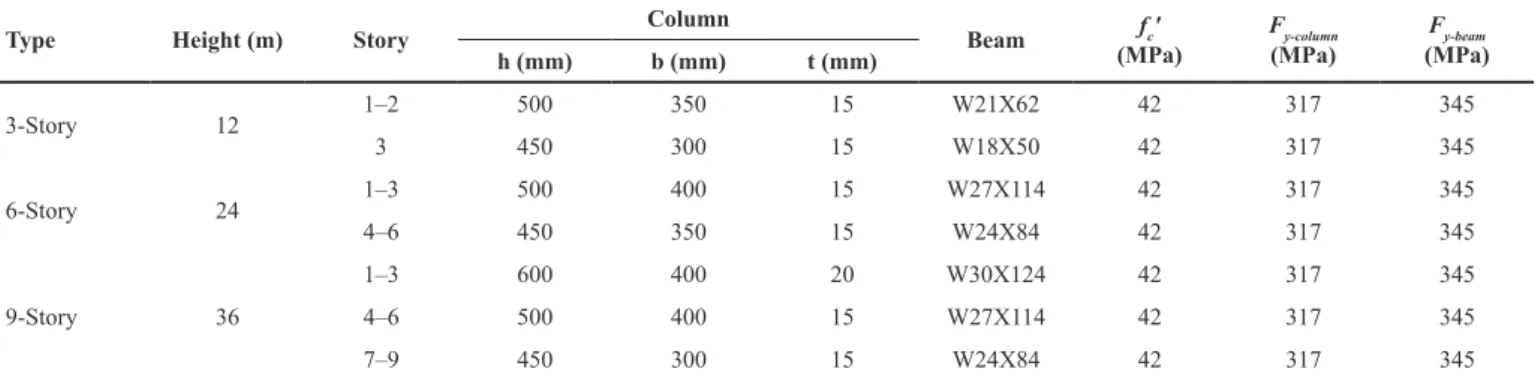
Table 1 Characteristics of three types of CFT-MRF structures.
Type Height (m) Story Column Beam fcʹ
(MPa) F(MPa)y-column (MPa)Fy-beam
h (mm) b (mm) t (mm) 3-Story 12 1–2 500 350 15 W21X62 42 317 345 3 450 300 15 W18X50 42 317 345 6-Story 24 1–3 500 400 15 W27X114 42 317 345 4–6 450 350 15 W24X84 42 317 345 9-Story 36 1–3 600 400 20 W30X124 42 317 345 4–6 500 400 15 W27X114 42 317 345 7–9 450 300 15 W24X84 42 317 345
Steel yield strengths are chosen as Fy = 345MPa for steel
beam (ASTM A992) and Fy = 317MPa for rectangular HSS
shapes (ASTM A500 Gr. B). Data of frames, including build -ing height, column dimensions, and beam type are summarized
in Table 1. Gravity loads on the beams of the frames are equal
to 1.05 of the dead load plus 0.25 of the live loads of the roof
and floors (according to FEMA 2009 [46]). This gravity load -ing is constant in time history analysis.
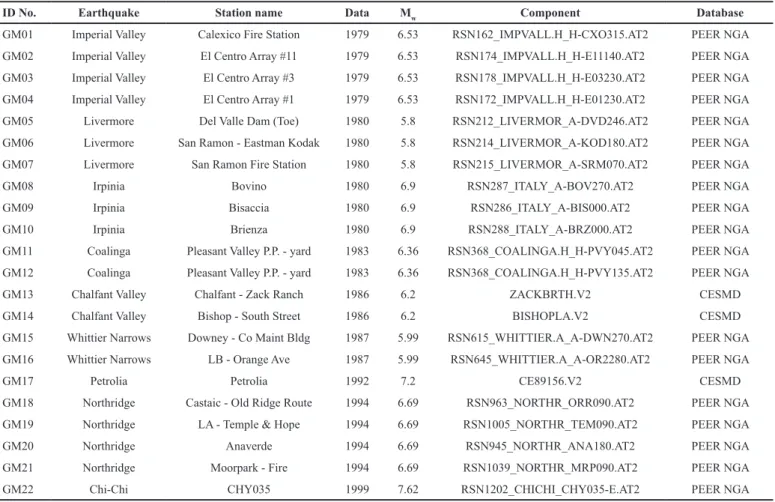
6 Selected ground motion records
To carry out nonlinear time history analyses, a suite of 22
ground motions are selected from comprehensive motion
databases including the Pacific Earthquake Engineering Next Generation Attenuation [47] Database and the Center for Engi
-neering Strong Motion Data (CESMD) [48]. The site to source
distances of selected records are greater than 10km so that they
categorized as far-field seismic excitation [46], and the suffi -cient data about soil conditions of each seismic excitation is
available. The moment magnitudes of the records (Mm) range from 5.80 to 7.62. Table 2 shows relevant information about the
selected records.
7 Incremental dynamic analysis
Seismic assessment of buildings can be assessed using
Incre-mental Dynamic Analysis (IDA). IDA is a structural analysis
method that offers thorough seismic demand and limit-state
capacity prediction capability using a series of nonlinear time
history analyses (NTHA) under a suite of multiple scaled ground motion records [49]. The procedure of scaling and NTHA is continued to lead the building to inelastic behavior
and global dynamic instability. In this study, seismic excitation
intensity is measured using the spectral acceleration at the first mode period (Sa(T1)) of the building. Interstory drift ratio, , as a
demand parameter, has been proved to be an effective indicator in representing engineering demand [50, 51]. Fig. 10 shows the
IDA results for three-, six- and nine-story prototypes under 22 ground motions. The IDA curve depicts the maximum interstory drift ratio (θmax) when the building is under the enhancing level of seismic excitation intensity. These figures contain necessary
information to assess performance levels which are important
components of PBEE. There are several classifications of build
-ing damage states defined in various assessment codes. The
damage state levels could be obtained base on recommendation
in HAZUS [52] ATC-13 [53], and ASCE-41 [45]. Considering
the explanation of the limit states, damage states are considered as none, slight, moderate, extensive, or complete.
8 Seismic fragility and vulnerability analysis 8.1 Procedure of fragility and vulnerability function
Seismic fragility (SF) curve is an outcome of probabilistic analysis accomplished on the results obtained from the IDA
curves. Fragility function represents the conditional probability
Table 2 Selected record from PEER and CESMD
ID No. Earthquake Station name Data Mw Component Database
GM01 Imperial Valley Calexico Fire Station 1979 6.53 RSN162_IMPVALL.H_H-CXO315.AT2 PEER NGA
GM02 Imperial Valley El Centro Array #11 1979 6.53 RSN174_IMPVALL.H_H-E11140.AT2 PEER NGA
GM03 Imperial Valley El Centro Array #3 1979 6.53 RSN178_IMPVALL.H_H-E03230.AT2 PEER NGA
GM04 Imperial Valley El Centro Array #1 1979 6.53 RSN172_IMPVALL.H_H-E01230.AT2 PEER NGA
GM05 Livermore Del Valle Dam (Toe) 1980 5.8 RSN212_LIVERMOR_A-DVD246.AT2 PEER NGA
GM06 Livermore San Ramon - Eastman Kodak 1980 5.8 RSN214_LIVERMOR_A-KOD180.AT2 PEER NGA
GM07 Livermore San Ramon Fire Station 1980 5.8 RSN215_LIVERMOR_A-SRM070.AT2 PEER NGA
GM08 Irpinia Bovino 1980 6.9 RSN287_ITALY_A-BOV270.AT2 PEER NGA
GM09 Irpinia Bisaccia 1980 6.9 RSN286_ITALY_A-BIS000.AT2 PEER NGA
GM10 Irpinia Brienza 1980 6.9 RSN288_ITALY_A-BRZ000.AT2 PEER NGA
GM11 Coalinga Pleasant Valley P.P. - yard 1983 6.36 RSN368_COALINGA.H_H-PVY045.AT2 PEER NGA
GM12 Coalinga Pleasant Valley P.P. - yard 1983 6.36 RSN368_COALINGA.H_H-PVY135.AT2 PEER NGA
GM13 Chalfant Valley Chalfant - Zack Ranch 1986 6.2 ZACKBRTH.V2 CESMD
GM14 Chalfant Valley Bishop - South Street 1986 6.2 BISHOPLA.V2 CESMD
GM15 Whittier Narrows Downey - Co Maint Bldg 1987 5.99 RSN615_WHITTIER.A_A-DWN270.AT2 PEER NGA
GM16 Whittier Narrows LB - Orange Ave 1987 5.99 RSN645_WHITTIER.A_A-OR2280.AT2 PEER NGA
GM17 Petrolia Petrolia 1992 7.2 CE89156.V2 CESMD
GM18 Northridge Castaic - Old Ridge Route 1994 6.69 RSN963_NORTHR_ORR090.AT2 PEER NGA
GM19 Northridge LA - Temple & Hope 1994 6.69 RSN1005_NORTHR_TEM090.AT2 PEER NGA
GM20 Northridge Anaverde 1994 6.69 RSN945_NORTHR_ANA180.AT2 PEER NGA
GM21 Northridge Moorpark - Fire 1994 6.69 RSN1039_NORTHR_MRP090.AT2 PEER NGA
when the capacity of structures is less than the seismic demand. SF curve can be stated as a lognormal cumulative distribution function as follows:
Where, Φ[.] is the Gaussian distribution function of a stand
-ard normal variable; IM defines ground intensity measure; Ĉ and D̂ are the median value of structural capacity and the median value of structural demand, respectively; and βD|IM is the parameter representing the aleatoric uncertainty of struc-tural demand. In this study, spectral acceleration at the
funda-mental period (Sa(T1)) and maximum interstory drift ratio (θmax) are selected as IM and D, respectively.
The relationship between the IM and demand can be stated
in the power form using Eq. 13.
Where, a and b are regression coefficients that can be calcu
-lated by a linear regression analysis of ln(D) versus ln(IM) got
from the results. For three-, six- and nine-story structures, the relationship between the logarithmic form of structural demand and seismic intensity measure are shown in Fig. 11. In order to convert fragility curves to vulnerability function, cumulative probabilities are differentiated to obtain discrete probabilities of each level of damage [30]. In particular, the HAZUS discrete probabilities are given as,
P[ds = Complete]= P[ds ≥ Complete] P[ds = Extensive] = P[ds ≥ Extensive] – P[ds ≥ Complete] P[ds = Moderate] = P[ds ≥ Moderate] – P[ds ≥ Extensive] P[ds = Slight]= P[ds ≥ Slight] – P[ds ≥ Moderate] Vulnerability (%)=
∑
{P[ds = DS]*MDFds}Where, MDFds is the mean damage factor, which is the cen -tral value of the damage factor range, and ds is the damage state
in a given seismic intensity. The various values of MDF, which indicate specified physical building damage, are presented in Table 3.
Table 3 Damage states and damage factor ranges (HAZUS)
Damage states None Slight Moderate Extensive Complete
Damage factor range (%) 0 0–4 4–16 16–84 100 Mean damage factor (%) 0 2 10 50 100 ds=1 n SF P D C IM x D IM ≡
(
> =)
= − ( )
| ln 1 Φ β | Ĉ D̂ D a IM=( )
bFig. 10 IDA curves of three prototype buildings: (a) three-story, (b) six-story, and (c) nine-story.
(12)
(13)
Fig. 11 Variation of logarithmic form of the θmax versus Sa (T1) [g].
8.2 Fragility and vulnerability curves
In this study, fragility curves are produced for three prototypes
of CFT-MRF based on damage state levels specified in ASCE-41
[45] and HAZUS [52]. Furthermore, because of a lack of
dam-age state levels for CFT-MRF structures in HAZUS and ASCE-41, the threshold of damage levels in steel MRF are selected.
According to ASCE-41, the structural performance could be
defined as three performance states: immediate occupancy (IO),
where the building sustains very limited structural and nonstruc-tural damages, and retains its pre-excitation capacity; life safety
(LS), is defined as the performance level that building may suffer significant damage in structural and nonstructural components,
but building preserves some margin against partial or complete
collapse; and collapse prevention (CP), where major compo
-nents of building experience significant damage and building
has no safety against collapse. Above three performance states
are defined by 0.7%, 2.5%, and 5% transient drifts, respectively. These three levels of damage could be assumed as correspond -ing to minor, moderate and severe damages. Four damage state
of (1) slight, (2) moderate, (3) extensive, and (4) complete, are defined in HAZUS [52]. The damage levels proposed by HAZUS are presented in Table 4. Fig. 12 depicts the failure probability curves for three-, six- and nine-story RCFT-structures.
Table 4 Structural fragility curve parameters (HAZUS) [52]
Label Type Building code Interstory drift at threshold of damage state
Slight Moderate Extensive Complete
CFT-L Low-rise High 0.006 0.012 0.030 0.0800
CFT-M Mid-rise High 0.004 0.008 0.020 0.0533
CFT-H High-rise High 0.003 0.006 0.015 0.0400
The results denote that for a certain level of spectral accel -eration the conditional probability tends to heighten as the
height of building increases. The median (50% exceedance) of
three-, six- and nine-story buildings based on damage state
lev-els specified in ASCE-41 [45] are 0.167g, 0.164g, and 0.086g for the IO state (θ = 0.007); 0.835g, 0.676g, and 0.329g for the LS state (θ = 0.025); and 2.005g, 1.462g, and 0.685g for the CP state (θ = 0.05), respectively.
Finally, vulnerability curves are developed for using in the
seismic risk assessment of CFT-MRFs. Vulnerability curves
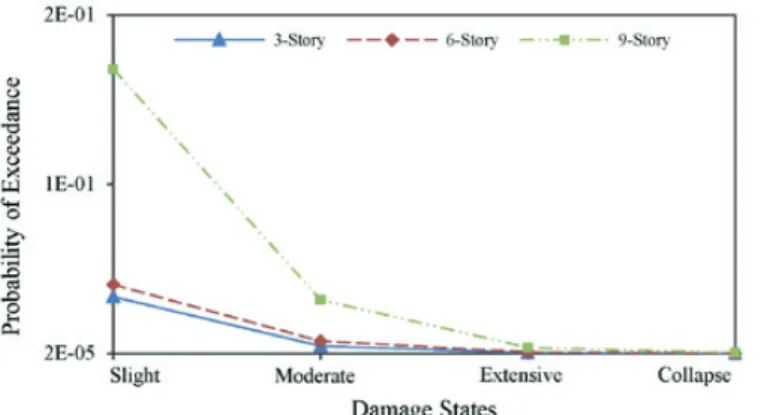
are constructed based on the approach presented in HAZUS, using Eq.14. Fig.13 shows the vulnerability curve using slight, moderate, extensive and complete levels of damage for three-,
six- and nine-story prototypes. These curves establish a direct
relationship between ground motion intensities and the
prob-ability of exceeding losses. Results denote that the three-story
building has the lowest probability of damage for a given level
of ground motion intensity. The Sa correspond to damage ratio of three-, six- and nine-story buildings based on
vulnerabil-ity curves specified in HAZUS [52] are 1.19g, 0.62g, and 0.2g for the 25% damage ratio; 2.33g, 1.05g, and 0.34g for the 50% damage ratio; and 3.54g, 1.55g, and 0.55g for the 75% dam -age ratio, respectively. Also, the outcomes of such assessments
are crucial in the mitigation of huge losses subjected to future
excitations.
9 Reliability analysis
To assess seismic risk to a structure, the annual probability
of building that the drift demand exceeds certain value of dam-age can be represented by the form,
Where, P(D ≥ C|Sa = x) is seismic fragility function, and H(x) defines mean annual frequency (MAF) that can be obtained from a seismic hazard analysis. The Eq. 16 was proposed by Cornell et al. [54] utilizes to calculate H(x).
Where, k0 and k are coefficients that can be calculated from
log-log plot of standard hazard curve.
Using Eqs. 12 and 16, Eq. 15 can be modified as,
Using spectral accelerations (5% damping) correspond to 2, 5, 10% probability of exceedance in 50 years were provided by
USGS, the Sa(T1) at 2, 5, 10% are 0.78g, 0.54g, and 0.39g for
the three-story building; 0.58g, 0.41g, and 0.29g for the six-story building; and 0.40g, 0.28g, and 0.2g for the nine-six-story building, respectively. Furthermore, for the three-story
build-ing, the constant parameters are k=2.3513 and k0=2.36E-4; for the six-story building, k=2.2546 and k0=1.42E-4; and for the nine-story building, k=2.2623 and k0=6.52E-5. The annual probability of exceeding damage states (Eq. 15) is depicted in
Fig. 14 for the three studied buildings.
Fig. 14 Annual probability of exceedance for three prototype buildings.
10 Conclusions
This study performed the seismic failure probability and
vulnerability assessment for three prototypes of steel-concrete composite structures using incremental dynamic analysis. Fragility curves are an appropriate tool for representing the seismic failure probabilities, and vulnerability curves relate
uncertain loss to a measure of seismic excitation. The details of components modeling of RCFT-frame (RCFT column, steel beam, panel zone, and connection) in OpenSEES are explained,
and the validation of proposed procedure is studied through comparisons with available experimental results. In order to
carry out NTHA, a suite of 22 recorded ground motions were
obtained from ground motion databases. Fragility curves were
generated for three-, six- and nine-story CFT-MRFs based on damage state levels specified in ASCE-41 and HAZUS. The
ground motion intensity and demand parameters were
meas-ured using the spectral acceleration at the first mode period of
the building and maximum interstory drift ratio, respectively.
The median of three-, six- and nine-story buildings based on damage levels specified in ASCE-41 are 0.167g, 0.164g, and 0.086g for the IO state; 0.835g, 0.676g, and 0.329g for the LS
state; and 2.005g, 1.462g, and 0.685g for the CP state,
respec-tively. The results demonstrate that, for a given spectral accel -eration, the conditional probability tends to heighten as the height of building enhances. In order to convert fragility curves to vulnerability function, cumulative probabilities were differ-entiated to acquire discrete probability of each damage state.
The vulnerability curves are developed and reliability analysis is performed for using in the seismic risk assessment of CFT-MRF structures. The correspond to damage ratio of three-, six-
and nine-story prototype buildings are 1.19g, 0.62g, and 0.2g
for the 25% damage ratio; 2.33g, 1.05g, and 0.34g for the 50% damage ratio; and 3.54g, 1.55g, and 0.55g for the 75% damage ratio, respectively. The reliability analysis shown that the
nine-story building is highly sensitive to seismic excitation intensity.
References
[1] Schnabl, S., Jelenić, G., Planinc, I. „Analytical buckling of slender cir
-cular concrete-filled steel tubular columns with compliant interfaces”. Journal of Constructional Steel Research, 115, pp. 252–262. 2015.
htt-ps://doi.org/10.1016/j.jcsr.2015.08.035
[2] Lee, C.-H., Kang, T. H.-K., Kim, S.-Y., Kang, K. „Strain compatibility method for the design of short rectangular concrete-filled tube columns under eccentric axial loads”. Construction and Building Materials, 121, pp. 143–153. 2016. https://doi.org/10.1016/j.conbuildmat.2016.05.145
[3] Duarte, A. P. C., Silva, B. A., Silvestre, N., de Brito, J., Júlio, E., Cas
-tro, J. M. „Tests and design of short steel tubes filled with rubberised concrete”. Engineering Structures, 112, pp. 274–286. 2016. https://doi.
org/10.1016/j.engstruct.2016.01.018
[4] Lai, M. H., Ho, J. C. M. „A theoretical axial stress-strain model for circu
-lar concrete-filled-steel-tube columns”. Engineering Structures, 125, pp. 124–143. 2016. https://doi.org/10.1016/j.engstruct.2016.06.048
[5] Kawaguchi, J., Morino, S., Sugimoto, T., Shirai, J. „Experimental study on structural characteristics of portal frames consisting if square CFT columns”. In: Composite Construction in Steel and Concrete IV. Banff, Canada. 2002. https://doi.org/10.1061/40616(281)63
[6] Herrera, R. A., Ricles, J. M., Sause, R. „Seismic Performance Evalua
-tion of a Large-Scale Composite MRF Using Pseudodynamic Testing”.
Journal of Structural Engineering, 134(2), pp. 279–288. 2008. https://
doi.org/10.1061/(ASCE)0733-9445(2008)134:2(279)
[7] Tort, C., Hajjar, J. F. „Mixed finite-element modeling of rectangular concrete-filled steel tube members and frames under static and dynamic loads”. Journal of structural engineering, 136(6), pp. 654–664. 2009.
https://doi.org/10.1061/(ASCE)ST.1943-541X.0000158
[8] Denavit, M. D., Hajjar, J. F. Characterization of behavior of steel-concrete composite members and frames with applications for design. Newmark Structural Engineering Laboratory. University of Illinois at Urbana-Champaign. 2014. H S
( )
a =P S[
a ≥sa]
=k sa−k 0 H CD( )
=P C D[
≤]
= ∫P D C S( ≥ | a =x dH x)( )
H C P C D H s k b D( )
=[
≤]
=( )
ac D IM exp 2 2 2 β 2 s C a ac b = 1 (15) (16) (17) (18)[9] Denavit, M. D., Hajjar, J. F. „Nonlinear Seismic Analysis of Circular Concrete-Filled Steel Tube Members and Frames”. Journal of Struc-tural Engineering, 138(9), pp. 1089–1098. 2012. https://doi.org/10.1061/
(ASCE)ST.1943-541X.0000544
[10] Skalomenos, K. A., Hatzigeorgiou, G. D., Beskos, D. E. „Modeling level selection for seismic analysis of concrete-filled steel tube/moment-resisting frames by using fragility curves”. Earthquake Engineering & Structural Dynamics, 44(2), pp. 199–220. 2015. https://doi.org/10.1002/eqe.2465
[11] Kamaris, G. S., Skalomenos, K. A., Hatzigeorgiou, G. D., Beskos, D. E. „Seismic damage estimation of in-plane regular steel/concrete compos
-ite moment resisting frames”. Engineering Structures, 115, pp. 67–77.
2016. https://doi.org/10.1016/j.engstruct.2016.01.053
[12] Denavit, M. D., Hajjar, J. F., Perea, T., Leon, R. T. „Stability Analysis and Design of Composite Structures”. Journal of Structural Engineer-ing, 142(3), pp. 4015157. 2016. https://doi.org/10.1061/(ASCE)ST.1943-541X.0001434
[13] Sakino, K., Nakahara, H., Morino, S., Nishiyama, I. „Behavior of Centrally Loaded Concrete-Filled Steel-Tube Short Columns”. Jour-nal of Structural Engineering, 130(2), pp. 180–188. 2004. https://doi.
org/10.1061/(ASCE)0733-9445(2004)130:2(180)
[14] Varma, A. H., Ricles, J. M., Sause, R., Lu, L.-W. „Seismic Behavior and Design of High-Strength Square Concrete-Filled Steel Tube Beam Col
-umns”. Journal of Structural Engineering, 130(2), pp. 169–179. 2004.
https://doi.org/10.1061/(ASCE)0733-9445(2004)130:2(169)
[15] Tort, C., Hajjar, J. F. „Mixed Finite Element for Three-Dimensional Nonlinear Dynamic Analysis of Rectangular Concrete-Filled Steel Tube Beam-Columns”. Journal of Engineering Mechanics, 136(11), pp. 1329–
1339. 2010. https://doi.org/10.1061/(ASCE)EM.1943-7889.0000179
[16] Perea, T., Leon, R. T., Hajjar, J. F., Denavit, M. D. „Full-Scale Tests of Slender Concrete-Filled Tubes: Axial Behavior”. Journal of Struc-tural Engineering, 139(7), pp. 1249–1262. 2013. https://doi.org/10.1061/
(ASCE)ST.1943-541X.0000784
[17] Perea, T., Leon, R. T., Hajjar, J. F., Denavit, M. D. „Full-Scale Tests of Slender Concrete-Filled Tubes: Interaction Behavior”. Journal of Struc-tural Engineering, 140(9), pp. 4014054. 2014. https://doi.org/10.1061/
(ASCE)ST.1943-541X.0000949
[18] Lai, Z., Varma, A. H., Griffis, L. G. „Analysis and Design of Noncom
-pact and Slender CFT Beam-Columns”. Journal of Structural Engineer-ing, 142(1), pp. 4015097. 2016. https://doi.org/10.1061/(ASCE)ST.1943-541X.0001349
[19] Skalomenos, K. A., Hatzigeorgiou, G. D., Beskos, D. E. „Parameter iden
-tification of three hysteretic models for the simulation of the response of CFT columns to cyclic loading”. Engineering Structures, 61, pp. 44–60. 2014. https://doi.org/10.1016/j.engstruct.2014.01.006
[20] Ahmadi, M., Naderpour, H., Kheyroddin, A. „Utilization of artifi
-cial neural networks to prediction of the capacity of CCFT short col
-umns subject to short term axial load”. Archives of Civil and Mechani-cal Engineering, 14(3), pp. 510–517. 2014. https://doi.org/10.1016/j.
acme.2014.01.006
[21] Ahmadi, M., Naderpour, H., Kheyroddin, A. „Performance of circular concrete filled steel tube members subjected to axial load”. In Fourth
International Conference on Concrete & Development. Tehran: Road , Housing and Development Research Center. 2013.
[22] Kheyroddin, A., Naderpour, H., Ahmadi, M. „Compressive strength of con
-fined concrete in CCFST columns”. Journal of Rehabilitation in Civil Engi -neering, 2(1), pp. 106–113. 2014. https://doi.org/10.22075/jrce.2014.12
[23] Lai, Z., Varma, A. H. „Effective stress-strain relationships for analy
-sis of noncompact and slender filled composite (CFT) members”. En-gineering Structures, 124, pp. 457–472. 2016. https://doi.org/10.1016/j.
engstruct.2016.06.028
[24] Xiang, X., Cai, C., Zhao, R., Peng, H. „Numerical analysis of re
-cycled aggregate concrete-filled steel tube stub columns”. Advanc-es in Structural Engineering, 19(5), pp. 717–729. 2016. https://doi.
org/10.1177/1369433215618270
[25] Ricles, J. M., Peng, S. W., Lu, L. W. „Seismic Behavior of Composite Concrete Filled Steel Tube Column-Wide Flange Beam Moment Con
-nections”. Journal of Structural Engineering, 130(2), pp. 223–232. 2004.
https://doi.org/10.1061/(ASCE)0733-9445(2004)130:2(223)
[26] Wang, J., Zhang, L., Spencer, B. F. „Seismic response of extended end plate joints to concrete-filled steel tubular columns”. Engineer-ing Structures, 49, pp. 876–892. 2013. https://doi.org/10.1016/j.eng -struct.2013.01.001
[27] Ataei, A., Bradford, M. A., Valipour, H. R. „Experimental study of flush end plate beam-to-CFST column composite joints with deconstructable bolted shear connectors”. Engineering Structures, 99, pp. 616–630. 2015.
https://doi.org/10.1016/j.engstruct.2015.05.012
[28] Kang, L., Leon, R. T., Lu, X. „A general analytical model for steel beam-to-CFT column connections in OpenSEES”. Journal of
Construc-tional Steel Research, 100, pp. 82–96. 2014. https://doi.org/10.1016/j. jcsr.2014.04.022
[29] Frankie, T. M., Gencturk, B., Elnashai, A. S. „Simulation-Based Fragili
-ty Relationships for Unreinforced Masonry Buildings”. Journal of Struc-tural Engineering, 139(3), pp. 400–410. 2013. https://doi.org/10.1061/
(ASCE)ST.1943-541X.0000648
[30] Sadeghi, M., Ghafory-Ashtiany, M., Pakdel-Lahiji, N. „Develop
-ing seismic vulnerability curves for typical Iranian build-ings”. Pro-ceedings of the Institution of Mechanical Engineers, Part O:
Jour-nal of Risk and Reliability, 229(6), pp. 627–640. 2015. https://doi.
org/10.1177/1748006X15596085
[31] Porter, K. Beginner’s guide to fragility, vulnerability, and risk. Univer-sity of Colorado Boulder. 2016.
[32] Ahmadi, M., Naderpour, H., Kheyroddin, A. „ANN Model for Predict
-ing the Compressive Strength of Circular Steel-Confined Concrete”.
International Journal of Civil Engineering, 15(2), pp. 213–221. 2017.
https://doi.org/10.1007/s40999-016-0096-0
[33] Ahmadi, M. Developing empirical approaches for determining the
axial compressive capacity and compressive strength of confined con
-crete in circular con-crete-filled steel tube columns (in Persian). Semnan University. 2012.
[34] McKenna, F., Fenves, G. L., Scott, M. H. „Open system for earthquake engineering simulation”. University of California, Berkeley, CA. 2000.
URL: http://opensees.berkeley.edu
[35] Chang, G. A., Mander, J. B. Seismic energy based fatigue damage analy-sis of bridge columns: Part I-Evaluation of seismic capacity. National
Center for Earthquake Engineering Research Buffalo, NY. 1994. [36] Tsai, W. T. „Uniaxial Compressional Stress-Strain Relation of Con
-crete”. Journal of Structural Engineering, 114(9), pp. 2133–2136. 1988.
https://doi.org/10.1061/(ASCE)0733-9445(1988)114:9(2133)
[37] Shen, C., P. Mamaghani, I. H., Mizuno, E., Usami, T. „Cyclic Behav
-ior of Structural Steels. II: Theory”. Journal of Engineering Mechan-ics, 121(11), pp. 1165–1172. 1995. https://doi.org/10.1061/(ASCE)0733-9399(1995)121:11(1165)
[38] Ibarra, L. F., Medina, R. A., Krawinkler, H. „Hysteretic models that incorporate strength and stiffness deterioration”. Earthquake Engineer-ing & Structural Dynamics, 34(12), pp. 1489–1511. 2005. https://doi. org/10.1002/eqe.495
[39] Lignos, D. G., Krawinkler, H. „Deterioration Modeling of Steel Compo -nents in Support of Collapse Prediction of Steel Moment Frames under
Earthquake Loading”. Journal of Structural Engineering, 137(11), pp.
[40] Muhummud, T. Seismic behavior and design of composite SMRFs with concrete filled steel tubular columns and steel wide flange beams. Lehigh University, Bethlehem, Pennsylvania. 2003.
[41] Krawinkler, H. „Shear in beam-column joints in seismic design of steel frames”. Engineering Journal, 15(3), pp. 82–91. 1978.
[42] Sheet, I. S., Gunasekaran, U., MacRae, G. A. „Experimental investiga
-tion of CFT column to steel beam connec-tions under cyclic loading”. Journal of Constructional Steel Research, 86, pp. 167–182. 2013. https://
doi.org/10.1016/j.jcsr.2013.03.021
[43] American Society of Civil Engineers. Minimum design loads for build-ings and other structures: second Printing (ASCE/SEI 7). 2010. [44] American Institute of Steel Construction. Specification for structural
steel buildings (ANSI/AISC 360). 2010.
[45] American Society of Civil Engineers. Seismic rehabilitation of existing buildings (ASCE/SEI 41). 2006.
[46] Federal Emergency Management Agency. Quantification of building seismic performance factors (FEMA P695). Applied Technology Coun -cil. 2009.
[47] Pacific Earthquake Engineering Research (PEER) Center. „PEER ground motion database”. 2015.
[48] US Geological Survey. „Center for engineering strong motion data (CESMD)”. 2015.
[49] Vamvatsikos, D., Cornell, C. A. „Incremental dynamic analysis”. Earth-quake Engineering & Structural Dynamics, 31(3), pp. 491–514. 2002. DOI: https://doi.org/10.1002/eqe.141
[50] Rajeev, P., Tesfamariam, S. „Seismic fragilities for reinforced concrete buildings with consideration of irregularities”. Structural Safety, 39, pp. 1–13. 2012. https://doi.org/10.1016/j.strusafe.2012.06.001
[51] Jeon, J.-S., Lowes, L. N., DesRoches, R., Brilakis, I. „Fragility curves for
non-ductile reinforced concrete frames that exhibit different component
response mechanisms”. Engineering Structures, 85, pp. 127–143. 2015.
https://doi.org/10.1016/j.engstruct.2014.12.009
[52] Federal Emergency Management Agency. Multi-hazard loss estimation
methodology, earthquake model, HAZUS-MH MR4 technical manual. 2003.
[53] Federal Emergency Management Agency. Earthquake damage evalua-tion data for California (ATC 13). Applied Technology Council. 1985. [54] Cornell, C. A., Jalayer, F., Hamburger, R. O., Foutch, D. A. „Proba
-bilistic Basis for 2000 SAC Federal Emergency Management Agency
Steel Moment Frame Guidelines”. Journal of Structural Engineer-ing, 128(4), pp. 526–533. 2002. https://doi.org/10.1061/(ASCE)0733-9445(2002)128:4(526)
![Fig. 4 Tri-linear shear–shear deformation curve for panel zone [40]](https://thumb-us.123doks.com/thumbv2/123dok_us/1274545.2671379/3.892.62.425.759.1087/fig-tri-linear-shear-shear-deformation-curve-panel.webp)

![Fig. 11 Variation of logarithmic form of the θmax versus Sa (T1) [g].](https://thumb-us.123doks.com/thumbv2/123dok_us/1274545.2671379/8.892.134.764.67.523/fig-variation-logarithmic-form-θmax-versus-sa-t.webp)
![Table 4 Structural fragility curve parameters (HAZUS) [52]](https://thumb-us.123doks.com/thumbv2/123dok_us/1274545.2671379/9.892.57.803.609.1141/table-structural-fragility-curve-parameters-hazus.webp)