Analysis of Household Poverty and Household Vulnerability to
Poverty: The Role of Social Protection Measures in Reducing
Household Poverty and Vulnerability in Katakwi District-Uganda
Julius Okello1
Faculty of Humanity, Department of Social Development, Tel: 021 6503493, Fax: 021 6892739 Private bag X3, Rondebosch, 7701, University of Cape Town – South Africa, Student Number: OKLJUL001, South Africa Abstract
The correlation between poverty and vulnerability, and the role social protection ex-ante measures and ex-post measures can play in reducing household poverty and household vulnerability mitigation measures, is the main concern of this paper. In this study, we estimate ex-ante poverty and vulnerability among the sampled household heads from the post-conflict district of Katakwi in Teso-sub-region. Using primary data collected from February to August 2016, the preliminary results show that, household vulnerability to poverty is more prevalent in conflict affected areas and it is not the same with those households living in secure and peaceful areas. There is a high level of household susceptibility to falling back into poverty in the near future in conflict affected areas. It is suggested that, social protection ex-ante measures can be used to prevent households from becoming poor as well as ex-post measures to alleviate those already trapped in poverty and vulnerability to escape poverty and vulnerability. In designing policies one should take note of the diverse nature of poverty and vulnerability. For the chronically poor households who lack economic assets, priority should be given to reduction of consumption fluctuations and building up asset base through a combination of protective, preventive promotive and transformative programmes.
Keywords: Social protection, household poverty, household vulnerability to poverty, shocks, risks, Katakwi Introduction and Background
The interest by states, multi-bilateral, national, regional and international non-state actors in social protection policies and programmes, cannot be overestimated. The introduction or expansion of social transfers as one prominent tool by actors working in social protection signifies the importance of social protection in tackling poverty and vulnerability (Okello, 2015a:18). Poverty and vulnerability is not new to many scholars and policy decision makers, but it has often proved to be difficulty to address especially at household and community. This is because, both the concept poverty and vulnerability has not been given the due attention it deserves or there is simply mind game in play with rhetoric empty promises talk taking the centre stage. The deliberate skewed implementation of policies and programmes in other corners of the country leaves the other part of the country under developed. These breaths tension between and among regions with soon latent confrontation and demonstration taking place between the haves and have not. The incidence of poverty and household vulnerability to poverty among post-conflict communities across all districts, sub-counties, parishes and villages is high and unpleasing. There seems to be a group of households with the head of household belonging to neither of the very poor, vulnerable poor, non-poor, non-vulnerable poor and better off among groups. These are probably households where the head of the household either retired from jobs or female headed households who are not receiving remittances and they are not involved in any socio-economic activity (Okello, 2015a:18-19). Therefore, effective and deliberate implementation of balanced social protection policies and programmes will help to avert such pending latent confrontation and demonstration. Social protection measures through transfers can be a good tool of matching out vulnerable households to escape poverty and avoid future shocks and risks.
Household’s poverty and household vulnerability to poverty in Katakwi district and Teso sub-region face the risks of suffering from different types of shocks. Some shocks and risks affect communities as a whole referred to in this paper as covariate shocks such as economic and financial crises and natural disasters. Others affect one or a few households noted as idiosyncratic shocks, such as a death of a household bread winner or loss of a job. The analysis of household poverty and vulnerability proposed is crucial for determining which social protection interventions are effective and are available to household heads to have efficient measures to that helps them to respond and when to introduce them or adjust their levels and coverage. To make these decisions, policymakers within the state, multi-bilateral agencies and non-state social protection actors and implementers
1
I wish to sincerely thank and acknowledge the continued academic and moral support that I have received from my supervisors, Prof. Viviene Taylor and Dr. Kubeka K. Alvina. Your time that you always dedicate to me, preparing my mind, tuning my analytical thinking and interpretation of academic and policy thoughts is invaluable. I see my dream coming true and I see my future brighter and shining stars are waiting for me, thank you Prof. Viviene and Dr. Khosi
need to have access not only to macro-economic indicators, but also to indicators that provide an understanding of household poverty and vulnerability levels, household risk profiling data and risk mitigation and management measures particularly among households emerging from conflict and disaster trying moments. The findings on household poverty and household vulnerability to poverty in this paper can be useful for communities, districts and countries that experienced and or are yet to experience similar conditions like those we found in Katakwi district and Teso sub-region.
Categorization of Concepts
The views and experiences drawn from household heads belonging to a particular a community, tells of the anguish voices, desperation and non-stop flow and flooding of tears particularly of women and child headed households respondents. We also captured the views, experiences and perceptions of policy and decision makers in regard to effective implementation of social protection policies and programmes. Social assistance transfers provided to those living in poverty or are vulnerable to poverty and in danger of falling back into poverty (MFPED, 2012:2). The experiences discussed here are primarily drawn from the implementation of social protection ex-ante measures and ex-post measures aimed at reducing household poverty and household vulnerability to poverty. We categorise and associate household poverty and household vulnerability to poverty because social protection measures have (1) a protective function which measures are introduced to save lives and reduce levels of household deprivation and marginalization in a society. (2) Social protection further has a preventive function because it seeks to assist poor and vulnerable households from falling back into deeper poverty or becoming vulnerable to risks and contingencies arising from manmade and natural disasters, wars and conflicts, crop failure, accidents and illness. (3) The promotive function of social protection aims to enhance the capabilities of individuals, communities and institutions to participate in all spheres of social and economic activities. And (4) the transformative function focuses on reducing inequities and vulnerabilities among households and between communities through changes in policies, laws, budgetary allocations and redistributive measures.
Social protection also has a developmental and generative function that can increase consumption patterns of the poor, local economic development and enabling poor people to access economic and social opportunities. Further we sip five concepts that are directly linked to and based on the household characteristics namely; (1) Being a poor household. We define; poor households based on the household hygienic conditions if the environment is bad and if a household does not have access to toilets, girls receiving sanitary support from their caretakers as a means of staying in school including access to safe and clean drinking water; then, household ‘poor’ is referred in this paper to mean, a head of household who cannot manage to meet the basic needs of the family members (educational and medical cost, have one or no meals at all, uses one pair of cloth for more than one month, have no nearby access to water points, uses the nearby bushes as toilet, sleeps in rags with very poor housing conditions build using mud or grass as both wall and roof, among others; the ‘non-poor’ household is that head of households who can afford to meet the basic needs of the family members listed in (1); (3); the low vulnerable groups refers to a group of households living in a particular community sharing similar believes, cultures, values and norms, but with limited and difficulty conditions in accessing social protection services such as health and education facilities, walk longer distances to access transport, schools, medical services and water points; the high vulnerable groups of households in a given community refers to those households living in a particular community sharing similar believes, cultures, values and norms, but they have high levels of vulnerability and high chances of falling back into poverty traps in the near future with no or less hope of accessing social protection services because they cannot walk or travel longer distance such as (orphaned children under the age of 4-7, elderly persons, people with disability, and the blind among others; and (5) the ‘low vulnerable groups’ of households are a group of households in communities who are likely to have or not have an opportunity to access social protection services, they are always in and out of poverty and vulnerability cycles in the short, medium and long term.
Although the other texts define poverty and vulnerability to be different, we consider the two concepts of poverty and vulnerability to be closely related due to two established facts: (i) the poor are poor because they are typically the most exposed to diverse shocks and risks, and (ii) the poor have the fewest assets to deal with these risks. However, the importance of vulnerability because if policymakers design poverty alleviation policies in the current year on the basis of a poverty threshold of income or consumption in the previous year, the poor who receive social protection cash transfers support may have already escaped from poverty and the non-poor are non-poor because they do not need any form of social transfers. The can only need to receive such social protection cash transfer support if they have slipped into poverty due to various unanticipated shocks and risks in the range of wars, conflicts, natural calamities and outbreak of diseases. Hence, assessing household poverty and household vulnerability to poverty helps in designing effective social protection measures that will guide policy and decision makers to distinguish between ex-ante poverty prevention interventions and ex-post poverty alleviation strategies for prevention, mitigation and coping arrangements (Barrientos, et. al, 2009:11).
The context of the study
The concept of household poverty and household vulnerability to poverty extends the idea of poverty to include idiosyncratic as well as aggregate shocks and risks which can be defined as the probability of being in poverty or to fall deeper into poverty in future. It can be considered on the micro-and macro level where macro vulnerability refers to worldwide threats to social and economic wellbeing for instance, wars, conflicts, global fluctuations in prices of agricultural products and financial crises. Conversely, micro vulnerability refers to the household level risks including education and health risks, economic shocks, social shocks, natural disasters, and historical demographic shocks due to limited access to social protection services by the poor and vulnerable households (Taylor 2008:61). To measure household vulnerability to poverty, various approaches and steps should be under taken which includes among others; (a) vulnerability should be seen as a probability of falling back into poverty traps in the near future (Chaudhuri, 2003:10) and ; (b) measuring vulnerability, there should be considerations that look at it as low expected utility (Azam et. al, 2012:10). Further, it is evident from the various text and the empirical study findings, that household vulnerability is a directly linked to, but distinct concept from poverty on a number of counts. Foremost, vulnerability is a dynamic concept as opposed to poverty which is fundamentally full of other stock of concepts within poverty (Okello, 2016:2). We run a model to examine the determinants of household vulnerability to poverty and we examine to what extent do conceptual models for social protection - provided for example the World Bank's “Social Risk Management” framework; the International Labour Organisations on “Decent Work” programme; the Centre for Social Protection's on “Transformative” approach. Such models recognise that social transfers serve three important functions: to provide for those who are unable to provide for themselves; to prevent poverty shocks from devastating households; and to promote households by helping them to lift themselves out of poverty. Such models recognise importance of social protection transfers in serving as an important function that, if effective transfers are provided for those who are unable to provide for themselves; to prevent themselves from poverty shocks and devastating households vulnerabilities; and to promote households by helping them to move out of poverty and vulnerability (Ravallion, 1998). While interpretation and understandings of ‘poverty and vulnerability’ have moved to incorporate social dimensions of wellbeing together with rights based approaches, social protection continues to be conceptualized by many development agencies as their main alternative responses to household coping and livelihood strategies of helping households to overcome shocks and risks (Okello, 2015:37).
Model Specification on Decomposing Poverty and Vulnerability
The objectives of the present study include creating a household’s current poverty and vulnerability to poverty profiles and thereby figuring out prospective course of poverty in the study area (RoU, 2012). In doing so, households will be disaggregated first by location namely urban and rural and then by various household characteristics that distinguishes between groups, for instance access to and the size of land holding in rural areas and the educational level of the head of the household in semi-urban (trading centers) areas. Head Count Poverty index is calculated using the poverty lines suggested by the Uganda National Bureau of Statistics (RoU, 2006). The national Bureau of Statistics used two poverty lines for its poverty estimates. One is called the lower poverty line which is equal to only the food poverty line and households whose total expenditures are equal to the food poverty line are called the extreme poor. The second one is the upper poverty line which is equal to food plus non-food poverty line and the corresponding households which we term as; (1) the ‘poor’, (2) the ‘non-poor’, (3) the ‘high vulnerable group’, (4) the ‘low vulnerable group’, and (5) the ‘total vulnerable group’. These two poverty lines data sets, lower and upper are available for the entire stratum of the UBOs 2014/15 (RoU, 2006). However, in this study we have used only the upper poverty lines for the entire stratum as it includes both the food consumption expenditures and the cost of non-food items. People living below the upper poverty line are generally considered as poor. Whereas the lower poverty line only considers the food consumption expenditure and the people living below the lower poverty line is categorised as extreme poor. In this model, we adopt and use the official poverty line definition given by Uganda National Household Survey Findings of 2009/2010 (UBOS, 2010). The poverty measure that was used in this analysis is the class of decomposable poverty measures as presented by Foster, Greer and Thorbecke (FGT). This model is widely used and acceptable by social and economist researchers because of being consistent and additively decomposable. The FGT index is given by; ) ...( ... ... ... ... ... ... ... ... ... ... 1 1 i Z Yi Z N P q i
∑
= − = α αWhere; Z in our analysis is the poverty line defined as 2/3 of the mean per capita household expenditure, Yi is the poverty indicator/welfare index per capita in this case per capita expenditure in an increasing order for all households surveyed; q is the number of the poor vulnerable households in the population size (N), and α is the poverty aversion parameter that takes on the values zero, one or two (0, 1 or 2). Income poverty line is
constructed as 2/3 of mean per capita household total expenditure. When α=0, Pα measures the proportion of people in the population whose per capita expenditure on food and non-food items fall below the poverty line (poverty incidence) among the communities emerging from conflicts and disasters. When α=1, Pα measures the depth of poverty-how deep below the poverty line is the averagely poor (poverty gap)? When α=2, Pα measures how beyond the core poor are from the poverty line compared to the averagely poor (the severity of poverty) among all households in the post-conflict study areas. Any operationally useful assessment of households’ vulnerability to poverty depends essentially on two important factors: (1) the choice of household vulnerability threshold that is, a minimum level of vulnerability above which all household members are defined to be vulnerable and (2), specifying the time horizon over which households’ vulnerability to poverty is to be assessed. However, there is to a certain extent, a degree of randomness involved in making such decisions.
The most preferred and natural candidate for the vulnerability threshold is 0.5. This midway dividing point has three attractive features (Chaudhuri et al. 2002:10). Firstly, this is the point in the equation (iv) where the expected log consumption coincides with the log of the poverty line. Secondly, it makes intuitive sense to say a household is ‘vulnerable to poverty’ if it faces a 50 percent or higher probability of falling back into poverty in the near future. Thirdly, if a household is just at the poverty line and faces a mean zero shock, then this household has a one period ahead vulnerability of 0.5. This therefore implies that, in the limit, as the time horizon goes to zero, then being 'currently in poverty' and being 'currently vulnerable to poverty' coincide with the argument given by Pritchett (Pritchett, et al., 2000; Foster et al. 2010). Another threshold that we consider it makes sense is the observed headcount ratio. The underlying logic is that because the observed poverty rate represents the mean vulnerability level in the population, anyone whose vulnerability level lies above this threshold (0.5) faces a risk of poverty that is greater than the average risk in the population and hence can be legitimately included among the vulnerable (Chaudhuri, 2003:11). Chaudhuri and others give in practice the most of the empirical studies adopted the vulnerability threshold of 0.5 (Chaudhuri et al. 2002:18).
The other but not less important aspect of an operationally useful vulnerability (Pritchett., 2000:2) index is to decide on a time horizon over which household’s vulnerability to poverty is assessed. However, the existing literature again in regard to household vulnerability to poverty is of little help in this regard. In most of the cases as we find in our analysis, the concept of time horizon is defined through some arbitrary expression like 'probability’ of falling back into poverty in the near future providing indication that there is no obvious choice. Recognising that a certain degree of arbitrariness is needed, Chaudhuri proposes two possible cases which are; a time horizon of one year, which can be thought of in terms of the likelihood of poverty in the short run, and a time horizon of three years which roughly corresponds to the likelihood of poverty in the medium-term (Chaudhuri, et al., 2002). We find this very interesting in the later case because all households especially those one emerging from decades of conflicts experienced a poverty spell at least once in the next three years are categorised as vulnerable.
Determinants of Poverty
It is evident from the literature and the empirical studies that vulnerability is a closely related but a distinct concept from poverty on a number of counts. First vulnerability is a dynamic concept as opposed to poverty which is essentially a stock concept. The logistic regression model is therefore, employed to estimate the probability of a given household when faced with shocks and risk is vulnerable to poverty as a result of war, conflict, outbreak of epidemic diseases, and unfavourable weather conditions. We consider that household to be income insecure or income poor if its per capita consumption expenditure is below the constructed poverty line given her historical social, cultural and economic attributes. We implement the model below to examine the determinants of household vulnerability to poverty from conflict affected districts of north eastern Uganda;
)
...(
...
...
...
...
...
...
...
...
...
...
...
'
)
(
Y
X
u
ii
InL
i=
β
+
iThe equation (2) presented above is the log-likelihood function showing the log-likelihood that a given household experienced conflict or disaster is poor given its historical social, cultural and economic attributes (X), where: Yi =1 if household per capita expenditure (HHPCE) < poverty line (Z) and Yi = 0 otherwise; β' is a vector of parameters to be estimated; X is a vector of explanatory variables (poverty correlates) comprising of gender, sector covering both deep rural areas and or urban-semi-urban trading canters, age of household respondent, years spent in acquiring educational training, career, household size, household expenditure on food, transport, health and education. It is important to note that sector is a dummy variable that takes the value of 1 if household dwells in the urban area and 0 otherwise; and ui = error term. However, since equation (2) is a log-likelihood function it measures the log of probability ratio that a household is poor which does not make real sense and we therefore, use equation (3) below with the likelihood function to measure the probability ratios of a given household being considered to be poor as follows:
) ...( ... ... ... ... ... ... ... ... 1 0 1 ' iii e P P L Y Y L X i i i i = β − = = =
Which is the ratio of the probability that a given household is poor, Pi illustrates that, the probability of a given household is non-poor, 1-Pi may be due to state or non-state social protection intervention efforts to socially and economically empowers the household or simply, they are direct beneficiaries of social protection cash transfers programmes being implemented by the state and non-state social protection actors.
Vulnerability as Expected Poverty and its Determinants
In order to determine the effect of social protection interventions on some household attributes or behaviours especially on their consumption expenditures, the approach that had been widely used to generate vulnerability indices when a single point consumption data are available was used. Suppose that, the stochastic process for generating household per capita consumption expenditure Ci for the ith household is specified as below;
)
....(
...
...
...
...
...
...
...
...
...
...
...
...
iv
X
InC
i=
iβ
+
ε
iWhere, Ci is household per capita expenditure on food and other none food consumption expenditure for the ith household at time t+1, and Xi in this case represents a bundle of observable household consumption behaviour on income or in kind received from a transfer and other determinants of consumption, β is a vector of coefficients of household attributes to be estimated and εi is a mean-zero disturbance term that captures
idiosyncratic shocks that contribute to different household per capita consumption levels. The consumption model in equation four (4) above assumes that, the disturbance terms has mean zero, but varies across different households scattered all over communities emerging from periods of war, conflict and or disasters. Therefore the variance of the disturbance term violates the OLS assumption of constant variance (homoscedasticity) thus heteroscedastic, as it is represented in equation five (5) below;
)
...(
...
...
...
...
...
...
...
...
...
,
0
2X
a
w
v
i
=
iθ
+
+
iσ
Note: We use the following terms in our equation to explain the different assumptions in regards to homoscedasticity which exactly means the ‘same variance’, which is central to our regression models. Therefore, Homoscedasticity describes a situation in which the error term (ε) (that is, the “noise” or random disturbance in the relationship between the independent variables which is for our case is social protection interventions/programme and the dependent variable-households behaviours) is the same across all values of the independent variables. Heteroscedasticity is (the violation of homoscedasticity) or is present when the size of the error term differs across values of an independent variable. The impact of violating the assumption of homoscedasticity is a matter of the degree, increasing as heteroscedasticity increases. The non-linearity is confirmed in the relationship between log consumption per capita and the size of the household, age of household head, and size of total land holding and their squared terms as their coefficient estimates are statistically significant. The coefficient for ‘age of household head’ is positive and highly significant. Its square is then negative and statistically significant. Similarly, size of the total land holding seems to affect consumption positively as expected but its square is negative and highly significant. As expected, the size of a household has a negative influence on consumption, that is, the larger the household, the lower per capita consumption tends to be. Its square again is of opposite sign indicating the non-linearity of relationship with log of consumption per capita. Not surprisingly, the variables- housing condition, access to post-conflict recovery programme, household connection to fm radio station, possession of a bicycle and hygienic condition all have sizeable positive effect on per capita consumption and the coefficients are also highly statistically significant. As a result, to correct for heteroscedasticity and to obtain efficient estimates of β and θ we adopted the three-stage feasible generalized least squares (FGLS) method in estimating equations (4) and (5). Firstly, we estimated equation (4) using OLS to obtain estimated εi and we obtained its squared values as estimated variance σi2. Secondly, we regress the variance obtained in step one on the household historical social, cultural and economic attributes as shown in equation five (5) above using the OLS formula and we obtained the required estimated variance and used the results to correct equation five (5) above as represented below;
)
5
....(
...
...
...
...
...
...
...
...
...
...
1
2 , 0σ
σ
θ
σ
σ
σ
i i iw
a
X
+
+
=
And we rewrite it again for the purposes of inconvenience and for easy interpretation and for aiding analysis as follows to come up with equation six (6);
)
6
....(
...
...
...
...
...
...
...
...
...
...
...
...
* * * 2 * , 0i=
X
θ
+
a
+
w
iσ
The variances from equation six (6) above are homoscedastic, thus the estimated parameters thereof are now efficient we therefore obtained the estimated variance from eqn. (6) and used it to correct eqn. (4) as follows:
( )
* * * * ' 1 1 1 σ ε σ β σ δ σ i i i X InC + + = )
...(
...
...
...
...
...
...
...
...
...
...
'
* * * *vii
u
X
InC
i=
δ
+
iβ
+
ε
i+
In nutshell, we estimated equation seven (7) above using the OLS which gave us sufficient results for measuring the parameter β. We also generated the expected household (dependent variable) behaviour on household
consumption expenditure for each sampled household in the study area by considering their expectations in equation seven (7). The expected consumption expenditures thus generated are compared to the constructed poverty line estimates given by UNHS, 2010 survey results that we used to compare with our analysis. In our analysis and discussion, we clarify or categorise households whose consumption expenditure are less than the poverty line as vulnerable group because, they do not or are not direct beneficiaries of the state social protection transfers (cash or in kind) and those that are greater or equal to the poverty line are non-vulnerable because they are direct beneficiaries who receive monthly state social cash transfers or in kind transfers. We run the logistic regression model in equation (viii) below to estimate and also generate the levels of household vulnerability to poverty as expected probability of a given household to be poor;
(
InC
*InZ
)
'
X
u
...
...
...
...
...
...
...
...
...
...(
viii
)
InL
i∠
=
β
+
iA logistic regression model was estimated to generate household vulnerability to poverty as expected probability of being poor after war and conflict in the future as follows: first we estimated the log-likelihood function in equation eight (8) above. We note that poverty is less prevalent in this group while households head working and depending on agriculture shares alone is one of the majorities of the poor. Chronic poverty in households with heads working in agriculture in the study area is widespread across all the sub-counties in Katakwi and other Teso districts. The vulnerable non-poor population also constitutes a significant proportion of these households. On the other hand, non-agricultural activities for this category are seen to be more remunerative in terms of reducing household vulnerability to poverty as is the case with other districts affected by the conflicts. Nonetheless, more than 35 percent of non-agricultural households are chronically poor while almost 9 percent of the non-poor non-agricultural household are at risk of poverty and that, the probability of a household in conflict affected communities is poor is also generated as its represented in equation nine (9) below;
(
)
...
...
...
...
...
...
...
...
...
...
(
)
Pr
InC
*InZ
e
'ix
VEP
X ui i +=
∠
=
βWe further estimated the tobit censored regression model represented in equation ten (10). We did this because we were interested in categorising the overlapping vulnerable poor households and also we wanted to examine the determinants of households vulnerability to poverty in post-conflict areas using the expected probability threshold of 0.5 (VEP) as left hand limit. The above categorisation process thus results in a number of overlapping groups of households. First, the population is divided into two distinct groups using the poverty line consumption threshold (0.5): the ‘poor’ and the ‘non-poor’. Those who have average consumption equal to or below the poverty lines are generally termed as the ‘poor’ and the rest is ‘non-poor’. The poor then are decomposed into two distinct groups: the ‘chronically poor’ and the ‘transient poor’. The chronically poor are those who are currently poor and also have expected consumption levels below the poverty line. These household are most likely to remain poor in future or being trapped in poverty for at least three years. The transient poor, on the other hand, are those who are also currently poor but their expected consumption levels are above the poverty line. Some of the transient vulnerable poor households have low vulnerability to poverty, but some of them have high vulnerability to poverty. As a result of this process, a total of five groups of households emerged during our analysis which are; (1) the ‘poor’, (2) the ‘non-poor’, (3) the ‘high vulnerable group’, (4) the ‘low vulnerable group’, and (5) the ‘total vulnerable group’.
(
)
0
.
5
0
(
)
0
.
5
...
...
...
.(
)
0
X
if
InZ
Inc
and
VEP
if
InZ
Inc
x
VEP
i=
θ
+
iθ
−
>
i=
−
≤
Equation (10) is the tobit model which measures the probability that a household will be poor in the future given the household current social, cultural and economic setting (X)1. It can be seen from the taxonomy above that, the characteristic feature of the high vulnerable household group are ‘low level of expected consumption’ and ‘high variability of consumption’. Similarly, the non-poor can also be partitioned into two separate groups –the ‘vulnerable non-poor’ and the ‘non-vulnerable non-poor’ depending on their degree of vulnerability to poverty, expected level of consumption and the initial poverty status. The constituents of the ‘total vulnerable group’ are then the households associated with high vulnerability group and those who are currently poor (Tobin, 1958).
On the determinants of poverty the odds ratios logit model showed that female headed households and households that dwell in urban areas are less likely to be poor. Households headed by older people, who have spent more years schooling with higher per capita expenditure on education, health and food and are taking care of dependents needs (food, medical, clothing, education and transport) are also less likely to be poor. Factors that aggravated poverty are household size, number of people between the ages of 15-19 and 65-69 years old and being in the agricultural sector. However, only household size, per capita expenditure on education, per capita
expenditure on health and per capita expenditure on food were found to be statistically significant, implying that these factors are the major determinants of household poverty in the post-conflict district of Katakwi district. We also recognized that a household’s sense of well-being depends not just on its average income or expenditures, but also on the risks it faces. Hence household vulnerability is a more satisfactory measure of welfare. Findings from our analysis further showed that in 2015 households faced on average a 20.7% of poverty level while 34.4% chance of becoming poor in the future. When decomposing vulnerability into poor and non-poor household, it was figured out that 95% of poor household are also vulnerable to poverty and 18% are non-poor vulnerable households. Furthermore households who suffered by covariate shocks due to war, conflict and natural disasters are more likely to be vulnerable to poverty, especially among post-conflict households in rural villages. Possession of productive assets such as land for agriculture practice and domestic livestock and modern equipments (bicycles, radios and mobile phones) appear to be effective in protecting consumption variability against covariant or idiosyncratic shocks and in accessing information. The probability of being vulnerable to poverty is higher for those households who had adopted behaviour-based strategies in response to aftershocks and risks.
Household description and categorization
The results of ‘the regression model shows the regression results from the equation (i) to equation (x) whereby log of household per capita consumption (RoU, 2012) or expenditure behaviour is estimated by household idiosyncratic characteristics and other determinants. The variables ‘size of the households’, ‘age of the households head’ and the ‘size of land holding’ by households along with their squares are included in the model because of the possible non-linearity of the relationship between log consumption per capita and these variables (ibid). Other variables reflecting household’s idiosyncratic characteristics are dependency ratio, hygienic conditions, whether a household has access to social protection services such as health facilities and educational infrastructure, connection to fm radio station or not, and whether households receives social assistance grants or participate in social protection safety-net (food for work) activities and programmes or not. Household’s hygienic condition in this case is defined as bad if a household does not have access to sanitary facilities including toilet latrine and safe clean drinking water. Other important inclusions are housing condition, educational level achieved by the household head, activity status engaged by household head, and whether head of the household suffered any chronic or serious illness over the past couple of years since the return of peace and security in the district.
The marginal effect after logit showed that provided a household head has reached a threshold age of approximately 47 years and has completed a minimum of 6 years of schooling and have obtained Uganda advance Certificate of Education (UACE)‟s increase in age and years of schooling reduces the probability that the household is poor by 0.00045% and 0.00071% respectively. Also, provided the household per capita expenditure on education, health and food has reached a threshold of 0.5 (Chaudhuri et al. 2002:18). Increase in per capita expenditure on education, health and food reduces the probability that the household is poor by approximately 0.00099%, 0.00073% and 0.0000086% respectively. On the other hand, provided a household size and number of people between the ages of 15 and 65 years has reached a threshold of 5 and 5, an addition of one more person increases the probability that the household is poor by 0.0036% and 0.0029% respectively. On Vulnerability the signs of its determinants showed similar to those of poverty, however they are qualitatively different. All the included household characteristics significantly explain vulnerability, except for sector, age of household head and number of people between the ages of 15 and 65. This showed that although gender, occupation, years of schooling, number of people between the ages of 15 and 65, and dependants are not important determinants of poverty they significantly determine vulnerability in Katakwi since Teso practices extended family. Specifically the results showed that female headed households, households whose primary occupation is in the agricultural sector, and households headed by children of schooling age are more at risk of becoming poor in the future (vulnerable) if there is an economic shock. The robustness check results showed both the logit and tobit regressions to be statistically significant.
While the variables other than the housing condition seem to be natural candidates for inclusion in the regression analysis, we define and categorise housing condition by the type of the materials used in construction of houses. We also included this in our analysis as this is thought to be a major and quite regular source of shocks for most of the households formerly displaced due to war and conflicts and now are returning back to their ancestral homes due to prevailing relative peace and security. Even with moderate rainfall and normal flooding conditions which has fairly been a common scenario in Katakwi and other surrounding districts, households particularly in Magoro sub-county, deep rural areas need to spend a significant amount of resources for the repair and reconstruction of their houses. Therefore, houses constructed by mud, is considered in our analysis to be poor, while houses constructed with bricks and roofed with iron sheet is considered to be a better off households or they are non-poor. The daily activities undertaken by the head of the household is grouped into three categories namely: household head with no activity meaning either they are retired or unemployed,
household-heads engaged in agricultural and household heads working in the non-agricultural sector. Similarly, households are categorised into four distinct groups in accordance with their educational levels achieved by the households head. This kind of categorization is important for designing effective social protection interventions that targets the most vulnerable household and in addition, from both theoretical and practical point of views. From the theoretical point of view, it supports the idea that the poor and the vulnerable are not the same, albeit, they are distinct groups even though they may not be mutually exclusive. The total vulnerable group thus includes all those who are currently poor plus those households who are currently non-poor but who have a relatively strong chance of falling back into poverty traps in the near future. To address this category of households especially those among the post-conflict communities, there must be a clear strategy and proven measures to help households move out of poverty and vulnerability.
Poverty and vulnerability
While the distinctions between moving out of poverty and chronic poverty and the underlying dynamics of movement in and out of poverty have significant policy implications, there are important conceptual and practical differences between identifying households who are faced with vulnerability and those households considered to be poor. The moving out-chronic poverty approach reflects the ex-post poverty dynamics among households emerging from conflicts while vulnerability literature focuses on ex-ante measurement of poverty that is, the distribution of future welfare measures (Taylor, 2008:12). These therefore, calls for an increasing recognition by all stakeholders and actors that, genuine exploration of vulnerability among households in post-conflict areas is very important aspect for understanding ex-ante poverty dynamics and policy interventions before the actual implementation of social protection interventions. The Uganda’s Poverty Status Report 2014 shows poverty in the country is on a downward spiral while the middle class has more than tripled over the last two decades with its share doubling the poor. The national poverty rate fell to 19.7% in the 2012/2013 financial year from 24.5% in 2009/2010. The available text also notes that poverty in rural areas had also fallen by almost two-thirds to 22.3% in 2012/13 from 60.4% in 1992/93. The choice of a vulnerability threshold is eventually quite arbitrary. However, two thresholds stand out as possible central points. The first, which we term the high vulnerability threshold, is the observed present poverty rate in the population. The idea is that because the experiential poverty rate represents the mean vulnerability level in the population, anyone whose vulnerability level lies above this threshold faces a risk of poverty that is greater than the average risk in the population and hence can legitimately be included among the vulnerable household that needs urgent social protection interventions. In other words, an alternative more stringent threshold is 0.50, which we term the high vulnerability threshold. A household whose vulnerability level exceeds 0.50 is more likely than not to end up poor and can be considered, therefore, to be highly vulnerable. Secondly, two populations may have similar experiential poverty rates but very different incidences of vulnerability. Consider two populations. In the first, call it population group x within a post-conflict setting, 20% of the population has a vulnerability level of 1 whereas 80% has a vulnerability level of 0. In the other, call it household y, 100% of the population has a vulnerability level of 0.20. In both populations, the experiential poverty rate will be approximately 20%. But the fraction of the population that is vulnerable (with a relative vulnerability threshold) is dramatically different. Only 20% of population group x is vulnerable, whereas with the same threshold the entire population group of y is vulnerable. This theatrical difference has important implications for policy and decision making process.
However, in the case of households emerging from post-conflicts situations like those in Katakwi district and other neighbouring post-conflict districts, have different situations and levels of them being in poverty and susceptible to poverty. Today’s poor may or may not be tomorrow’s poor because situations or conditions can change either positively or negatively in favour of the household poor. Currently non-poor households in Katakwi district, who face a high probability of a large adverse shock and risks, may, on experiencing the shocks and risks, become poor tomorrow. And the currently poor households may include some of the households who are only briefly poor at a given time period as well as others who will continue to be poor (or poorer) in the future. In other words, a household’s (or an individual’s) observed poverty status–defined in most cases simply by whether or not the household’s observed level of consumption expenditure is above or below a pre-selected poverty line is an ex-post measure of a household’s well-being (or lack thereof). But for many policy purposes, what really matters is the ex-ante risk that a household will, if currently non-poor, fall below the poverty line, or if currently poor, will remain in poverty. And the current poverty status of a household in post-conflict areas may not necessarily be a good tip to the household poverty and households’ vulnerability to poverty. Clear thoughts about suitable strategies for reducing household poverty and household vulnerability to poverty, there must be effective planning and execution of those plans to make vulnerable households benefit from such effective plan. Strong and independent institutional structures within state and non-state social protection actors needs to be supported in order for them to effectively implement pro-poor and pro-people social protection programmes and interventions that aim to prevent or reduce households future vulnerability to poverty rather than alleviate current poverty, the critical need then is to go beyond a cataloging of who is
currently poor and who is not, to an assessment of households’ vulnerability to poverty.
The share of the vulnerable non-poor fell in urban areas but rose in rural areas with almost no change in urban poverty in those years. Though vulnerability to poverty is defined as the risk or probability of falling below the poverty line, the definition of the total vulnerability group is based on both this risk as well as initial poverty status. This is to categorise a household as vulnerable is necessary to combine the probability of bad outcomes as well as some measure of their ‘badness’ according to a given social welfare function. There are obvious advantages in further disaggregation of poverty categories rather than simply dividing households into the poor and the non-poor. This disaggregation clearly demonstrates that the poor and the vulnerable are heterogeneous rather than static homogenous groups. This if well effectively and efficiently executed, will facilitate advocacy and allow monitoring of progress in reducing household vulnerability to poverty. In addition, each one of these groups is likely to respond differently to a particular situation or policies aimed at reducing poverty and vulnerability at household level and as such, it might be necessary to devise different policies for different groups (Jalan et. al., 2002). The poverty incidence, P0 is 0.2538 (=1/524 *(133)0), while the poverty gap (depth), P1 is 0.14260266 (=74.72379/524) the severity index, P2 is 0.08612625 (=45.13015/524). Additionally, the poverty gap (depth) of 0.1426 means that the averagely poor need to mobilize about 14.26 percent of financial resources to escape poverty while the severity index of 0.086 implies that the core poor needs to mobilize 8.6 percent more of financial resources to escape poverty.
Further revelations from the poverty and vulnerability profiles are shown on (annex 1: table 1 and 2). It is observed that all poor households and 46.04% of non-poor households were vulnerable given their current socio-economic characteristics. This is a serious source of concern for policy and decision makers. These results imply that if things remain the way they are today, 59.73% of Katakwi households are expected to be poor in the future. Out of the total population 34.35% constitutes the vulnerable from non-poor households and 25.38% constitutes vulnerable from poor households. These results showed that poverty in Katakwi is both transient and chronic. The vicious cycle of poverty is expected to remain unabated as all poor households are expected to remain poor unless there is a serious positive shock somewhere. These are serious concerns for social protection policy implementation at national and district level as most policy and decision makers do not understand and interpret the concept of social protection. Vulnerability assessments are likely to differ from the usual poverty assessments on a couple of accounts. First, vulnerability assessments have to be, by definition, explicitly innovative. At any point in time, given the data, the vulnerability of households is unobservable to the policy-maker. In contrast, most poverty assessments are couched in a temporal terms and the policy maker, given the right data, does actually observe the current poverty status of the household. But a sequential approach, if strictly adhered to, is of limited use in thinking about policy interventions that can only occur in the future. In practice however, of course, poverty assessments are used in the process of policy formulation, and in doing so, implicit assumptions are being made about the extent to which the situation recorded in the data used to carry out the poverty assessment will be reproduced over time. In this case, we define and refer vulnerability, within the framework of social protection potential role to reduce household poverty rather than eradication, as an ex-ante measure risk that a household will, if currently non-poor, fall below the official national poverty line, or if currently poor, will remain in trapped in poverty because there are no effective programmes and interventions. Certainly this is not the only definition possible. According to Cunningham and Maloney (2000), vulnerability is recognized in terms of exposure to adverse shocks to welfare, rather than in terms of exposure to poverty. The difference is substantive. Our definition include among the vulnerable; households who are currently poor and have a high probability of remaining poor even if they do not experience any large adverse welfare shocks and risks inform of war, conflicts, disasters, loss of family bread winner and disability due to injury. On the other hand, our definition also reject those households among the non-poor who face a high probability of a large adverse shock but are currently well-off enough so that even were they to experience the shock, they would still remain non-poor.
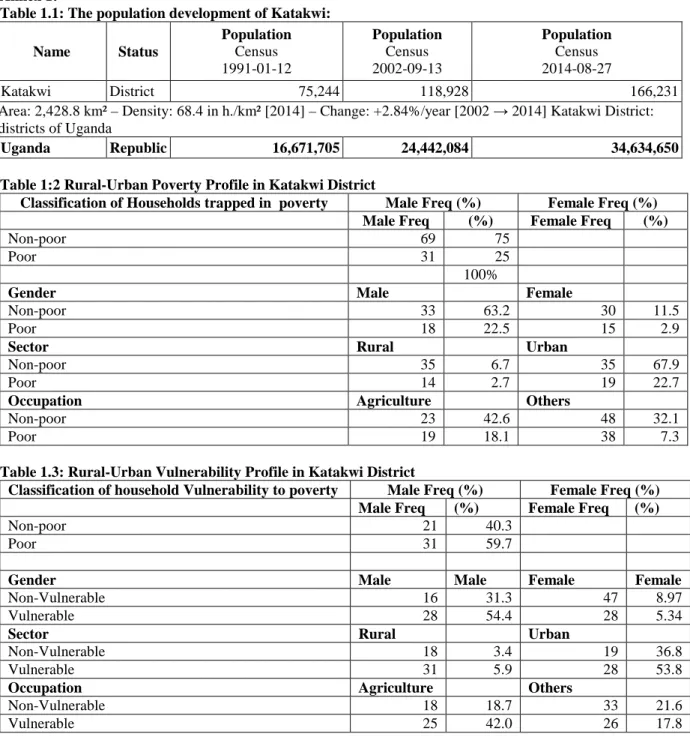
The constructed poverty line implies that households that are unable to mobilize at least $1.25 of financial resources for each household member to meet his or her consumption needs are relatively poor (RoU , 2012). About 25 percent of respondents were poor and 59.73% were expected to be poor in the future (vulnerable). Also while 22.52% of households were poor and households headed by male 54.39% were vulnerable and those headed by male and whereas 2.86% were poor and headed by female 5.34% were vulnerable and headed by female. On decomposing according to sector we found that 2.67% were poor and dwell in rural areas while 5.92% were vulnerable and reside in deep rural areas within Katakwi district. Also, 22.71% were poor and reside in semi-urban trading centers but 53.82% were vulnerable and reside in urban or town council areas. The distribution according to occupation showed that 18.13% were poor and had their primary occupation in the agricultural and 41.98% who also had their primary occupation in the agricultural sector were vulnerable. Furthermore, while 7.25% were poor and had their primary occupation in the other sectors the vulnerable that had their primary occupation in the other sectors constituted 17.75% of the population sampled for this study.
The results from the sample were designed to allow reliable estimation of key indicators for rural-urban, and separately for nine sub-counties within Katakwi district. A two-stage research design involving exploratory model was developed to complement on the explanatory sequential design (cross-sectional) data collected from household surveys. At the first stage, a list of all sub-counties, parishes and villages were grouped by location (rural-urban location); then drawn using simple, and stratified sampling procedures. At the second stage, households which are the ultimate sampling units were drawn using systematic sampling. A sample total of 200 households representing the general household population were selected. These household questionnaires were allocated to the nine sub-regions with consideration of the rural and urban areas which constituted the main domains of the sample. However, social transfers may at the same time be palliative in serving the household needs and meeting the community demands and interests. Effective implementation and close supervision of social transfers may to some extent stop further diversion of resources which at some point will attract concerted attention to tackle the real obstacles to equitable, inclusive development and social justice, and postpone actions which would initiate the necessary structural change (Taylor, 2008). This is because social transfers do not per se challenge basic household poverty and household vulnerability to poverty, neither at the rural communities nor at urban communities. Furthermore, they do not fundamentally address asset inequality and the absence of decently remunerated, dignified, long-term productive employment that and which are the core causes of persistent household vulnerabilities to poverty and socioeconomic insecurity. Social transfers if effectively implemented without bias, can alleviate, but not eliminate, the processes and constellations creating household poverty and vulnerability, since benefit levels are in most communities modest and do not enable a household to acquire, or even merely lease, productive assets.
Studies relating to household poverty and household vulnerability to poverty in the context of post-conflict districts of Teso-sub-region are mostly retrospective in nature. To the best of our knowledge, none of the studies so far have attempted to link social protection ex-ante measures in reducing household poverty and the relative impacts of social protection ex-post measures in addressing the household idiosyncratic and covariate sources of vulnerability. This distinction is important for policy and decision makers in designing anti-poverty policies and programmes, particularly policies relating to poverty prevention and promotion of those who are structurally poor by protecting and transforming their socioeconomic status. However, there are a number of studies that explored social protection measures in addressing household poverty dynamics in Uganda, that fall into this category of ex-post dynamic analysis. But also seems shorts in estimating the impact of social protection ex-ante poverty measures in reducing households idiosyncratic and covariate shocks in the dynamics related to the causes of poverty and vulnerability in rural Uganda especially among conflict affected households. Base on the foregoing we recommend that, to reduce household poverty in Katakwi and other post-conflict districts in Teso sub-region and others, state, multi-bilateral, national, regional and international social protection actors, need to build a concerted efforts that should be aimed at encouraging free, compulsory and quality education at least up to the basic level, easily accessible and quality healthcare social protection services, a population policy that would encourage a married couple to have at most four children or at most with a household size of 6, and the enabling environment that encourages hard-work and small and medium scale business to thrive. To guard against future poverty these efforts should include empowering female headed households, taking care of the child headed household’s separately and those in the agricultural sector, providing unemployment benefits/grants, and social overhead for the aged. There is still a need to cataloguing of who is poor, who is not poor, and the characteristics of those who are, should be in the dockets of any policy and decision makers. Although poverty is a stochastic phenomenon, it is different for vulnerability that household poor face. The poor today may or may not be tomorrow’s poor, but they can be vulnerable at any point in life (today and tomorrow), and some of the non-poor today may well end up being poor tomorrow because, conditions and situations differ from each household settings. We have argued in our thinking about appropriate social protection forward-looking measures for reducing household poverty and household vulnerability to poverty from the post-conflict perspective for policy interventions to flourish. We encourage policy and decision makers including the implementers of social protection programmes and interventions to look at both the causes of poverty and vulnerability and not just who is poor today, but also who is likely to be poor in the future. In other words, we need to identify who is vulnerable to poverty.
Conclusion
This study has so far examined poverty and vulnerability in Katakwi district, poverty incidence, gap, severity and its determinants, and the determinants of household vulnerability to poverty. We find striking differences in the sources of vulnerability for different segments of the household in a given population. For rural households and for less-educated households, the main source of vulnerability appears to be low mean consumption prospects; for urban households and for more highly educated households, on the other hand, vulnerability to poverty stems primarily from consumption instability. This too has significant implications for the types of social protection measures for reducing household poverty and mitigating household vulnerability to poverty.
Based on our results we conclude that income poverty in Katakwi district is not a more serious issue if we consider the fact that only about 25 percent of households are income poor however, the issue becomes very worrisome when we consider the fact that about 59.73% of the people are at risk of becoming poor in the future given their current socioeconomic characteristics, and that all those in the agricultural sector, all female headed households and all rural dwellers are also expected to be poor in the future. We also showed that the averagely poor have to mobilize financial resources apart from the social assistance grants they receive up to 14 percent of household per capita expenditure per month to escape poverty while the core poor have to mobilize additional 8.6 percent of financial resources for each household member per month to achieve the same fit. We further showed that income poverty in Katakwi is neither gender, occupational nor rural-urban issue but vulnerability is. The important determinants of poverty were showed to be household size, per capita expenditure on health, education and food while those of vulnerability included, gender, occupation, years of schooling, household size, per capita expenditure on education, health, and food, and number of dependant taken care of by the household head. It is thus obvious that the dynamism of household poverty in Katakwi is a more serious case than the static one and that poverty in Katakwi is both transient and chronic.
References
Azam, M. & Imai, K., 2012. Measuring Households ’ Vulnerability to Idiosyncratic and Covariate Shocks – the case of Bangladesh. Research Institute for Economics & Business Administration (RIEB), Kobe
University, p.54. Available at: http://www.rieb.kobe-u.ac.jp/academic/ra/dp/English/DP2012-02.pdf.
Barrientos, A. & Hulme, D., 2009. Social Protection for the Poor and Poorest in Developing Countries: Reflections on a Quiet Revolution. Oxford Development Studies, 37(4), pp.439–456.
Chaudhuri, S., 2003. Assessing vulnerability to poverty : concepts , empirical methods and illustrative examples.
… of Economics, Columbia University, New York. Available at:
http://info.worldbank.org/etools/docs/library/97185/keny_0304/ke_0304/vulnerability-assessment.pdf. Chaudhuri, S., Jalan, J. & Suryahadi, A., 2002. Assessing Household Vulnerability to Poverty from Cross-sectional Data: A Methodology and Estimates from Indonesia. World, 102–52(April), pp.1–36.
Available at:
http://www.ncbi.nlm.nih.gov/entrez/query.fcgi?db=pubmed&cmd=Retrieve&dopt=AbstractPlus&list_ uids=6086807498683160254related:vpYxtyuveFQJ\nhttp://academiccommons.columbia.edu/catalog/a c:112942.
Foster, J., Greer, J. & Thorbecke, E., 2010. A Class of Decomposable Poverty Measures Published by : The Econometric Society Stable URL : http://www.jstor.org/stable/1913475. The Econometric Society is
collaborating with JSTOR to digitize, preserve and extend access to Econometrica., 52(3), pp.761–
766.
Jalan, J. & Ravallion, M., 2002. Household income dynamics in rural China. , (November 2001).
Okello, J., 2015a. Can the Implementation of Social Protection Policies and Programme Reducing Households and Community Vulnerability to Poverty in Uganda ? The International Institute for Science,
Technology and Education (IISTE), 5(10), pp.15–23.
Okello, J., 2016. The Effective Implementation of Social Protection Programmes Can Reduce Household and Community Poverty in Uganda. The International Institute for Science, Technology and Education
(IISTE), 6(13), pp.96–105.
Okello, J., 2015b. The role of Non-State Actors in the Implementation of Social Protection Policies and Programme in Uganda. The International Institute for Science, Technology and Education (IISTE), 5(13), pp.32–43.
Pritchett, L. & Sumarto, A.S.S., 2000. ( A ) RS j L3i Quantifying Vulnerability to Poverty. The World Bank, 2437(September), p.36.
Ravallion, M., 1998. Poverty Lines in Theory and Practice, The Intemnational Bank for Reconstruction and Development/THE WORLD BANK 1818 H Street, N.W. Washington, D.C. 20433, U.S.A.
RoU, 2012. Republic of Uganda (RoU): Index, Global Competitiveness; Economic Performance Index, Kampala - Uganda.
RoU, R. of U., 2006. Uganda Bureau of Statistics (UBOs): Uganda Demographic and Health Survey, Kampala - Uganda.
Taylor, V., 2008. Social Protection in Africa: An Overview of the Challenges Prepared for the African Union. , (December).
Tobin, J., 1958. Estimation of Relationships for Limited Dependent Variables ESTIMATION OF RELATIONSHIPS FOR LIMITED DEPENDENT VARIABLES’. Source: Econometrica, 26(1),
pp.24–36. Available at:
http://www.jstor.org/stable/1907382\nhttp://www.jstor.org/page/info/about/policies/terms.jsp\nhttp://w ww.jstor.org.
MFPED Ministry of Finance, P. and E.D., 2012. Poverty Status Report 2014: Poverty Reduction and the
National Development Process, Kampala - Uganda.
Uganda Bureau of Statistics (UBOS), 2010. Republic of Uganda: National Household Survey 2009/2010, Kampala - Uganda.
Annex 1:
Table 1.1: The population development of Katakwi:
Name Status Population Census 1991-01-12 Population Census 2002-09-13 Population Census 2014-08-27 Katakwi District 75,244 118,928 166,231
Area: 2,428.8 km² – Density: 68.4 in h./km² [2014] – Change: +2.84%/year [2002 → 2014] Katakwi District: districts of Uganda
Uganda Republic 16,671,705 24,442,084 34,634,650
Table 1:2 Rural-Urban Poverty Profile in Katakwi District
Classification of Households trapped in poverty Male Freq (%) Female Freq (%)
Male Freq (%) Female Freq (%)
Non-poor 69 75
Poor 31 25
100%
Gender Male Female
Non-poor 33 63.2 30 11.5
Poor 18 22.5 15 2.9
Sector Rural Urban
Non-poor 35 6.7 35 67.9
Poor 14 2.7 19 22.7
Occupation Agriculture Others
Non-poor 23 42.6 48 32.1
Poor 19 18.1 38 7.3
Table 1.3: Rural-Urban Vulnerability Profile in Katakwi District
Classification of household Vulnerability to poverty Male Freq (%) Female Freq (%)
Male Freq (%) Female Freq (%)
Non-poor 21 40.3
Poor 31 59.7
Gender Male Male Female Female
Non-Vulnerable 16 31.3 47 8.97
Vulnerable 28 54.4 28 5.34
Sector Rural Urban
Non-Vulnerable 18 3.4 19 36.8
Vulnerable 31 5.9 28 53.8
Occupation Agriculture Others
Non-Vulnerable 18 18.7 33 21.6