IFPRI Discussion Paper No. 00766 May 2008
Global Macroeconomic Developments and Poverty
Eugenio Diaz Bonilla, Inter-American Development Bank
INTERNATIONAL FOOD POLICY RESEARCH INSTITUTE
The International Food Policy Research Institute (IFPRI) was established in 1975. IFPRI is one of 15 agricultural research centers that receive principal funding from governments, private foundations, and international and regional organizations, most of which are members of the Consultative Group on International Agricultural Research (CGIAR).
FINANCIAL CONTRIBUTORS AND PARTNERS
IFPRI’s research, capacity strengthening, and communications work is made possible by its financial contributors and partners. IFPRI gratefully acknowledges the generous unrestricted funding from Australia, Canada, China, Finland, France, Germany, India, Ireland, Italy, Japan, Netherlands, Norway, Philippines, Sweden, Switzerland, United Kingdom, United States, and World Bank.
Published by
INTERNATIONAL FOOD POLICY RESEARCH INSTITUTE 2033 K Street, NW Washington, DC 20006-1002 USA Tel.: +1-202-862-5600 Fax: +1-202-467-4439 Email: [email protected] www.ifpri.org Notices
1 Effective January 2007, the Discussion Paper series within each division and the Director General’s Office of IFPRI
were merged into one IFPRI–wide Discussion Paper series. The new series begins with number 00689, reflecting the prior publication of 688 discussion papers within the dispersed series. The earlier series are available on IFPRI’s website at www.ifpri.org/pubs/otherpubs.htm#dp.
2 IFPRI Discussion Papers contain preliminary material and research results. They have not been subject to formal
external reviews managed by IFPRI’s Publications Review Committee but have been reviewed by at least one internal and/or external reviewer. They are circulated in order to stimulate discussion and critical comment.
Copyright 2008 International Food Policy Research Institute. All rights reserved. Sections of this material may be reproduced for personal and not-for-profit use without the express written permission of but with acknowledgment to IFPRI. To reproduce the material contained herein for profit or commercial use requires express written permission. To obtain permission, contact the Communications Division at [email protected].
Contents
Acknowledgments vi
Abstract
vii
1. Introduction
1
2. Macroeconomics and Poverty: Some Definitions
3
3. A Half Century of World Macroeconomic Developments: An Overview
9
4. Implications for Poverty: A Chronological Narrative
36
5. Some Policy Conclusions and Reflections
45
List of Tables
1. World macroeconomic indicators
9
2. Growth in GDP
11
3. Shares of world GDP of developing and developed countries
12
4. Share of world GDP derived using various methods for aggregation
13
5. Correlation of growth across developing regions, 1961–2006
15
6. Inflation in developing countries (%)
18
7. Results of VAR with growth rates and prices, 1960–2006
26
8. Price volatility (monthly)
28
9. Episodes of sudden stops
32
10. Changes in health indicators in low- and middle-income countries (% change per year) 36
11. Poverty headcount, US$1 per day (% change between measures)
39
12. Poverty and crisis (poverty headcount ratio)
40
13. Financial crises and poverty
41
14. Social impact of economic crises
42
15. Change in growth in GDP per capita during recessions (%)
46
16. Change in commodity prices during recessions (%)
46
17. Changes in interest rates during recessions (%)
47
18. Change in U.S. real exchange rate during recessions
47
List of Figures
1. HDI ratio, developing countries over industrialized countries
7
2. World growth
10
3. Growth trends
11
4. Impulse-response from VARs
14
5. Percentage of developing countries in recession
17
6. Real interest rates
19
7. Growth and inflation
21
8. World real prices for metals and oil
23
9. World real prices for agricultural products
23
10. World agricultural prices, nominal indices (monthly, January 1957 to February 2008)
24
11. Terms of trade (median)
27
12. U.S. real exchange rates
29
13. Capital flows to developing countries (% GDP)
31
14. Current account imbalances (% world GDP)
33
15. Poverty headcount, US$1 per day (%)
38
ACKNOWLEDGMENTS
I would like to thank Joachim von Braun and Rajul Pandya-Lorch for our exchanges on these topics, the anonymous reviewers and editors for their comments, and all IFPRI staff that helped to put this paper together. Special thanks to Victoria del Campo for her comments and her help with data collection and analysis.
ABSTRACT
In the second half of the 1990s, a series of developments led to a renewed academic and policy interest in the intersection of macroeconomic policy and poverty issues in developing countries. The focus of that work was domestic macroeconomic policies. This paper, however, focuses on the international dimension and discusses the links between global macroeconomic conditions and poverty in developing countries since the 1960s. Of course, when analyzing policy impacts, both domestic and international aspects must be considered. However, debates about domestic policies, macro or otherwise, and their impacts on poverty cannot provide an accurate analysis of developing countries’ alternatives and predicaments if they ignore the role, in many cases overwhelming, of external factors. That is the story this paper tries to tell.
The objectives here are to present an overview of trends and cycles in the world economy, to summarize the events of the last half century in view of the current concerns about the likely economic slowdown in the United States and other industrialized economies, and to assess the possible
repercussions on the rest of the world. The hope is that the paper will serve as background material for developing countries to better characterize potential scenarios and properly define policy options for the coming years, which look like they will be far less benign than the recent past.
1. INTRODUCTION
In the second half of the 1990s, a series of developments led to a renewed interest in the intersection of macroeconomic policy and poverty issues. In 1996 the Heavily Indebted Poor Countries (HIPC) Initiative was launched, involving the International Monetary Fund (IMF), the World Bank, and other international financial institutions. The intent of the HIPC Initiative was to provide debt relief to low-income countries and thus open fiscal space to help finance their poverty reduction programs. In September 1999 the Bretton Woods institutions presented a new framework for poverty reduction strategies based on the preparation of national poverty reduction strategy papers (PRSPs). The strategies were supposed to be the basis for concessional lending by those institutions and for debt relief under the HIPC Initiative.1 Both the
IMF and the World Bank renamed their concessional facilities and instruments to emphasize the new poverty focus. These developments were part of the broader concern within the international community related to poverty alleviation that eventually led to the adoption of the Millennium Declaration containing the Millennium Development Goals during the UN Millennium Summit in September 2000.
The involvement of the IMF in the national PRSPs and the issue of debt sustainability after its reduction under various initiatives led immediately to the discussion of what type of domestic
macroeconomic policies would help with poverty alleviation efforts. A flurry of analytical activity ensued in the international organizations, academia, and civil society, focusing on the intersection of
macroeconomic and poverty issues (see, e.g., the May 2005 issue of Development Policy Review, which collected work done jointly by the International Food Policy Research Institute, the European Network on Debt and Development, the New Rules for Global Finance Coalition, and Oxfam International; Cornia [2006], which reflects a more critical view of the policy advice given by international organizations; and Mody and Pattillo [2006], based on work done mostly by IMF and World Bank staff).
Notwithstanding the current renewal of interest, concerns about the proper domestic
macroeconomic policies for development and poverty reduction are not new. Rather, they have been a recurrent topic, albeit in varying formats, in the development debates from the 1950s and 1960s to the present: from the divergent views of structuralists and monetarists on inflation and the impact of IMF stabilization programs on development (see, e.g., Sunkel 1958; Prebisch 1961; Seers 1962; Felix 1965; Johnson 1984), to the debates about stabilization and structural adjustment programs by the Bretton Woods Institutions during the 1980s (see, e.g., Easterly 2003; Truman 2003), to the current discussions about macroeconomic policies and poverty.
The focus of most of the recent work has been domestic macroeconomic policies. At the same time, analysis of development and poverty issues has a long tradition of linking the evolution of domestic indicators to the level of integration with, and the conditions prevalent in, the international economy. The literature on colonialism and neocolonialism (see, e.g., Nkrumah 1965) emphasized the negative impact of direct colonial control that led to the extraction of the value of primary products in the periphery. The notion of the secular decline of the terms of trade of developing countries highlighted a more mediated economic mechanism that, through falling prices of primary exports, would lead to the impossibility of retaining the benefits of technical progress in developing countries (Prebisch 1950; Singer 1950).2 In turn,
the theory of dependency criticized the economically imbalanced and socially unequal structures created by “dependent capitalism” in developing countries (Dos Santos 1970; Cardoso and Faletto 1979).
Besides the issue of the impact of external conditions on trend growth (and its developmental “quality”), there were concerns about the impact of world volatility on variations or oscillations around that trend, mostly related to variable world commodity prices and trade flows but also linked to
1 In 2005 the HIPC Initiative was supplemented with the Multilateral Debt Relief Initiative (MDRI) to accelerate progress
towards the Millennium Development Goals. The MDRI was supposed to provide full debt reduction by the IMF, the
International Development Association of the World Bank, and the African Development Fund, which in 2007 was joined by the Inter-American Development Bank.
2 That outcome was considered the result of market structures in developed countries (characterized by industrial oligopolies
and strong unions) that were clearly different from those of developing countries (characterized by smaller firms and surplus labor). The contrasting structures allowed developed countries to retain the benefits of technical progress, while developing countries had to surrender gains from productivity because of falling prices for their primary exports.
movements in capital flows. After experiencing the vagaries of world markets for commodities during the 19th and early 20th centuries, as well as the breakdown of the world economy resulting from two world wars and a subsequent deep recession, many developing countries turned to inward-oriented
industrialization policies with the hope of diversifying their economies away from primary production, reducing external vulnerability, and stabilizing growth. Also, it has been argued that the ups and downs in capital flows from central countries to the rest of the world, at least since the second half of the 19th century, defined the episodes of growth and recession in countries in the periphery. According to this view, the two groups of countries evolved countercyclically, because when the main economies (the center) entered into recession, capital flowed out toward smaller countries (the periphery), which then experienced an economic boom. On the other hand, when the center was growing, it stopped or
significantly slowed down the outflows of capital, which reduced growth or even generated crises in the formerly booming economies of the periphery (see, e.g., Fishlow 1985; Bordo 2006).
This paper focuses on the international dimension and discusses the links between global
macroeconomic conditions and poverty in developing countries since the 1960s. But any discussion of the effects of policy must consider both domestic and international factors. More generally, in any evaluation of policy impacts, it is important to distinguish three levels that are not always properly differentiated: (1) the nature of the policy intervention, (2) the relevant domestic conditions, and (3) the conditions that prevail at the world level that can affect both (Díaz-Bonilla 2001). Therefore, the simple narrative of the external conditions (level 3) can only be seen as indicative, and the interactions with levels 1 and 2 must also be factored in. However, debates about domestic policies, macro or otherwise, and their impacts on poverty cannot provide an accurate analysis of developing countries’ alternatives and predicaments if they ignore the role, in many cases overwhelming, of external factors. That is the story this paper tries to tell.
The objectives of the paper are to present an overview of trends and cycles in the world economy, to learn from the events of the last half century in view of the current concerns about the likely economic slowdown in the United States and other industrialized economies, and to assess the possible
repercussions on the rest of the world. Poverty in developing countries has been influenced both by world trend growth (and its developmental quality) and by cycles and crises around that trend. It looks like the world may be entering another of the periodic episodes of economic deceleration. With its broad
perspective, it is hoped that this paper will serve as background material for developing countries to better characterize potential scenarios and properly define policy options for the coming years, which look like they will be far less benign than the recent past.
Section 2 clarifies some conceptual and definitional issues. Then Section 3 describes the evolution of key global macroeconomic variables and speculates about the channels through which they may affect poverty. Section 4 presents a more integrated chronological narrative of world macroeconomic developments and poverty trends in developing countries. Finally, Section 5 concludes with some
considerations about growth and poverty perspectives in developing countries, taking into account the short-term business cycle and long-term trends.
2. MACROECONOMICS AND POVERTY: SOME DEFINITIONS
What Is the Macroeconomic Problem?
The distinction between growth (with policies acting on the aggregate supply, mainly in the medium to long term) and stabilization of cycles (with policies directed at aggregate demand, basically in the short run, to smooth out expansions and recessions) seems at first a natural way to organize the discussion about macroeconomic issues. If that dichotomy were accepted, the macroeconomic policy problem could be simply defined as the stabilization of the aggregate demand around the (independently determined) growth trend of the aggregate supply to avoid either unemployment (if there is a lack of aggregate
demand compared to potential aggregate supply) or inflation and balance of payment problems (in case of excess of aggregate demand over supply). We could call the alignment of aggregate demand with
aggregate supply the first macroeconomic problem.
However, as Stock and Watson (1988) have argued, focusing only on explanations of growth or trying only to understand cycles is the wrong approach if there are important interactions between those two aspects. Thus, it is not adequate to define the macroeconomic problem as just a question of how to align aggregate demand with an independently evolving aggregate supply. The interactions between growth and the cycle must be also considered.3 Those interactions come from several factors, including
the influence of macroprices—such as the terms of trade, exchange rate, interest rate, and average wages—on stabilization of the cycle and on growth policies.
The exchange rate plays a central role both in the nominal aspects related to the short-run
management of the aggregate demand and in the real aspects affecting aggregate supply in the longer run. The dual role of the exchange rate is reflected in the two approaches that have been applied in developing countries to define the proper exchange rate policy. First, the “real exchange rate” approach emphasizes the influence of the exchange rate on production and trade (see Balassa 1977, 1985). Second, the “nominal anchor” approach highlights the role of the exchange rate in the inflationary process and its relationship with interest rates, capital flows, and asset accumulation. The duality of the exchange rate has been at the core of several problems of inconsistency in economic programs in many countries (see Corden 1990). Interest rates have a dual role as well. They not only influence aggregate demand in the short run but also affect the choices between savings and investment and, possibly, also between technological options, thereby determining long-term growth prospects. Similarly, wages can affect aggregate demand over the cycle, but they also have an effect on the capital/labor ratios, technological alternatives, and the decision to invest in human capital, all of which define aggregate supply trends. Finally, trends and volatility in the terms of trade have short-term effects on aggregate demand as well as longer-term effects on investment and growth.
Therefore, in addition to the alignment of aggregate demand with aggregate supply, a second macroeconomic policy issue is how “to get macroprices right” and reasonably predictable (to the extent that can be influenced by policy), avoiding misalignments and reducing uncertainty.
Economic crises, with their various fiscal, financial, trade, and social manifestations, are
particularly dramatic indications of imbalances between aggregate demand and aggregate supply (the first macroeconomic policy problem) and of misalignments in macroprices (the second macroeconomic policy problem). Crises tend to affect long-term growth prospects and increase poverty through various
channels. Therefore, crisis avoidance can be considered a third macroeconomic issue in its own right. In summary, macroeconomic policies have implications both for smoothing the business cycle and for medium-to-long-term growth, and it is important to consider the three issues of (1) the proper alignment of aggregate demand and aggregate supply; (2) the level, stability, and sustainability of macroprices; and (3) avoidance of economic crises.
3 The argument of Stock and Watson refers mainly to the U.S. economy. Similarly, Aguiar and Gopinath (2004) argue that
Policy Objectives and Trade-Offs
All this has implications for the five general objectives of economic programs: (1) correcting
unsustainable disequilibria in the balance of payments (i.e., attaining “external equilibrium”); (2) reducing or eliminating inflationary pressures (i.e., attaining “internal equilibrium”); (3) promoting microeconomic efficiency and correcting distortions; (4) maintaining sustainable economic growth (including adequate levels of employment); and (5) eliminating poverty and providing for the basic needs of the population. Characteristically, short-run macroeconomic programs (usually called stabilization programs) emphasize the external and internal equilibrium (objectives 1 and 2), trying to ensure that the aggregate demand does not exceed some level (or trend growth) of aggregate supply beyond what can be financed externally on a sustainable basis. The economic policies included in these programs are mainly, but not only, monetary and fiscal measures.
On the other hand, medium-to-long-run development plans (sometimes called structural adjustment programs4) tend to underscore economic growth and efficiency (objectives 3 and 4). The
expansion of the aggregate supply depends on the quantity, quality, and level of utilization of human, capital, and natural resources on technological aspects and on the efficiency (static and intertemporal) in the allocation of resources. Policies at this level focus on microeconomic issues (especially related to prices and the system of incentives), investment programs (in human and physical capital), and
institutional development (including the adequate balance between the operation of markets and public sector intervention).
Additionally, as indicated earlier, the exchange rate and other macroprices play a central role both in the nominal aspects related to the short-run management of the aggregate demand and in the real aspects affecting aggregate supply in the longer run.
Objective 5 (elimination of poverty and satisfaction of social needs) focuses more on the structure and distribution of aggregate demand and supply. Macroeconomic/stabilization and structural
adjustment/development policies have important distributive impacts, affecting how costs and benefits are allocated across individual and social groups. These distributive aspects may be crucial to the political and institutional sustainability of the whole economic program.
Because of the various elements involved in an economic program, there may exist a wide variety of complementarities between objectives and policies. For example, price stability allows the markets to better perform their intra- and inter-temporal allocation of resources and therefore fosters efficiency and growth. Real economic growth can ease inflationary pressures and help attain a more sustainable position in the external accounts on the one hand, and can alleviate the problems related to poverty and the satisfaction of basic needs on the other hand.
However, inconsistencies, incompatibilities, and unwanted side effects may also exist. Policies aimed at structural reform and growth in the long run may produce unintended destabilizing effects on the macroeconomic internal and external balance in the short run (and may be discontinued because of that). Also, policies attempting to restore macroeconomic stability can have undesirable side effects on growth. Further, both macroeconomic and structural adjustment policies may impact social conditions, poverty, and basic needs in ways that impose undue and unfairly distributed burdens on people. Those social costs may endanger the sustainability of the economic program (because of the political and social resistance they generate) or, if the program is sustained, it may impair the preservation and formation of human capital. As a result, not only would poverty deepen but also growth opportunities going forward would decline.
Therefore, impact analysis of domestic or international macroeconomic conditions and policies must be aware of these complexities and trade-offs in reaching any conclusion.
4 “Structural adjustment” here consists of changes in the productive structure of the countries involved, expanding those
sectors in which they have international comparative advantage (or where dynamic competitive advantages can be fostered) and reducing the activities considered inefficient or not competitive. For a different perspective of what structural adjustment adjusts, see Easterly (2005).
Poverty and Income Distribution: Concepts and Issues
The ambiguity of concepts, definitions, and measures linked to poverty, income distribution, and other welfare indicators further complicates impact policy analysis.
Definitions of Poverty and Income Distribution
An obvious difference in the definitions of both poverty and income distribution, which has implications for the debate about the impact of any policy stance, is whether the variables of interest are considered in absolute or relative terms. As Kanbur (2001) notes, using the different terms can lead to different
conclusions: while the absolute number (headcount) of the poor has been increasing in some developing regions and countries, the percentage of the poor (incidence of poverty) over total population has been mostly declining in those regions and countries.5 But there are other aspects to the absolute/relative
distinction.6 An absolute poverty line (which in itself can be used for headcount or incidence statements)
does not change over the period being analyzed, reflecting some notion of a “natural” level of minimal consumption below which people are poor. By contrast, relative poverty lines change with mean income, the result of thinking about poverty not as absolute deprivation but as lacking some essentials as defined in a specific time and societal context (“social” deprivation).
Two absolute poverty lines are used in calculations of world poverty (Chen and Ravallion 2004): a “US$1 per day” definition of poverty, which reflects conditions mostly in low-income developing countries, and a “US$2 per day” definition, which refers mainly to middle-income developing countries.7
Chen and Ravallion calculated a relative poverty line by combining a fixed poverty line and a country-specific component that increases with mean consumption in that country.8 Each of the three lines gives a
different picture of the evolution of poverty between the early 1980s and early 2000s: the headcount would have declined by about 400 million people in the US$1-per-day definition, increased by some 300 million in the $2-per-day case, and decreased by some 350 million according to the combined line. However, the incidence of poverty (percentage of poor among the total population) declined, albeit in different proportions, under all definitions over the same 1981–2001 period: from 40 percent to 21 percent (US$1 per day), from 67 percent to 53 percent (US$2 per day), and from 50 percent to 29 percent (relative).9
Measurement and Aggregation Issues
Regarding measurement problems, poverty and income distribution indicators may vary significantly depending on whether market exchange rates or purchasing power parity (PPP) conversion rates are
5 Other indicators of poverty include the poverty gap index (which measures the depth of poverty, or the degree to which the
mean income of the poor differs from the established poverty line) and the squared poverty gap index (which tries to determine the severity of poverty by considering differences in income levels among the poor).
6 Also, income distribution can be defined in absolute terms (the value gap between two incomes, say 9,000 pesos, as the
difference between an income of 10,000 pesos and another of 1,000 pesos) or relative terms (the ratio of those two incomes, or 10:1 in this case). The problem is that, again, definitions of distribution-neutral growth based on absolute or relative terms do not coincide. Under the relative definition, if both incomes grow at say 5 percent, the ratio does not change, and it can be said that growth has been distribution neutral. However, with both incomes growing at 5 percent, the absolute gap has increased from 9,000 pesos to 9,450 pesos, which many would argue is not a distribution-neutral outcome (see the discussion in Ravallion 2003a). Consequently, some analysts like Dollar and Kraay (2001) consider it positive that policies promoting greater integration with the world economy (“globalization”) lead to growth in the poor groups that, according to their estimates, is similar to other higher income brackets (i.e., those policies are distribution-neutral in the relative sense); on the other hand, others argue that this result is a demonstration that globalization deteriorates income distribution based on an absolute measure of the gap (see, e.g., Wade 2004). As emphasized by Ravallion (2003a), this is a judgment or value issue rather than a pure definitional or measurement disagreement.
7 Ahmed et al. (2007) suggest subdividing the US$1 per day further into three categories: subjacent poor (living on between
US$0.75 and US$1 per day), medial poor (living on between US$0.50 and US$0.75 per day), and ultra poor (living on less than US$0.50 per day).
8 The relative poverty line is defined as the larger of US$1.08 per day and one-third of the mean daily private consumption
per capita at 1993 purchasing power parity values (Chen and Ravallion 2004)
9 Individual countries also calculate their own poverty lines (absolute or relative), which may differ from the standardized
used.10 Although the PPP measure better captures the welfare equivalence of domestic consumption
bundles, using the current exchange rate reflects more accurately the relative costs of the operations of various countries within the global economy, such as paying external debts, buying essential imports, being able to send and maintain diplomats and government representatives to the cities in industrial countries where international organizations operate, and so on (see Wade 2004).
A separate issue is whether to focus on countries or to consider the world as the proper unit of analysis to assess welfare improvements.11 Those favoring a country focus argue that it does not help the poor in Sub-Saharan Africa to know that China has reduced poverty levels, and that countries are the proper unit of analysis because it is there where policies are defined and implemented (Wade 2004).12 The global view, on the other hand, tries to consider the welfare of all individuals in a comparable manner. Surveys and National Accounts
Estimates using national accounts for mean consumption and distribution curves from household surveys yield larger declines in poverty than those using household surveys both for the mean and the distribution (Sala-i-Martin 2002a; see also Bhalla 2002, who argues that the Millennium Development Goal of cutting poverty in half by 2015 has already been achieved).
However, the use of national accounts has been criticized on the grounds that it is inconsistent to assume that household surveys, while failing to get the mean consumption right, are nonetheless properly capturing its distribution. Underestimation of mean consumption would also be presenting a less unequal picture of the distribution variable, considering that underreporting in household surveys is usually larger in higher-income households, with possible offsetting effects for poverty estimates if both aspects are considered together. Therefore, estimates that only adjust mean consumption (using national account estimates that have their own problems of estimation and also a different coverage) but accept the validity of the distribution curves would most likely underestimate global poverty and exaggerate the advances in reducing it (Ravallion 2003a, 2003b).
Human Development Measures
Rather than using income or expenditure indicators,13 as in the previous sections, a natural way of
assessing whether people are doing better is to look at specific outcomes in human development. Health, education, and other social indicators have improved considerably since the 1950s, far more than in any previous period (Crafts 2000). These improvements have implications for assessing both poverty and distribution, sometimes providing different perspectives on what the trends are.
10 Problems also arise related to the various PPP exchange rates used. When the World Bank recalculated its poverty
estimates, moving from constant 1985 PPP dollars to constant 1993 PPP dollars, past estimates for global poverty changed significantly, leading to substantial increases in past poverty incidence rates in countries of Sub-Saharan Africa, and large decreases in Latin America, the Middle East, and North Africa, even though the historical survey data in local currency had not been changed. The differences occurred in estimates for the same country, and the same year, with the same national data, and the only difference was that a new PPP exchange rate was being used (Deaton 2001). Different calculations for consumer price indices, PPP exchange rates (with different methodologies, not just updates in the underlying data), and consumption baskets to carry out those comparisons are also sources of strong disagreements. Recently, the International Comparison Program, which is coordinated by the World Bank and produces PPP estimates for 100 developing countries, has adjusted the conversion rates for several countries, including China and India (see http://www.worldbank.org/data/icp).
11 This debate has been more acute with respect to whether or not global income distribution has improved. Noting that
inequality across countries, as well as within them, seems to have increased in the last decades, some researchers conclude that world inequality has increased (see, e.g., United Nations Development Programme 1999). However, Sala-i-Martin (2002a, 2002b) argues that analyzing income distribution using the world as the unit of analysis rather than countries shows that trends both for income distribution (using a variety of indicators) and poverty have improved since the 1980s. From a worldview, these results are driven basically by China’s income growth.
12 However, more recently it has been argued that China’s high growth and related high demand for commodities have also
been pulling up growth rates in Africa and other developing countries, which presumably has also helped with poverty alleviation.
13 These measures include mostly private income and expenditures, which raises the issue that cuts (or increases) in those
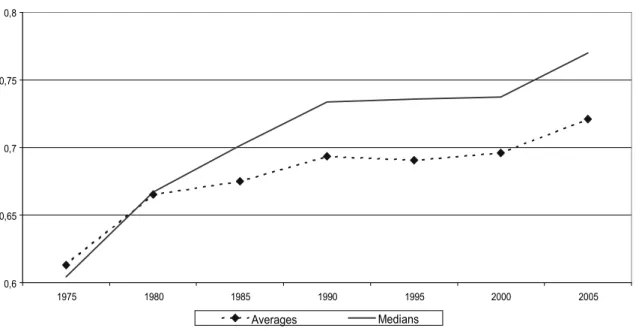
For instance, using economic or income indicators gives the impression that developing countries have lost ground against developed countries as a whole, but using more comprehensive measures of human welfare, such the Human Development Index (HDI) of the United Nations, shows an apparent global convergence in standards of living, with the gap between the richest and poorest countries declining both proportionately and absolutely between 1975 and 2005 (Figure 1; Crafts [2000] finds the same convergence in a longer time perspective).14,15
Life expectancy, however, declined after the 1980s in Sub-Saharan Africa and in some former republics of the Soviet Union. In total 35 countries have suffered declines in life expectancy since 1980, most as a consequence of the AIDS epidemics. Additionally, these are still average figures for countries and therefore may miss distributive problems within countries.
A measure that better captures the level and distribution of poverty (as well as a more accurate indicator of food problems than average food availability) is the number of malnourished children under age five. Between the 1970s and the mid-1990s, the number declined by about 37 million, and the incidence of malnutrition dropped from 47 percent to 31 percent (Smith and Haddad 2000). Other studies show further declines in incidence and number until the mid-2000s (de Onis et al. 2004). Yet the number of malnourished children under age five has actually increased in Sub-Saharan Africa, and the incidence of malnutrition is still very high there and in South Asia.
Figure 1. HDI ratio, developing countries over industrialized countries
0,6 0,65 0,7 0,75 0,8 1975 1980 1985 1990 1995 2000 2005 Averages Medians
Source: United Nations Development Program (2007).
14 The HDI includes incomes (up to a certain level), literacy, and life expectancy. However, the index has a built-in bias
toward convergence because it contains physical limits for life expectancy and mathematical limits for the percentage of literacy, and the income levels are transformed into a logarithmic index with a ceiling of US$40,000, under the assumption that achieving a respectable level of human development does not require unlimited incomes.
15 In a related approach Becker et al. (2003) address the issue of whether world inequality has changed in the last decades by
combining GDP per capita with life expectancy, arguing that a proper measure of income should consider the time frame within which it has been received, and that life cycle income, as opposed to annual income, should then be used.
Where Does All This Leave Us?
This brief review of concepts and data shows some of the complexities involved in assessing the impact of macroeconomic conditions and policies (or any policy for that matter) on poverty and income distribution. To better focus the analysis in this paper Sections 3 and 4 will mostly use the standard measure of poverty of US$1 and US$2 per day (Chen and Ravallion 2004), supplemented with references to other indicators (such as the HDI) or disaggregated health, education, and malnutrition indicators.16
16 Whatever the data may show, perhaps more relevant for the debate about the evolution of poverty are people’s beliefs
about what the trends in poverty and inequality are. Voices of the Poor, a “participatory research initiative” conducted by the World Bank (1999) in preparation for the 2000–2001 World Development Report, suggests that vulnerable populations felt that life had become more insecure and unpredictable than in previous decades because of uncertainty about production and employment, health problems, and increases in crime and violence, among other concerns. However, as discussed later in this report, those years were periods of economic turmoil in various developing countries. Other more recent opinion polls tend to paint a more positive picture, with the phase of the economic cycle always influencing perceptions. Also, Deaton (2001) notes that even when people are experiencing large increases in real incomes, they may not feel they are better off because they adapt their expectations upward. Thus, actual increases in material well-being may not lead to subjective perceptions of improvements, providing a skeptical background for any debate on poverty, income distribution, or well-being in general, irrespective of the facts.
3. A HALF CENTURY OF WORLD MACROECONOMIC DEVELOPMENTS:
AN OVERVIEW
Global macroeconomic conditions affect the level, composition, and volatility of growth in developing countries, which in turn have important implications for poverty alleviation. Those global economic conditions are in good measure defined by the policies of the industrialized countries—particularly the United States, whose business cycle has strongly influenced global economic performance since it emerged as the world’s largest economy after World War II. In turn, the impact of those modifications in global conditions on developing countries depends both on the size of the shock (such as the change in interest rates or commodity prices) and the structural characteristics and policies of the developing countries.
This section presents an overview of global macroeconomic developments during the last five decades and tries to outline the channels through which they influence poverty trends in developing countries.
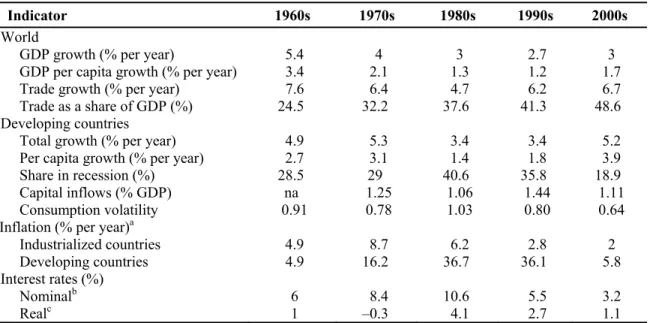
Table 1. World macroeconomic indicators
Indicator 1960s 1970s 1980s 1990s 2000s World
GDP growth (% per year) 5.4 4 3 2.7 3
GDP per capita growth (% per year) 3.4 2.1 1.3 1.2 1.7
Trade growth (% per year) 7.6 6.4 4.7 6.2 6.7
Trade as a share of GDP (%) 24.5 32.2 37.6 41.3 48.6
Developing countries
Total growth (% per year) 4.9 5.3 3.4 3.4 5.2
Per capita growth (% per year) 2.7 3.1 1.4 1.8 3.9
Share in recession (%) 28.5 29 40.6 35.8 18.9
Capital inflows (% GDP) na 1.25 1.06 1.44 1.11
Consumption volatility 0.91 0.78 1.03 0.80 0.64
Inflation (% per year)a
Industrialized countries 4.9 8.7 6.2 2.8 2
Developing countries 4.9 16.2 36.7 36.1 5.8
Interest rates (%)
Nominalb 6 8.4 10.6 5.5 3.2
Realc 1 –0.3 4.1 2.7 1.1
Sources: IMF (2007b); World Bank (2007).
Notes: Growth is aggregated at market exchange rates. Consumption volatility data represent a median of the five-year rolling average of standard deviation/average growth for developing countries. For the 1960s, data cover various years. For the 2000s, data on GDP, trade growth, interest rates, and inflation are for 2000–2006. na = not available.
a Consumption index.
b London Interbank Offered Rate , 6-month dollar deposits. c Using industrialized-country inflation rates.
An obvious observation is that world macroeconomic conditions have changed significantly over the last decades (Table 1), affecting developing countries in diverse ways. The evolution of those key variables is discussed in the following sections. The structure of each subsection is similar, starting with a discussion of the evolution of the variable of interest and ending with some considerations about their possible links to poverty developments.
Growth
Average world economic growth has declined in every decade since the 1960s, when it reached 5.4 percent total and 3.4 percent per capita, but it seems to have picked up somewhat in the first half of the 2000s compared with the 1990s (see Table 1). In particular, world GDP growth per capita has gone up in
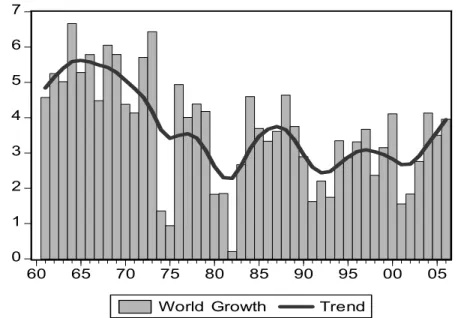
the first half of the 2000s, helped in part by declines in population growth, but without reaching the levels of the 1960s and 1970s for the world as a whole. Figure 2 shows the cycles in world growth over the last half a century.17
Figure 2. World growth
Source: World Bank (2007).
The sustained growth of the 1960s and early 1970s ended with the first oil crisis of the mid-1970s. Since then, the world economy has had three cycles with strong decelerations at the beginning of the 1980s, 1990s, and 2000s. The current growth cycle is now threatened by economic deceleration in the United States and other industrialized countries.
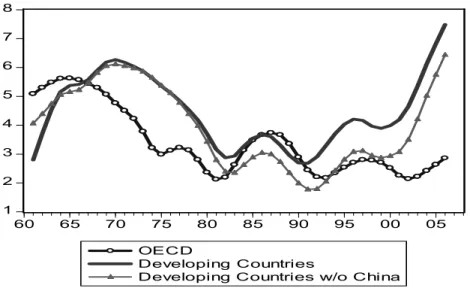
Figure 3 separates the trends in total growth of the industrialized countries from those of
developing countries with and without China.18 This disaggregation shows that the acceleration in world
economic growth during the 2000s is clearly the result of the performance of developing countries, where total growth (at 5.6 percent) is comparable to the average in the 1970s (5.4 percent), while growth per capita is at the highest point of the series: 4.2 percent in the 2000s compared with 3.2 percent in the 1970s (see Table 2).
17 The trend is calculated using the Hodrick-Prescott filter (power 4; smoothing parameter 6.25). The aggregation is at
market exchange rates. The IMF also calculates a world growth variable, aggregated using PPP exchange rates as weights. The world growth variable calculated with PPP weights shows higher world growth rates than at market exchange rates because it gives more weight to fast-growing developing countries such as China (see the discussion of the differences in GDP shares using market exchange rates or PPP conversion factors later in this report). This study used market exchange rates, considering that growth impulses from trade and financial flows are transmitted at market, not PPP, rates.
18 Excluding India also does not make much of a difference. 0 1 2 3 4 5 6 7 60 65 70 75 80 85 90 95 00 05
Figure 3. Growth trends 1 2 3 4 5 6 7 8 60 65 70 75 80 85 90 95 00 05 OECD Developing Countries
Developing Countries w/o China
Source: World Bank (2007).
Note: OECD = Organization for Economic Co-operation and Development
Table 2. Growth in GDP Region 1960s 1970s 1980s 1990s 2000– 2006 1960s– 1970s 1980s– 2000s Total
East Asia & Pacific 3.8 7.2 7.7 8.2 8.3 5.6 8.1
East Asia without China 5.2 7.1 5.4 5.2 5.3 6.2 5.3
Latin America & Caribbean 5.3 5.7 1.8 2.9 3.2 5.5 2.6
Middle East & North Africa 8.8 6.0 2.2 4.3 4.0 6.8 3.5
South Asia 4.2 3.0 5.7 5.4 6.5 3.6 5.8
South Asia without India 4.9 3.2 5.2 4.4 5.2 4.0 4.9
Sub-Saharan Africa 4.6 4.1 2.2 2.0 4.5 4.3 2.7
Developing countries 5.0 5.4 3.3 3.4 5.6 5.2 4.0
Industrialized countries 5.5 3.7 3.0 2.5 2.4 4.5 2.6
Per capita
East Asia & Pacific 1.6 5.0 6.0 6.8 7.4 3.4 6.7
East Asia without China 2.6 4.6 3.4 3.4 3.9 3.7 3.5
Latin America & Caribbean 2.5 3.2 -0.3 1.2 1.8 2.8 0.8
Middle East & North Africa 5.9 3.1 -0.7 2.0 2.2 3.9 1.0
South Asia 1.8 0.6 3.4 3.3 4.7 1.2 3.7
South Asia without India 2.4 0.7 2.8 1.9 2.9 1.5 2.5
Sub-Saharan Africa 2.0 1.2 -0.8 -0.6 2.0 1.6 0.0
Developing countries 2.7 3.2 1.4 1.8 4.2 3.0 2.2
Industrialized countries 4.3 2.9 2.3 1.8 2.4 3.6 2.0
Source: World Bank (2007).
Several points in Figure 3 are worth noting. First, during the 1960s and 1970s, the inflexion in the growth trend for developing countries was preceded by the decline in growth in industrialized countries. In fact, applying Granger’s test of causality shows that changes in growth in industrialized countries led those in developing countries up to the mid-1990s. Second, the business cycles of industrialized and developing countries appear more synchronized in the world deceleration of the early 1980s and early 1990s; however, the slowdown that occurred at the world level and in industrialized countries in the early
2000s clearly took place after the decline in growth that affected developing countries in the late 1990s, when they suffered a series of financial crises, particularly in Asia and Latin America and the Caribbean (LAC). Unlike in the previous period, Granger’s causality tests during the 1990s and 2000s show strong two-way influences between growth in developed and developing countries. Third, the trends of
developing countries with and without China, which did not differ much in the 1960s and 1970s, began to show a widening gap beginning in the 1980s. Fourth, cycles in industrialized countries during the last three decades took place around a more stationary path; developing countries, on the other hand, although clearly affected by a deceleration in the late 1990s and early 2000s, appear nonetheless on an upward trend, reaching new heights in the second half of the 2000s. As mentioned earlier, this upward path is threatened by the current deceleration in United States and other industrialized countries.
Developing regions show important heterogeneity in growth patterns, both across geographical areas and periods (see Table 2). The high growth rates, total and per capita, that LAC, Sub-Saharan Africa (SSA), and the Middle East and North Africa (MENA)19 had during the 1960s and 1970s decelerated to 1
percent or less for the period 1980–2005. On the other hand, East and South Asia have experienced accelerations in both total and per capita economic growth since the 1980s. Even when China and India are not included in the totals, those regions have approximately maintained (East Asia) or increased (South Asia) their per capita growth rates from the 1980s through the 2000s compared with the 1960s and 1970s, and those rates have stayed above the averages of other developing regions.
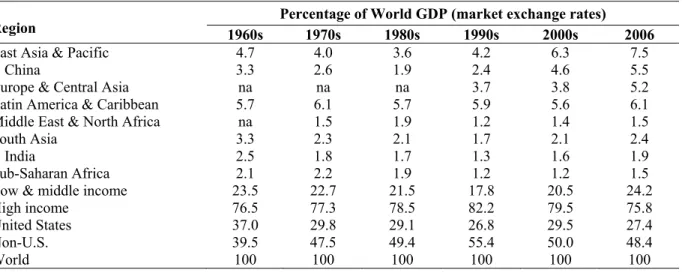
The different growth rates have changed the way the different groups of countries participate in the world economy. Table 3 provides a perspective based on economies calculated at market exchange rates.
Table 3. Shares of world GDP of developing and developed countries
Region 1960s 1970s 1980s 1990s 2000s 2006 Percentage of World GDP (market exchange rates)
East Asia & Pacific 4.7 4.0 3.6 4.2 6.3 7.5
China 3.3 2.6 1.9 2.4 4.6 5.5
Europe & Central Asia na na na 3.7 3.8 5.2
Latin America & Caribbean 5.7 6.1 5.7 5.9 5.6 6.1
Middle East & North Africa na 1.5 1.9 1.2 1.4 1.5
South Asia 3.3 2.3 2.1 1.7 2.1 2.4
India 2.5 1.8 1.7 1.3 1.6 1.9
Sub-Saharan Africa 2.1 2.2 1.9 1.2 1.2 1.5
Low & middle income 23.5 22.7 21.5 17.8 20.5 24.2
High income 76.5 77.3 78.5 82.2 79.5 75.8
United States 37.0 29.8 29.1 26.8 29.5 27.4
Non-U.S. 39.5 47.5 49.4 55.4 50.0 48.4
World 100 100 100 100 100 100
Source: World Bank (2007). na: not available.
Since the 1960s, the shares of world GDP of developing and developed countries measured in current dollars, using the categories defined by the World Bank, has remained approximately constant: 18–24 percent for developing (low- and middle-income) countries versus 76–82 percent for industrialized (high-income) countries. Within developing countries in the 2000s, East Asia and the Pacific (EAP) gained share, LAC and MENA stayed about the same, and South Asia (SA) and SSA lost share in the world economy. The United States has declined from its high participation in the 1960s but has since
19 This paper primarily follows the country aggregates defined in the World Development Indicators of the World Bank. The
other developing regions are East Asia and the Pacific (EAP) and South Asia (SA). The category of “low- and middle-income countries” is taken here to represent all developing countries. The world total is completed with the category “high-income countries” (which is divided into the high-income countries of the Organization for Economic Co-operation and Development and the rest).
stayed around 27–30 percent of world GDP. By contrast, other high-income countries, including the European Union, Japan, and Canada, gained share.
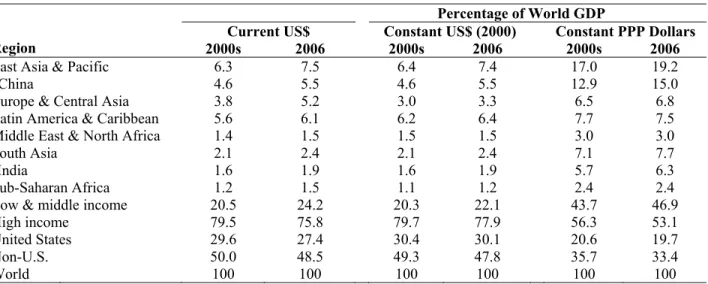
This perspective changes somewhat when other methods for aggregation are used. The three main alternatives are constant U.S. dollars, current PPP dollars, or constant PPP dollars. Table 4 presents the comparison for 2000s and 2006 (the last year with data), using the last two columns of Table 3 and comparing those numbers with data with constant U.S. dollars and constant PPP dollars.
Table 4. Share of world GDP derived using various methods for aggregation
Region
Percentage of World GDP
Current US$ Constant US$ (2000) Constant PPP Dollars 2000s 2006 2000s 2006 2000s 2006
East Asia & Pacific 6.3 7.5 6.4 7.4 17.0 19.2
China 4.6 5.5 4.6 5.5 12.9 15.0
Europe & Central Asia 3.8 5.2 3.0 3.3 6.5 6.8
Latin America & Caribbean 5.6 6.1 6.2 6.4 7.7 7.5
Middle East & North Africa 1.4 1.5 1.5 1.5 3.0 3.0
South Asia 2.1 2.4 2.1 2.4 7.1 7.7
India 1.6 1.9 1.6 1.9 5.7 6.3
Sub-Saharan Africa 1.2 1.5 1.1 1.2 2.4 2.4
Low & middle income 20.5 24.2 20.3 22.1 43.7 46.9
High income 79.5 75.8 79.7 77.9 56.3 53.1
United States 29.6 27.4 30.4 30.1 20.6 19.7
Non-U.S. 50.0 48.5 49.3 47.8 35.7 33.4
World 100 100 100 100 100 100
Source: World Bank (2007).
In PPP measures, the difference between developing and industrial countries is closer to 45 percent versus 55 percent, suggesting that many developing countries, by maintaining undervalued market exchange rates, appear smaller than they would have if PPP conversion factors had been used. However, the PPP factors have recently been adjusted and could change again. In constant U.S. dollars, developing countries reach only 20–22 percent of world GDP. The devaluation of the U.S. dollar and the consequent shrinking of its economy relative to other countries whose currencies have recently appreciated is not reflected in the constant-U.S.-dollar measure (the World Bank uses exchange rates of 2000, which is before the subsequent dollar decline; see Section 3.5.
Which measure is more appropriate? It depends on the application. The advantage of using current U.S. dollars is that financial flows, trade in goods and services, international aid, remittances, and so on take place in current dollars of a particular year. Further, the cross impacts of the economic
performance of some countries on others take place in current dollars (or equivalent currencies). The disadvantage is that changes in valuation of exchange rates generate movements in world participation that later may be reversed without the underlying economies having changed much in terms of their basic strength. Regardless, in all the measures, developed countries have a larger participation in the world economy than do developing countries. Particularly when current or constant U.S. dollars are used, the difference in sizes of the economies is significant.
A relevant question in this regard is, what is the relationship between growth in industrialized countries and developing countries? Sir Arthur Lewis, in his Nobel lecture in 1979 (later published in the American Economic Review), noted that during the previous hundred years, growth in developing regions depended on the rate of growth in the developed world, and he was concerned about the impact of the evident slowing down of the industrialized countries during the late 1970s (see Figure 3). Goldstein and Kahn (1982) analyzed the period with different statistical approaches and found that growth in
industrialized countries was indeed related to growth in developing countries but that additional factors weakened the link, including other developments in the world economy and domestic policies in developing countries. Goldstein and Kahn finished their analysis before the deep economic downturn of
the early 1980s, when clearly the recession in the United States and other industrialized countries had extremely negative effects in all developing countries.
During the mid-1990s Hoffmaister and Samiei (1996) looked mostly at the traditional trade linkages and noted that at least some regions of the developing world, such as many Asian developing countries, have become less influenced by the business cycle in the developed countries. After that paper was written, the issue of linkages across economies gained momentum with the 1997 Asian Crisis but was more focused on financial aspects.
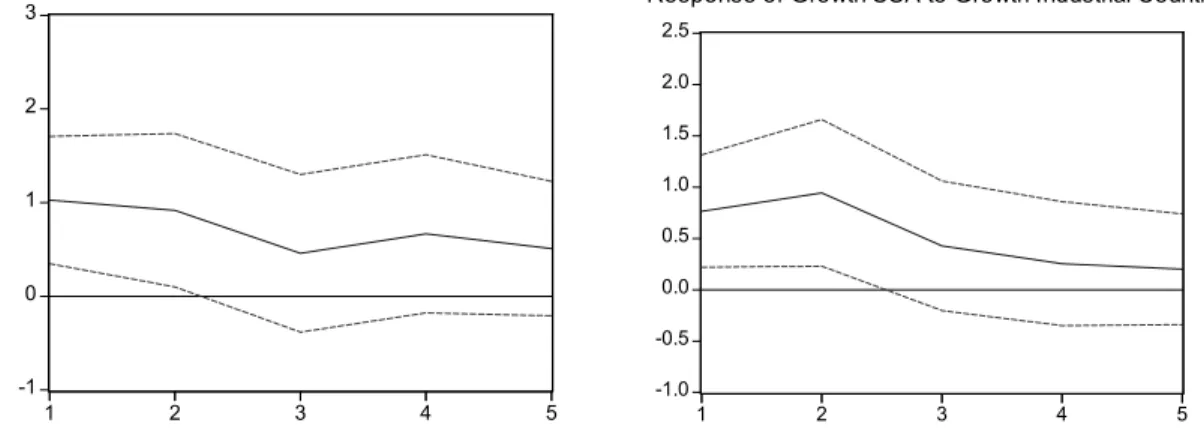
As an indicative experiment, Figure 4 shows the results of a simple bivariate vector
autoregression (VAR) linking growth in industrial production in the main industrialized countries and overall growth in each one of the developing regions for the period 1960–2006.20 The impulse-response curves (with 5 percent confidence bands around them) are shown for LAC and SSA, the only two regions where the impact is statistically significant. It is also clearly positive and economically relevant: growth of 1 percent in industrial activity in developed countries leads to growth of about 0.3 percent for LAC; for SSA growth is somewhat less, at about 0.22 percent.21 For the other regions (MENA, SA, and EAP), the impulse–responses are not statistically significant.
Figure 4. Impulse-response from VARs
-1 0 1 2 3 1 2 3 4 5
Response of Growth LAC to Growth Industrial Countries
-1.0 -0.5 0.0 0.5 1.0 1.5 2.0 2.5 1 2 3 4 5
Response of Growth SSA to Growth Industrial Countries
Sources: The index of industrial production is from IMF (2007b); growth for the developing regions is from World Bank (2007). Notes: The VARs are run with three lags. The identification uses the Cholesky decomposition, with the ordering starting with the industrial countries. The impulse–response is the result of the impact of a shock of one standard deviation (positive) on the variables of interest, based on the estimated VAR equations. The solid blue line is the impulse-response and the dotted red lines are the confidence intervals.
The fact that the regions are aggregates of countries certainly mutes the effects that would be more precisely identified at the country level. Also, industrial countries may have different impacts on different regions. For instance, the 2007 IMF World Economic Outlook uses panel regressions from 1970–2005 to estimate “growth spillovers” IMF 2007a) The IMF found that U.S. growth has a larger impact on LAC, with 1 percent growth in the United States leading to somewhat less than 0.25 percent for the region, close to the estimate calculated using a simple VAR for all industrialized countries (Figure 4). The European Union affects the economic performance of Africa in particular, with a relationship of 1 percent to 0.25 percent (also similar to the simple VAR in Figure 4). Japan does not seem to affect either of those developing regions, and it has only a small influence on Asia. In general, Asia seems to be more influenced by its own internal dynamics, although the United States, Europe, and Japan, in that order,
20 It is customary to use industrial growth in developed countries (which is supposed to have a stronger linkage with
developing countries through tradables) instead of total growth (which mixes growth of tradables and nontradables) to run causality analyses. However, total growth is used for developing countries
21 These numbers come from comparing the value of one standard deviation in industrial production (about 3 percentage
appear to have some influence; however, the coefficients are far smaller than in the case of the United States and LAC or the European Union and Africa (IMF 2007a).
It can also be argued that to the extent that trade and financial integration has been advancing, the impact of industrialized growth on developing countries (and probably vice versa) may be increasing—a point that the IMF also notes in its 2007 World Economic Outlook IMF 2007a). In fact, VARs similar to those reported here (but run only for the period 1990–2006 without China and India) indicate positive links between growth in industrialized countries and the developing regions. Also, as previously
mentioned, Granger’s causality tests cannot reject the null of the two-way influence between developing countries and industrialized growth.
What are the relationships among different developing countries in terms of growth? Table 5 shows simple pair-wise correlations.
Table 5. Correlation of growth across developing regions, 1961–2006
Region
1961–2006
LAC SSA MENA EAP SA
LAC 1.000000 0.480684* 0.188488 0.002044 -0.331036* SSA 0.480684* 1.000000 0.171261 0.075852 0.006000 MENA 0.188488 0.171261 1.000000 -0.374294* -0.174486 EAP 0.002044 0.075852 -0.374294* 1.000000 0.255175 SA -0.331036* 0.006000 -0.174486 0.255175 1.000000 Region 1990–2006
LAC SSA MENA EAP SA
LAC 1.000000 0.161801 0.118376 0.393225* 0.187692
SSA 0.161801 1.000000 0.119558 -0.070949 0.591196*
MENA 0.118376 0.119558 1.000000 -0.428050* 0.081765
EAP 0.393225* -0.070949 -0.428050* 1.000000 0.213471
SA 0.187692 0.591196* 0.081765 0.213471 1.000000
Source: Calculations by the author using data from World Bank (2007). * Significant at 10% or better.
Looking at the whole period (1961–2006), the LAC and SSA regions have the largest positive correlation coefficients between them, and those correlations are significant. MENA appears also positively correlated with those two regions, but with smaller and nonsignificant coefficients. On the other hand, negative correlations appear between MENA and EAP and between LAC and SA, and both negative links appear statistically significant. One possible interpretation is that oil price shocks affected EAP negatively but MENA positively, while food price shocks, which helped LAC, coincided with weather events in SA that affected agriculture and overall growth in that region, particularly in the 1970s.
The negative correlation between LAC and SA disappears if the sample is restricted to 1990– 2006, but the co-movement between MENA and EAP persists. In the last two decades, the strongest positive correlations appear to have been between LAC and EAP on the one hand and between SSA and SA on the other. LAC and EAP, with middle-income countries integrated in world financial markets, suffered sequential financial crises during the 1990s (as discussed later), while SSA and SA, with mostly lower-income countries less integrated in capital markets, were spared from those events but shared the common buoyancy of developing countries during the 1990s and 2000s (see Figure 3).
In summary, the issue of the synchronization of the business cycle across countries is a topic of intense debate (see, e.g., IMF 2007a). Two factors define the nature of the co-movements among
economies: (1) the clear increase in trade and financial links (e.g., Table 1 shows the increase in the share of trade on GDP; for the increase in financial links, see Prasad et al. 2003), which should lead to increased co-movements;22 and (2) the size of the common shocks; that is, the larger the common shocks, the larger the synchronization. For instance, during the 1960s—a period of lower world shocks and comparatively less economic integration—countries appeared less correlated than during the 1970s and 1980s, when large world shocks were experienced. During the 1990s and 2000s, countries appeared more correlated than in the 1960s because of greater trade and financial integration but less correlated than in the 1970s and 1980s as a result of smaller world shocks (IMF 2007a).
The business cycle of the United States is still at the center of world fluctuations because of the size of the U.S. economy and its openness in trade and financial variables: each one of the world decelerations since 1974–1975 coincided with U.S. recessions (not so in the 1960s, however). Besides world synchronization, regional co-movements appear to have increased, particularly within Asia and Latin America.
The more specific question for this paper is, what is the relationship between growth and poverty? In general, analyses of those links have focused on the implications of domestic growth, not world
growth. However, the previous paragraphs have established that there is a nontrivial amount of co-movement between world growth, led by industrialized countries (which still represent about 75 percent of world GDP at market rates), and developing countries performance.
At the country level the general consensus is that, all things equal, higher trend growth leads to lower poverty (see Dollar and Kraay 2001; Ravallion 2001). But distribution also matters. An important level of inequality at the beginning of an economic acceleration will reduce the impact of neutral growth, which will take longer to reduce poverty by a given percentage. Whatever the initial inequality, the behavior of distribution during the growth spell also matters: although poverty declines with growth that is distributionally pro-poor, or at least neutral, a worsening distribution could easily wipe out those gains. Therefore, growth is important for poverty reduction, but both the initial income distribution and changes in that distribution are also crucial (Bourguignon 2002, 2004; Ravallion 2004). A crucial development question in this regard is how the three components of that triangle interact with each other (Bourguignon 2004).
This is related to the composition, social and sectoral, of growth: if it centers on sectors or activities that use labor and assets of the poor, growth will improve income distribution and have a larger positive impact on alleviation of poverty and hunger. For many low-income developing countries, where agriculture continues to be very important for production, employment, and exports, and where most of the poor work, agricultural development is crucial for poverty and hunger alleviation.
High and sustained growth also helps strengthen the fiscal position of governments, and those public resources can be used to finance policies and programs that favor the poor. On the other hand, low growth punctuated by crises weakens the fiscal position of countries and may lead to cuts in public programs in support of economic growth, social need, and the poor. In general, it is crucial not only to sustain high average trend growth, distributionally neutral or pro-poor, but also to avoid economic crises that might inflict long-lasting damage to the already low levels of human and physical capital of the poor and vulnerable (Lipton and Ravallion 1995). The issue of crises is discussed next.
Volatility and Crises
Besides average growth performance, volatility of growth is an important consideration for poverty alleviation. Table 1 shows the volatility in aggregate consumption for developing countries.23 Figure 5
22 It has been argued that not all trade increases co-movements equally: intraindustry trade increases synchronization more
significantly than does interindustry trade.
23 Volatility of GDP, or consumption growth, is calculated as the five-year moving average of the standard deviation of
growth of the respective variable divided by the five-year moving average of its mean. This is done for every developing country. Then the median over all developing countries is calculated for every year, and averages are taken for the decade.
shows the proportion of developing countries with zero or negative growth each year from 1961 to 2005, measured in GDP per capita (see also the decade averages in Table 1).
Figure 5. Percentage of developing countries in recession
0% 10% 20% 30% 40% 50% 60% 19611963196519671969197119731975197719791981198319851987198919911993199519971999200120032005
% Developing Countries in Recession
1992
1999 1982
1987 1975
Source: Calculations by the author using data from World Bank (2007).
The largest number of developing countries in recession occurred at the time of global slowdowns—in 1975, 1982, and 1992. The exception is 1999, in which a slowdown occurred but the number of developing countries in recession anticipated the world deceleration of 2001–2002 (see Figures 2 and 5). The proportion of developing countries in recession peaked in 1982 and 1992 (the latter still influenced by the breakdown of the Soviet Union) at more than 50 percent. The proportions in 1975 were just below 40 percent and in 1999 and 2001 around 30 percent. It is interesting to note that 1987, not a year of world deceleration, shows percentages of developing countries in recession above both the years around the mid-1970s and early 2000s; the main reason appears to be the collapse in commodity prices that occurred in the mid-1980s (as discussed later).
It is also important to know the depth of the recession when discussing poverty alleviation. The average growth decline for the countries in recession was about –5.5 percent in the mid-1970s and –6.7% in the early 1980s. In the early 1990s, influenced by the breakdown of the Soviet Union, it dropped to – 8.6 percent, and finally, the recession of the early 2000s was the mildest in terms of the number of countries involved (see Figure 5), and the average decline was smaller in absolute value at –4.9 percent.
Clearly, volatility and countries in recession increased during the 1970s, peaking in the recessions of the early 1980s and early 1990s, but they have been declining since then. In fact, during the 2000s, developing countries have experienced the lowest volatility (measured in terms of both consumption volatility and number of countries in recession) for the half century analyzed here (see Table 1 and Figure 5).
What are the links connecting volatility and poverty? A crisis reduces growth at the time as well as afterward to the extent that it affects installed capital. Moreover, the recurrence of a crisis increases uncertainty, reducing investment and therefore future capital. A crisis also tends to leave a legacy of public and private debt, weakening fiscal accounts and financial systems, which may constrain public and private aggregate demand going forward.
Not only does volatility tend to reduce growth (Kose et al. 2005), affecting poverty through that channel, but also it appears to negatively affect poverty more directly. For instance, higher unemployment
and its persistence over time deteriorate human capital. Improvements in health, nutrition, and education indicators are usually slowed down or reversed by a crisis, with its negative impact on the human capital of the poor and its contribution to the persistence of poverty (Dercon and Hoddinott 2005). Declines in the human capital of the poor also affect the performance of the economy, which is an economic justification for the provision of publicly funded safety nets (Lustig 2000).
Crises may also compromise the limited productive capital of the poor if, for instance, assets like livestock must be sold to help small farmers face economic shocks (Lipton and Ravallion 1995).
Macroeconomic crises limit the possibilities for the poor to self-insure individually or through communal schemes (Dercon 2005). Also the poor may lack the educational skills to shift activities, and depend more heavily on public services that could be affected by economic crises.
Crises can also worsen income distribution, making it more difficult for the growth recovery to reduce poverty (Lustig 2000).24 A high degree of income or consumption volatility can also cause poverty traps, not only because of the irreversible negative impact that crises can have on the human capital of the poor but also because the risky environment leads the poor to engage in low-return activities.
The negative effect of volatility on poverty seems to be more noticeable in the low-income developing countries of Africa but has also affected middle-income countries suffering from financial crises. For Latin America, the Inter-American Development Bank (1995) estimates that if LAC had a level of macroeconomic stability similar to industrialized countries, the poverty headcount would have been reduced by one-quarter.
The different growth and volatility patterns over time in different developing regions have resulted unequal performance in terms of poverty reductions. Currently, stronger economic growth and lower volatility appear to have contributed to further reductions in poverty in many developing countries (see Section 4).
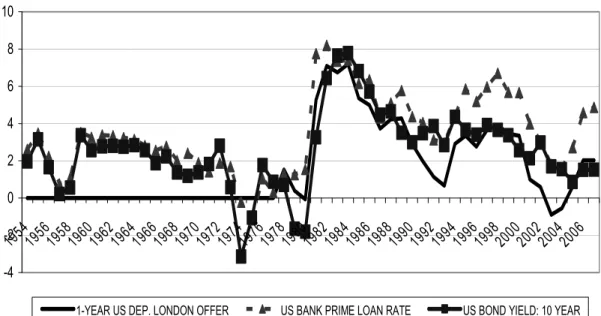
Inflation and Interest Rates
In the last decades the world economy has gone through what has been called “the rise and fall of inflation” (IMF 1996), with a parallel cycle for nominal and real interest rates (see Table 1). Along with the reduction in growth volatility during the last years (which included both developing and industrialized countries), the decline in inflation and interest rates has led some to call the period since the 1990s the “Great Moderation” (Bernanke 2004).
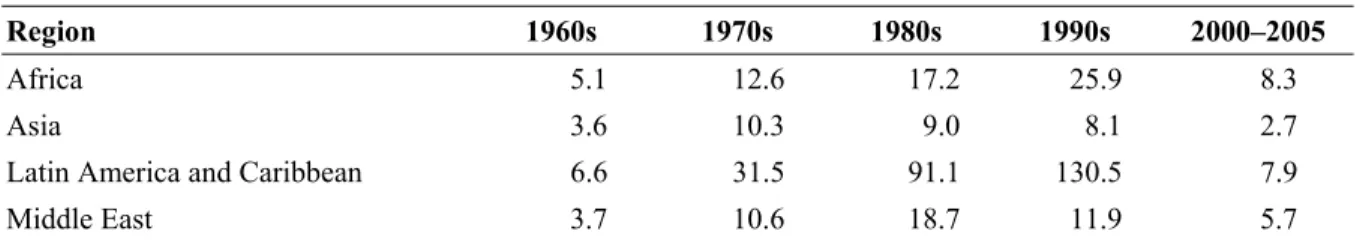
In all developing regions, as in the industrialized world, inflationary pressures have abated since the mid- to late 1990s, going back to levels more comparable to those of the 1960s (see Table 1). There are, however, clear differences across regions, with LAC and Africa showing higher inflationary pressures that Asia and the Middle East (Table 6).
Table 6. Inflation in developing countries (%)
Region 1960s 1970s 1980s 1990s 2000–2005
Africa 5.1 12.6 17.2 25.9 8.3
Asia 3.6 10.3 9.0 8.1 2.7
Latin America and Caribbean 6.6 31.5 91.1 130.5 7.9
Middle East 3.7 10.6 18.7 11.9 5.7
Source: IMF (2007b).
Asia experienced only mild increases, more in line with inflationary developments in the industrialized world, converging during the 2000s to rates below 3 percent annually. Inflation peaked during the early 1990s in LAC and Africa: the highest rate was 460 percent in the year 1990 in LAC and
24 However, Epaulard (2003) did not find asymmetric effects of growth on poverty—that is, negative growth did not