Copyright © 2017 IEEE
Pre-print of:
Auer, Stefan; Hornig, Isabel; Schmitt, Michael; Reinartz, Peter, “Simulation-based
Interpretation and Alignment of High-Resolution Optical and SAR Images”, IEEE
Journal of Selected Topics in Applied Earth Observations and Remote Sensing,
2017, accepted for publication.
DOI: 10.1109/JSTARS.2017.2723082
This material is posted here with permission of the IEEE.
Such permission of the IEEE does not in any way imply IEEE endorsement of any
products or services.
Internal or personal use of this material is permitted.
However, permission to reprint/republish this material for advertising or
promotional purposes or for creating new collective works for resale or
redistribution must be obtained from the IEEE by writing to:
[email protected]
Simulation-based Interpretation and Alignment of
High-Resolution Optical and SAR Images
Stefan Auer, Isabel Hornig, Michael Schmitt
Senior Member, IEEE
, Peter Reinartz
Member, IEEE
Abstract—The successful alignment of optical and SAR satellite data requires that we account for the effects of sensor-specific geometric distortion, which is a consequence of the different imaging concepts of the sensors. This paper introduces SimGeoI, a simulation framework for the object-related interpretation of optical and SAR images, as a solution to this problem. Using meta-information from the images and a digital surface model as input, the processor follows the steps of scene definition, ray tracing, image generation, geo-coding, interpretation layer generation, and image part extraction. Thereby, for the first time, object-related sections of optical and SAR images are automatically identified and extracted in world coordinates under consideration of 3-D object shapes. A case study for urban scenes in Munich and London, based on WorldView-2 images and high-resolution TerraSAR-X data, confirms the potential of SimGeoI in the context of a perspective-independent and object-focused analysis of high-resolution satellite data.
Index Terms—Data Fusion, Optical Data, SAR Data, Digital Surface Model, Simulation, Interpretation, Urban Areas, High-resolution Imaging, Ray Tracing
I. INTRODUCTION
From the geometric viewpoint, the alignment of optical data and synthetic aperture radar (SAR) data, captured by airborne or spaceborne sensors, is hampered by fundamental differences of the underlying imaging concepts. In the optical domain portions of reflected sun light are collected in an image plane, often with an orthographic projection along the flight track and a perspective projection in across-track direction (pushbroom concept). It is preferable that optical data is captured from near-nadir perspectives in order to balance image distortion and localization accuracy, and to minimize occultation. However, optical data may also be acquired from off-nadir perspectives for 3-D reconstruction tasks or for sup-porting spontaneous image acquisition (e.g. in the context of natural disasters). Synthetic aperture radar images are obtained from radar signals (with a power distribution over a known chirp signal) which are emitted from an antenna, the signal power backscatter from ground targets is then collected along a synthetic aperture. In a post-processing step, the spatial
Manuscript received Month, Day, Year: revised Month, Day, Year. S. Auer is with the Remote Sensing Technology Institute (IMF), Ger-man Aerospace Center (DLR), Oberpfaffenhofen, GerGer-many, e-mail: [email protected]
I. Hornig is with TerraLoupe, Munich, Germany, e-mail: [email protected]
M. Schmitt is with the Professorship of Signal Processing in Earth Obser-vation (SiPEO), Technical University of Munich (TUM), Munich, Germany, e-mail: [email protected]
P. Reinartz is with the Remote Sensing Technology Institute (IMF), German Aerospace Center (DLR), Oberpfaffenhofen, Germany, e-mail: [email protected]
resolution of the final SAR image is obtained by matched-filtering along both image axes (azimuth, range) and the assumption of a target nature (direct signal response, stationary target during the data acquisition). The principle of strong off-nadir viewing perspectives (typically between 25◦ and 50◦) is characteristic for SAR systems in order to provide the necessary sensibility for target distance differences and to identify the direction of the signal response across the line-of-flight (left or right).
As a result of the imaging concepts, the off-nadir perspec-tives of the sensors lead to different and contrary distortion effects in the image data, especially for 3-D objects like buildings or trees (see e.g. [1] or [2]). Considering this fundamental difference in imaging, it is clear that a straight-forward overlay of high-resolution optical data and SAR data is only possible for scenes without elevated objects. However, typical scenes of interest are often comprised of man-made structures, vegetation, and a variation of the ground level. On the one hand, this prohibits the application of classical, pixel-based image fusion methods, which are well-established for remote sensing imagery with similar characteristics [3]. On the other hand, the matching of corresponding image parts, which is often needed for image registration or stereogrammetry, becomes a non-trivial task [4], [5]. By proposing the multi-sensor simulation framework SimGeoI (simulator of geo-referenced interpretation layers), this paper provides the basis for the joint exploitation of SAR and optical data for objects of interest. In more detail, SimGeoI considers the geometric projection effects pertinent to both sensors, which allows for the extraction of corresponding image parts in optical and SAR images despite the difference of sensor type and perspective. Based on that, the image parts aligned through SimGeoI can be used in subsequent data fusion steps, which focus on an object-based (where objects refer to, e.g. individual building facades) rather than a pixel-based analysis. This actual fusion step, however, is not within the scope of this paper.
The paper is organized as follows. In Section II, the ba-sic structure and functionality of the simulation environment SimGeoI is introduced. In Section III, the methodology of GeoRayOpt for the simulation of optical data is introduced. Section IV compares core elements of GeoRayOpt and Geo-RaySAR and emphasizes the main differences between the two types of simulations. Experimental results of the application of SimGeoI are shown in Section V, followed by discussion on opportunities and limitations in Section VI. Finally, con-clusions are drawn in Section VII.
II. THESIMULATIONFRAMEWORKSIMGEOI
A. Related work
SimGeoI is designed as a framework to relate high-resolution satellite images of SAR and optical sensors se-mantically via 3-D space, exploiting geometric a priori scene knowledge. It can thus be a useful tool in solving the alignment problem which is a necessary prerequesite for subsequent SAR-optical data fusion [6]. Related work in the field of remote sensing is mostly concerned with connecting 3-D geometry with either optical or SAR image data. As examples for the first group, changes between digital elevation data and optical satellite data are identified in [7]. Classification methods based on the joint analysis of laserscanning point clouds and optical data are reported in [8]. The impact of scene geometry and sensor perspective has to be accounted for in the field of pan-sharpening where multi-sensor fusion is usually enabled by ortho-correction [9]. In [10], representing the second group, prominent SAR image signatures (persistent scatterers) are localized at buildings and mapped into slant view optical images for subsequent refinement steps. In the ”SARptical” framework developed by Wang et al. [11], [12], a 3-D point cloud, which is generated by co-registration of point clouds derived from SAR tomography and optical dense stereo matching, is used to link SAR and optical image data. An example for pioneering work in the field of simulation-based change detection from SAR and optical remote sensing data is [13]. The authors use optical data for the manual extraction of building parameters. The resulting 3-D model is thereafter inserted into an iterative SAR image simulation procedure in order to identify building changes. A fully automated process for scene modeling and simulation is not yet proposed. Another example is presented by Ali et al., who integrate 3-D city models into the analysis of changes based on SAR images, using optical images for the validation [14]. The impact of geometric projection effects due to object height, however, is not accounted for. In [15], features extracted from optical images, SAR images and LiDAR data are jointly exploited for scene classification. The analysis is based on co-registered data sets. Again, the impact of object height in the context of optical and SAR imaging (distance dependence) is neglected. In comparison to the work above, SimGeoI aims at auto-matically defining the link between SAR images and optical images, while retaining the original image data. In this context, it can use digital surface models (DSM) from arbitrary sources and even GIS data in the form of CityGML information. For solving the problem, SimGeoI provides interpretation layers to relate complementary parts of the image data on the object level. In that regard, the geometry of the input DSM constitutes the connecting element between the different image data. Multi-sensor image fusion tasks are mostly restricted to rather coarse resolutions and rural or semi-urban scenes (e.g. [16], [17]). SimGeoI aims at providing the necessary basis for exploiting individual scene objects in urban areas with high-resolution optical and SAR data.
The first steps towards the SimGeoI framework were carried out in a case study aiming to analyze the impact of different ac-quisition concepts of SAR and optical images [18]. The study
was restricted to the special case of opposed sensor viewing directions where the object shape matches in both images. An automated simulation environment for the interpretation of SAR imagery – named GeoRaySAR – was introduced in [19]. Similar to SimGeoI, it uses a manually pre-filtered DSM (based on LiDAR data) and focuses on relating different SAR image acquisitions in the context of urban change detection. Based on GeoRaySAR, first methods for object-related change detection are presented in [20].
The work presented in this paper extends the simulation idea of GeoRaySAR in several aspects and introduces the resulting generalized processor SimGeoI. It contributes to the open directions indicated above, i.e. automated alignment of optical and SAR images in their original geometry, consideration of sensor-specific projections and image semantics, and mini-mization of input data for the support of realistic scenarios. Thus, SimGeoI provides an important part of a complete data fusion pipeline: after the SimGeoI-based alignment of corresponding image parts, they can be further analyzed in order to retrieve results on object-level.
B. Basics on SimGeoI
In essence, SimGeoI refers to a framework containing two elements: GeoRaySAR [21], which enables to simulate interpretation layers for SAR images, and GeoRayOpt, a newly developed component for the simulation of interpretation layers for optical data. The type of simulation is triggered by the input to the processing chain. The first input is the image meta file which is related to a geo-referenced optical image or SAR image with UTM coordinates. It contains the necessary information for defining the simulation settings (sensor perspective, image properties, scene average height) and is interpreted automatically. As second input a DSM in UTM coordinates describes the geometric prior knowledge for the scene. It is used to generate the scene model which refers to the steps filtering, DSM decomposition into normalized DSM and DTM, triangulation of the surface, and model translation into the language of a ray tracer. The simulated images are geocoded automatically based on the DSM coordinates and the extracted image meta information. The combinations of simulated images for the DSM, normalized DSM and DTM model lead to the final output of SimGeoI: dedicated interpretation layers for optical and SAR images in the form of binary masks, which enable to extract object-related parts from the satellite images (captured e.g. with different sensor type, perspective, and spatial resolution).
An adapted version of POV-Ray [22], an open source ray tracer, is the core element of the simulator, providing either optical images (rendered image) or output information for the simulation of SAR images (azimuth, range, and elevation coordinates of signal, signal strength, signal reflection level) at the same time. SimGeoI follows the same procedure for optical and SAR data: interpretation of image meta-data, scene model definition, calculation of simulation parameters, image simulation, geocoding, and generation of binary interpretation layers. Core elements vary in order to account for the differ-ences between optical and SAR imaging (see Sections III for GeoRayOpt and Section IV for GeoRaySAR).
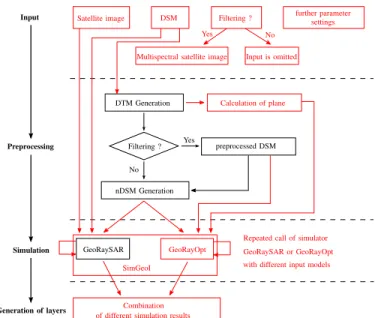
An overview of the processing steps is shown in Fig. 1. Parts addressed in detail in this paper are marked in red, whereas the pre-processing of DSMs is described in [23] and basic GeoRaySAR in [19]. Compared to [19], the simulation environment has been generalized in two ways: 1) scene inter-pretation is now possible with satellite DSMs instead of pre-filtered DSMs from airborne sensors, 2) scene interpretation is now extended to optical images (GeoRayOpt), complementing the basis for data alignment.
The preparation of input models for SimGeoI is realized in several steps:
• DTM (necessary input 1): A digital terrain model is gen-erated from the input DSM using the method described in [24] (parameters: scanline extent, height threshold, slope threshold; see case study in Section V; note: alternative algorithms are possible, e.g. [25] or [26]). The DTM is used for defining a horizontal plane describing the spatial extent of ground surfaces in the scene (required for the combination of simulation results in the context of interpretation layers).
• DSM (input 2): A DSM pre-processing step is activated [23]. Given a multi-spectral orthorectified image, trees are identified and removed from the DSM model based on the Normalized Difference Vegetation Index (NDVI) and a height threshold on the difference between the current DSM and the DTM (note: flat vegetated surfaces remain part of the ground surface). Median filtering accomplishes the final DSM by smoothing of the DSM surface. For the case studies presented in the paper, the ortho-image is derived from the optical data which was used for generating the DSM.
• nDSM (input 3): The nDSM is derived from the
pre-filtered DSM based on a height threshold (height differ-ence>0.1 m between pre-filtered DSM and DTM). It is expected to represent mostly building parts of sufficient height and scale. In contrast, man-made objects with little elevation (vehicles, poles) are suppressed during DTM generation, by the application of an appropriate height threshold, e.g. 5 m, and during DSM filtering. Note that the nDSM obtains the original heights of the DSM.
• Building models (derived from input 3): For the second interpretation level, focused on building blocks, segments of sufficient extent in the nDSM are identified as building objects based on a minimum size threshold for connected segments (see [19]).
SimGeoI calls the simulation chain for the DSM, the nDSM and the DTM, respectively. The resulting simulated images are used to generate binary images and combined to interpretation layers (see Section III-C for optical images and Section II for SAR images). The final goal is to separate foreground from background in optical and SAR satellite images in order to extract image parts of interest. Extended scenes are processed with overlapping tiles [23], where the sensor perspective is interpolated from the meta data for each tile.
The following parameters are extracted / calculated from the meta file of the image and used while conducting the simulation process (equal for optical and SAR images):
DSM
Input Filtering ?
Multispectral satellite image Input is omitted
Preprocessing
Simulation
Generation of layers
DTM Generation
Filtering ? Yes preprocessed DSM
Yes No nDSM Generation No GeoRayOpt Combination further parameter Calculation of plane
Repeated call of simulator settings Satellite image
of different simulation results
GeoRaySAR or GeoRayOpt
GeoRaySAR
with different input models SimGeoI
Fig. 1: Automated simulation environment (red: developed and implemented methodology; black: integrated existing work).
• the local signal incidence angleθ (interpolated based on the known values at image corners)
• the reference height Href related to geo-coding of the
data
• the pixel spacingξSE in east direction andξSN in north
direction (context: UTM coordinate system)
In case of GeoRayOpt, three additional parameters are extracted: the angle of view β (line of sight of the optical sensor projected on the ground plane) as well as the azimuth angleαsun and elevation angleεsun of the sun during image
acquisition. Parameter β is derived from exploiting the Ra-tional Polynomial Coefficients (RPCs) attached to the image, which define the camera model of the optical sensor [27]. In case of GeoRaySAR, only the sensor heading angle γ is required as additional parameter.
The second input to the processor is geometric prior knowl-edge of the scene of interest, which is described by surface models (DSM, nDSM, DTM). The models are represented by raster data in the UTM coordinate system, with pixel values describing height (see Fig. 2). Besides height values, the following information is required for the input model (extracted or calculated from the meta file of the DSM):
• the pixel spacingξLE in east direction andξLN in north
direction
• the model lengthLin east direction and widthW in north
direction with
L=Nc·ξLE W =Nr·ξLN
(1) where Nc is the number of columns and Nr the number
of rows of the DSM. Given the maximum and minimum height, the middle heightHmid and DSM height extent H is
calculated (see Fig. 2):
Hmid=
(Hmax+Hmin)
H=Hmax−Hmin (3)
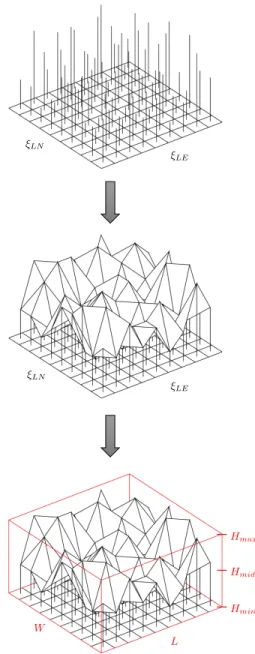
The surface model (either DSM, nDSM) is translated into the POV-Ray format using standard Delaunay triangulation (see Fig. 2 as an example for the DSM). In order to mark the scene coverage the DTM is represented by a plane positioned at the median height of the scene (alternative: triangulation of true DTM). Thereafter, the processing steps are equal for each input model (see below).
L W H ξLE ξLE ξLN ξLN Hmin Hmid Hmax
Fig. 2: 3-D model generation from the DSM (2.5D raster im-age with height values triangulated to surface); red: bounding box of the DSM, describing the DSM extent.
III. GEORAYOPT-CORE ELEMENTS
This section summarizes peculiarities of SimGeoI related to simulations in the context of optical images. The main
differences with respect to GeoRaySAR (see Section IV) refer to the following steps: parameter calculation for ray tracing, image generation, geo-coding, and the generation of interpretation layers.
A. Calculation of Parameters for Ray Tracing
For finalizing the model scene definition the following information is required (note: x and z define the horizontal position,y-axis refers to object height in POV-Ray):
1) Scene center: the center of the surface model bounding box (see Fig. 2) is calculated by
* Xcp= xcp ycp zcp = L−ξLE 2 Hmid W−ξLN 2 (4)
2) Camera position: an orthographic projection is used and the position is calculated by
* Xca= xca yca zca = xcp ycp+tan (θ)D zcp+D (5)
with D being the horizontal distance between the sensor position and the scene center. As an orthographic projection is used, the parameterD can be an arbitrary positive number.
3) Signal source: the sun is represented by a signal source emitting parallel light at the position
* Xli= xli yli zli = xcp+ sin (α0sun)·D ycp+ tan (εsun)·D zcp+ cos (α0sun)·D (6) withα0 sun=αsun−β.
4) Image size: the number of image columns and rows (rounded to the next integer) is defined by
Nc,img= Limg ξSE Nr,img = Wimg ξSN ·cosθ (7)
where Nc,img and Nr,img are the number of image
columns and rows. Parameters Limg and Wimg define
the length and width of the DSM bounding box in the image plane (unit: meter), considering the perspective of the camera with respect to the DSM.
B. Geocoding of Simulated Image
The ray tracing procedure is conducted in a local image coordinate system which results in a rendered image without UTM coordinates. Thus, for superimposing the image onto the optical image, geocoding is necessary. This includes two main steps which are explained next.
C2 C2 C1 C1 W L Rotation Lrot Wrot Y(N orth) X(East) Y(N orth) X(East) Cutting
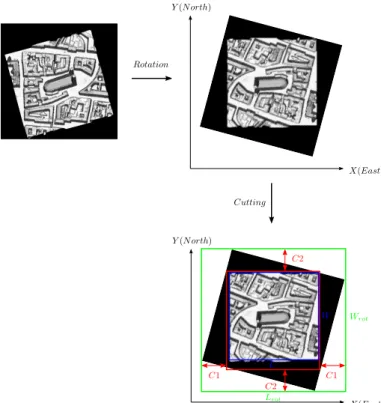
Fig. 3: Geocoding for DSM example based on the model geometry; starting point: rendered optical image (image coor-dinates), black color marks image parts without DSM response during ray tracing; green frame: rotated image in north-east orientation (no absolute coordinates, yet); blue: area covered by DSM and its UTM coordinates; red: cropped image in north-east orientation with UTM coordinates.
1) Exploitation of DSM information: The main principle of the first step of geocoding is visualized in Fig. 3, showing rotations and cropping for an example image rendered by the ray tracer. Firstly, for obtaining an image orientation in the north-easterly direction, the rendered image is rotated by ρ= 180◦−β−360◦(ifρ >0◦: anti-clockwise rotation; ifρ <0◦: clockwise rotation). Thereafter, the lengthLrot and the width Wrot of the rotated image are calculated by
Lrot =||M·cos (δ) +L|| Wrot =||M·sin (δ) +W||
(8)
where M =H·tan (θ) is the displacement of points on the top level of the DSM bounding box in the image, depending on the bounding box heightH and the signal incidence angle
θ (maximum impact of DSM heights). The direction of the displacement equals the sensor’s line-of-sight projected in the image plane. Note that the displacement is zero if the camera’s line-of-sight equals the nadir direction with respect to the DSM bounding box (top view). Parameterδdefines the angle between the UTM east axis and the line of sight of the optical sensor (anti-clockwise). It is calculated as
δ=
(
90◦−β if β∈[0◦,90◦]
360◦−β+ 90◦ if β∈]90◦,360◦[ (9)
For relating the simulated image with the UTM coordinates of the input model (see blue rectangle in Fig. 3), the image frame marked in green is reduced by intervalsC1in horizontal andC2in vertical direction, i.e.
C1 =||W ·cos (δ)·sin (δ)||
C2 =||L·cos (δ)·sin (δ)|| (10)
resulting in the final image (marked in red in Fig. 3). The top-left pixel of the image now corresponds to the UTM coordinates of the top-left DSM pixel (Xmodel,Ymodel). Based
on that, coordinates can be assigned to all other image pixels.
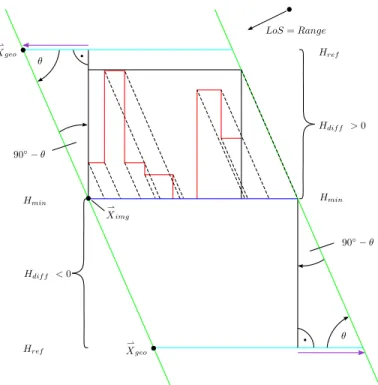
2) Consideration of different projection planes: The second step of geocoding accounts for the projection planes of the satellite image and the simulated image (see Fig. 4). The height used for simulation is the minimum model heightHminwhich
is different to the projection heightHref of the satellite image.
The height difference leads to a constant shift between the two images which has to be compensated for. After calculating the relative shift, the coordinates of the simulated image are adapted using
Xgeo=Ximg−(Href −Hmin)·tan (θ)·cos (α) Ygeo=Yimg+ (Href −Hmin)·tan (θ)·sin (α)
(11) withα=β+90◦defining the angle of the horizontal image axis with respect to the UTM north direction (clockwise; note: horizontal image axis is always orthogonal to the sensor’s line-of-sight).
C. Scene interpretation
The scene interpretation is based on combining simulation results from the different elevation models (DSM, DTM, nDSM) and different illumination settings. Scene objects rep-resented by the geometric model are assigned with strong dif-fuse signal reflection to ensure their visibility (specular reflec-tions and signal multiple reflecreflec-tions are suppressed), whereas scene background without representation by the model leads to black pixels in the simulated image. The simulations with DSMs, nDSMs, and DTMs as separate input models and different illumination settings (option L1: signal direction = camera line of sight; option L2: signal direction = direction of sun light) yield different gray value images. The translation of pixel amplitudes (values > 0 set to 1, values 0 remain) leads to binary images which are combined to provide the interpretation layers.
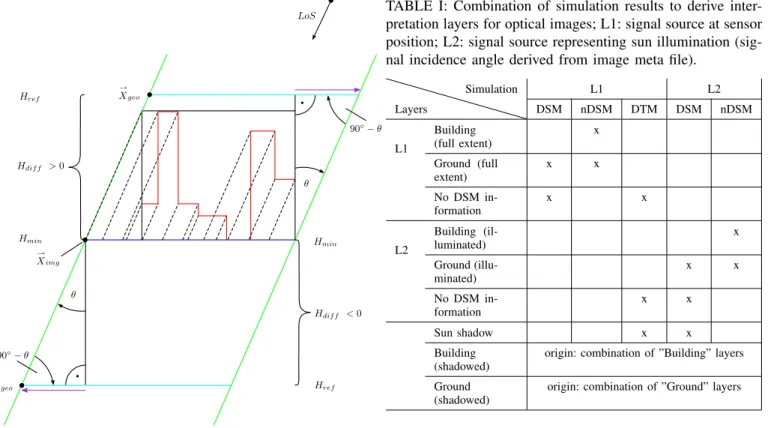
Table I summarizes the interpretation layers for optical images and the underlying simulation combinations. Defining the signal source and optical camera at the same position and simulating the optical image for the nDSM provides the extent of buildings in the scene. Using the same signal source and combining the simulations of the DSM (full scene response) and the nDSM (building response), the extent of ground parts is identified. Combining the simulations of the DSM (full scene response) and the DTM (terrain response) areas without object information can be located. Using the signal source for representing sun light (information derived from the image
LoS * Xgeo Href Hmin * Ximg Hdif f >0 θ 90◦−θ Hmin Href Hdif f <0 θ 90◦−θ * Xgeo
Fig. 4: Geocoding: impact of different projection planes for optical simulation. The coverage of the image plane is marked with green lines. The red lines represent the DSM geometry whose simulated optical image is projected onto the plane marked in blue (at minimum height of the DSM). The cyan line indicates the extent of the optical satellite image on its projection plane. The shift (in UTM coordinates) to be compensated is marked by the purple arrow.
meta file) the simulation with the nDSM provides the extent of illuminated building parts. Combining the simulation of the DSM (illuminated model parts) with the simulation of the nDSN (illuminated building parts) provides the extent of illuminated ground parts. The extent of sun shadow is obtained by combining the simulation of the DSM (full extent of shadow) with the simulation of the DTM (represented by plane→image without shadow). Shadowed building parts are identified by combining the layers ”Building (full extent)” and ”Building (illuminated)”. Shadowed ground parts are obtained by combining the layers ”Ground (full extent)” and ”Ground (illuminated)”.
IV. GEORAYSAR -CORE ELEMENTS
This section summarizes the core elements related to Geo-RaySAR considering the characteristics of SAR imaging. As for scene interpretation, Table II summarized the simulated layers (see [19] for details).
TABLE I: Combination of simulation results to derive inter-pretation layers for optical images; L1: signal source at sensor position; L2: signal source representing sun illumination (sig-nal incidence angle derived from image meta file).
Layers Simulation L1 L2 DSM nDSM DTM DSM nDSM L1 Building (full extent) x Ground (full extent) x x No DSM in-formation x x L2 Building (il-luminated) x Ground (illu-minated) x x No DSM in-formation x x Sun shadow x x Building (shadowed)
origin: combination of ”Building” layers Ground
(shadowed)
origin: combination of ”Ground” layers
A. Calculation of Image Size
The size of the simulated SAR image is given by
Nc,img= Limg ξSE Nr,img = Wimg ξSN·sinθ (12)
where Nc,img and Nr,img are the number of columns and
rows of the image. Parameters Limg and Wimg define the
azimuth extent and range extent of the DSM bounding box in the SAR image plane, considering the perspective of the SAR sensor with respect to the DSM. The parametersξSEandξSN
represent the SAR image pixel spacing values in easterly and northerly direction.
B. Generation of SAR Images
In the case of GeoRaySAR, depth information derived from ray tracing is exploited. The maximum signal reflection level is limited to 2 in order to focus on direct signal response and signal double reflections in the model scene (higher order reflection levels are possible but not reasonable due to the limited level of detail of the DSM). The SAR image layers are generated based on the ray tracing output: azimuth and range coordinates, signal strength, and signal reflection level. To this end, a regular image grid is defined in azimuth and ground range where signal contributions are collected for each pixel [28]. The necessary parameters for simulation are derived from the image meta file.
C. Geocoding of Simulated SAR Image
The procedure of geocoding is the same as for the optical image, except for the differences summarized below.
For orienting the simulated SAR image in north-east direc-tion, it is rotated byρ= 90◦−γ+ 360◦. In caseρ >0◦, the rotation is applied anti-clockwise, otherwise clockwise. Points on top of the DSM bounding box are displaced with
M =H·tan (90◦−θ) (13)
The parameterδ, defining the angle between the UTM east axis and the line of sight of the SAR sensor (anti-clockwise), is
δ= 360◦−γ (14)
Finally, the relative shift of the simulated image, necessary due to different projection planes related to the simulated image and the real SAR image (see Fig. 5), is calculated as
Xgeo=Ximg+ (Href−Hmin)·tan (90◦−θ)·cos (α)
Ygeo=Yimg−(Href −Hmin)·tan (90◦−θ)·sin (α)
(15)
withα=γdefining the angle of the horizontal image axis with respect to the UTM north direction. Equaling α to γ
corresponds to a right-looking SAR sensor (orthogonal to the line-of-flight), where the image azimuth axis corresponds to the line-of-flight (heading) of the sensor. The argument of the tangent considers the projection of elevated objects towards the SAR sensor.
TABLE II: Combination of simulation results to derive inter-pretation layers for SAR images; L1: signal source represent-ing the antenna of the SAR sensor.
Layers Simulation L1 DSM nDSM DTM L1 Building lay-over x Ground x No DSM in-formation x x Signal dou-ble reflection x Shadow x x
V. CASE STUDY ONSCENEINTERPRETATION The basic task of SimGeoI in the case study is to identify corresponding image parts of scene contents despite the differ-ence of sensor type (imaging concept, signal wavelength) and sensor perspective. For both sensors, simulation parameters are automatically derived from interpreting the corresponding image meta files. The parameters for DTM generation (scan-line length: 121 pixels, height threshold: 5 m, slope threshold: 30◦) and DSM pre-processing [23] are kept stable.
LoS=Range * Xgeo Href Hmin * Ximg Hdif f >0 θ 90◦−θ 90◦−θ θ * Xgeo Href Hdif f <0 Hmin
Fig. 5: Geocoding: impact of different projection planes for SAR simulation. The coverage of the image plane is marked with green lines. The red lines represent the DSM geometry whose simulated SAR image is projected onto the plane marked in blue (at minimum height of the DSM). The cyan line indicates the extent of the SAR image on its projection plane. The shift (in UTM coordinates) to be compensated is marked by the purple arrow.
A. Test Data
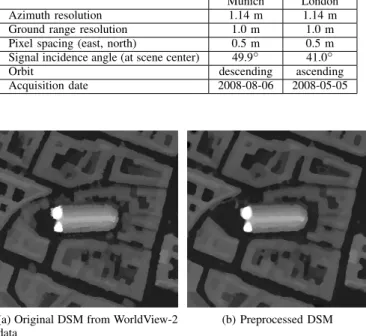
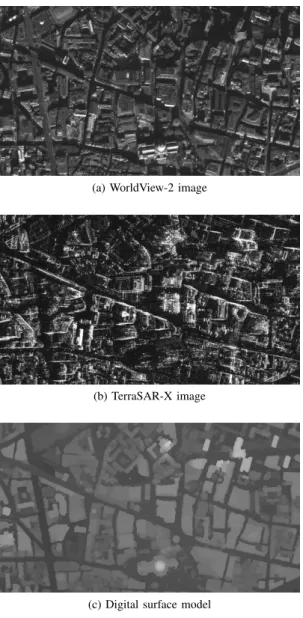
The functionality of the SimGeoI framework is exemplified for two urban test sites (Munich and London). The Munich test site covers a small part of the city center including the Frauenkirche (church) and non-regular building blocks in its surrounding. Parts of the scene are covered by trees and roads. A WorldView-2 data take (see, e.g., [29] for information on the sensor) is used to provide two sorts of input information: a panchromatic standard product (see Fig. 7a and data properties on the left of Table III) and a multispectral orthophoto (see Fig. 7b; spatial resolution: 0.5 m). The latter is generated based on a DSM which has been reconstructed from four WorldView-2 images (see Fig. 6a) using a semi-global matching method (SGM) [30]. The horizontal and vertical resolution of the WorldView-2-based DSM is 0.5 m and 1 m, respectively. Figure 6 shows the impact of DSM pre-processing (removal of trees, smoothing of building outlines). A spotlight TerraSAR-X image (see [31] for sensor characteristics) concludes the Munich data set (see data properties on the left of Table IV). The second test site covers an extended urban scene in London which is characterized by varying building types and densities (see Fig. 14). It has been selected as the site variability imposes challenges on the DSM pre-processing. Moreover, it includes tall buildings where characteristic ge-ometric projection effects of the sensors are prominent. As above, a high-resolution DSM (source: World-View-2 images;
method: SGM; resolution: 0.5 m in horizontal and 1 m in vertical direction) is combined with a WorldView-2 Pan image (see data properties on the right of Table III)), an orthorectified multispectral image (spatial resolution: 0.5 m) and a TerraSAR-X spotlight image (see data properties on the right of Table IV). The pre-processing of the DSM is conducted the same way as for the Munich scene.
TABLE III: WorldView-2 data properties for test sites (geo-referenced, level 2A).
Munich London Pixel spacing (east, north) 0.5 m 0.5 m Off-nadir angle (at scene center) 14.5◦ 10.8◦ Scene azimuth angle 189.0◦ 208.7◦ Sun azimuth angle 154.7◦ 177.2◦ Sun elevation angle 62.1◦ 27.6◦ Acquisition date 2010-07-12 2011-10-22
TABLE IV: TerraSAR-X data properties for test sites (geo-referenced, level 1B).
Munich London Azimuth resolution 1.14 m 1.14 m Ground range resolution 1.0 m 1.0 m Pixel spacing (east, north) 0.5 m 0.5 m Signal incidence angle (at scene center) 49.9◦ 41.0◦ Orbit descending ascending Acquisition date 2008-08-06 2008-05-05
(a) Original DSM from WorldView-2 data
(b) Preprocessed DSM
Fig. 6: Comparison of original and preprocessed DSM (re-moved trees, smoothed building outlines).
B. Interpretation of Munich scene
SimGeoI follows the steps: simulation, thresholding of the simulated images, definition of interpretation layers, and image part extraction. Exemplifying the first step, Fig. 8 shows simulated optical images for the Munich scene (based on the nDSM and the image meta file of the WorldView-2 image). The full extent of scene objects is derived by defining the signal source at the position of the camera (see Fig. 8a). Except for the region without nDSM coverage, no pixel amplitudes are zero. Darker pixels are related to steep surfaces, where the reflection model (equal to the one introduced in [32]) yields weak signal responses (small angle between ray and surface model). The impact of the DSM height resolution is
(a) Panchromatic WorldView-2 satel-lite image
(b) Multispectral WorldView-2 satel-lite image (ortho photo)
Fig. 7: Example: Input data for optical simulation using SimGeoI.
obvious as the limited height accuracy of 1 m leads to height steps. Ground parts remain dark in the images as they are not geometrically represented by the nDSM (no ray-surface intersections). Adapting the signal source to sun illumination leads to an image marking only illuminated building parts (Fig. 8a). As an example, thresholding and combining both images leads to three interpretation layers (building - full extent, building - illuminated, building - shadowed; compare Table I).
(a) Case 1: light source at camera position
(b) Case 2: light source at sun posi-tion
Fig. 8: Simulation of optical images for scene nDSM. Fig. 9 shows simulated SAR images based on the TerraSAR-X image meta file. The image of single reflections (Fig. 9a) indicates the impact of the distance-dependent imaging in range direction. Elevated building parts are mapped towards the SAR sensor due to smaller range values (image acquisition on a descending orbit → projection towards near east). The image of signal double reflections (Fig. 9b) marks the position of corner lines which represent double and triple reflections at facades [33].
Figs. 10 and 11 color-code the binary interpretation layers for the optical and SAR perspective, respectively. Both the impact of sensor perspective and imaging concept are distin-guishable. The strong off-nadir view of the SAR-sensor leads to extended image parts related to facades and shadow. In contrast, the optical layers emphasize information for roof parts and ground, which is partly interrupted by sun shadow.
(a) Direct signal response
(b) Signal double reflection
Fig. 9: Simulation of SAR images for scene DSM.
from the satellite images (see collected examples in Figs. 12 and 13). Besides the individual interpretability of the sensor data, it is seen that building and ground parts of the WorldView-2 image can be linked to the TerraSAR-X image, even if the data is captured from a different perspective and with different imaging concepts. Besides, sensor-specific shadow types can be marked (sun shadow, sensor shadow). The impact of sun shadow in the optical image is prominent for high buildings, e.g. both towers of the Frauenkirche in the scene center.
C. Interpretation of London scene
Fig. 15 presents a composite of selected interpretation layers for the London test site, as above focused on buildings, ground, shadow areas, and vegetation. Illuminated ground parts and shadowing effects indicate the difference between the lines-of-sight of both sensors. The different appearance of individual building blocks is caused by the geometric distortion effects pertinent to the sensors. It is clearly seen that creating a classic straight-forward overlay of the optical and the SAR image would lead to mis-matches at almost all parts of the scene. Instead, SimGeoI allows for the semantic alignment of corre-sponding image parts from both sensor images using simulated
Fig. 10: Interpretation layers for WorldView-2 image; blue: shadow; green: ground (illuminated); red: building (illumi-nated); magenta: trees; gray: no coverage by DSM.
Fig. 11: Interpretation layers for TerraSAR-X image; blue: shadow; green: ground; red: building (layover+foreshortening); magenta: trees; cyan: signal double reflection (mostly overlayed with building layer); gray: no coverage by DSM.
imaging geometries and a priori known 3D information of the ground scene as connecting elements.
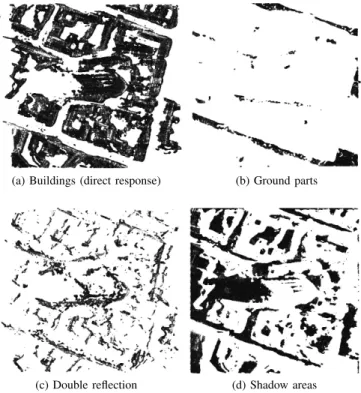
A selection of extracted parts from the WorldView-2 and TerraSAR-X images is shown in Fig. 16, focusing on building pixels (top), ground pixels (center) and shadow areas (bottom). The extraction is bound to the full scene as the input model to SimGeoI is the full DSM. Hence, a next step may continue with deriving representative measures for buildings, ground, and shadow parts in the scene. The temporal difference be-tween the WorldView-2 image (DSM data have same date) and the TerraSAR-X image opens the door for object monitoring (see [20] in the context of SAR image pairs). To support this, interpretation has to be continued for individual buildings.
Following the concept in [19] for GeoRaySAR, building segments are extracted from the scene nDSM and assigned with individual IDs (criterion: segments with more than 2000 pixels; result: 47 building models). Thereafter, SimGeoI is
(a) Building parts (full extent) (b) Building parts (illuminated by sun)
(c) Ground parts (full extent) (d) Ground parts (illuminated by sun)
(e) Sun shadow (full extent) (f) Shadowed building parts Fig. 12: Extracted image parts from WorldView-2 image using interpretation layers. Background marked by white color.
used to generate interpretation layers for each building (optic: building full extent, building illuminated, shadowed building parts; SAR: building layover, layover + double reflection, double reflection, shadow). As an example, Fig. 17 compares the ”building full extent” layer for the optic image with the ”building layover” layer for the SAR image for selected buildings. On the one hand, it can be seen that the full building object is extracted from the sensor data due to the considera-tion of the geometric projecconsidera-tion effects. On the other hand, the examples indicate the opportunity to monitor buildings (ear-marked by input model IDs) with incoming multi-modal satellite data over time. In this context, the analysis can be focused on the appearance of building structures as scene background is removed from the start.
The results for building 29 reveal room for improvement as
(a) Buildings (direct response) (b) Ground parts
(c) Double reflection (d) Shadow areas Fig. 13: Extracted image parts from TerraSAR-X image using interpretation layers. Background marked by white color.
two building blocks are mistakenly connected in the nDSM. Hence, integrating more sophisticated methods for building model extraction from the nDSM is an interesting task for the future.
D. Comparison
The following aspects are of interest when comparing inter-pretation layers for the WorldView-2 image and the TerraSAR-X image:
• Complementarity: Parts of both sensor images are re-lated based on the geometric description of objects. The alignment of the data is not hampered by the imaging concept (which is modeled by SimGeoI), varying sensor perspectives and resolutions (considered by the interpre-tation of the image meta files). For the scene at hand, the gain of aligning the WorldView-2 image and TerraSAR-X image is obvious: the optical image, acquired in near-nadir direction, provides multi-spectral information about the top of objects as well as for most ground parts; the SAR image is sensible for object heights and contributes image signatures for facades.
• Shadow: In case of SAR simulations, shadow relates to
image areas without direct signal response (note: multi-reflections may be located in that area as exemplified in [34]). In the context of optical simulations, the shadow layer marks areas with sun shadow.
• DSMs: The applicability of WorldView-2 DSM for scene interpretation is encouraging for realistic scenarios, e.g. near-real time change detection tasks, as the amount of necessary input data is reduced compared to the results presented in [19] relying on LiDAR point clouds.
(a) WorldView-2 image
(b) TerraSAR-X image
(c) Digital surface model Fig. 14: London data set.
Moreover, there is no time shift between the DSM and the optical data, which serves as optimal basis in the context of change detection applications.
• Localization: The interpretation layers are provided in UTM coordinates. Importantly, the localization accuracy of the WorldView-2-based DSM is sufficient to generate layers for the TerraSAR-X image, i.e., no additional shift correction is necessary.
• Noise: The ”optical” layers appear smoother and less
noisy than the ”SAR” layers. This is related to the fact that the optical images are generated based on regular sampling (constant ray density in the image plane) and fo-cused on direct signal response. In case of SAR imaging, simulated signal contributions are irregularly distributed in distance, locally compressed (layover, foreshortening), and interrupted due to occlusions (shadow). Moreover, signal double reflections between DSM parts are consid-ered as additional source of information, which partly leads to ”ghost” image signatures without physically existing counterpart in reality.
(a) WorldView-2: blue: shadow; green: ground (illuminated); red: building (illuminated); magenta: trees; gray: no coverage by DSM.
(b) TerraSAR-X: blue: shadow; green: ground; red: building (lay-over+foreshortening); magenta: trees; cyan: signal double reflection (mostly overlayed with building layer); gray: no coverage by DSM.
Fig. 15: Interpretation layers for London test site.
VI. DISCUSSION
The experiments shown in Section V confirm the potential of the SimGeoI environment for an object-related alignment or comparison of high-resolution SAR and optical satellite images. The following points, however, need further consid-eration.
A. Comments on the methodology
It is important to note that the simulation components in SimGeoI, GeoRaySAR and GeoRayOpt, are not designed to simulate realistic remote sensing images. By purely concen-trating on the geometric knowledge of the scene and ignoring radiometric properties, it allows us to incorporate prior knowl-edge into subsequent image processing steps, which enables object-related alignment of high-resolution SAR and optical imagery. Subsequent analysis steps (e.g. related to actual data fusion or change detection) can work with images in their original geometry. The full extent of objects in the image can be exploited, which is of importance for slant view image acquisitions (possible for optical images, standard for SAR images). Ortho-projection is not required any more for joining the data. This is a particularly interesting aspect if the focus of the intended remote sensing analysis lies on vertical structures (e.g. facades), as they are usually removed completely in true ortho-imagery.
(a) WorldView-2: buildings (full extent) (b) TerraSAR-X: buildings
(c) WorldView-2: ground (d) TerraSAR-X: ground
(e) WorldView-2: sun shadow (f) TerraSAR-X: shadow
Fig. 16: London test site: extracted image parts from WorldView-2 and TerraSAR-X images using interpretation layers. Background with no value marked by white color.
Since the core of the simulation routines is built around ray tracing, no specific geometric projections are involved, i.e. it is possible to steer the spatial sampling of the simulation results based on prior knowledge extracted from the image meta data, which can be used to modify the ray density according to the desired result. Furthermore, SimGeoI enables to process extended scenes by resorting to scene tiling. Thus, the generation of interpretation layers is not bounded by any constraints. On the other hand, the tiling is linked to interpolated values for the point-of-view angle of the sensor, i.e. small discontinuities are derived in the overlapping region of two neighboring tiles.
B. Comments on the input data
Since SimGeoI is designed to incorporate prior knowledge into the object-related interpretation of high-resolution SAR
and optical data by image simulation, its power stands and falls with the quality of the input data. Here, the following remarks have to be made:
• The DSM as core element: The DSM is the combining
el-ement for identification of the object-related image parts, which are subsequently used to establish a connection between the images. The DSM object can represent the full scene (see results for Munich test site), individual objects (see results of London test site), or object parts (see [20] for the application of GeoRaySAR in the context of object-related change detection). While linking strongly different image spaces via 3-D space provides a powerful solution for the otherwise difficult alignment problem, this also comes with a certain disadvantage: The quality of the simulated layers depends on the input DSM. Thus, erroneous DSM models directly propagate
(a) WV-2: building 22 (b) WV-2: building 28 (c) WV-2: building 29 (d) WV-2: building 45
(e) TS-X: building 22 (f) TS-X: building 28 (g) TS-X: building 29 (h) TS-X: building 45
Fig. 17: London test site: extracted image parts from WorldView-2 and TerraSAR-X images for individual building blocks. Optical: building - full extent; SAR: building layover. Background with no value marked by white color.
into errors in the interpretation layers and, hence, the interpretation of the scenes (see Fig. 17g). In that regard, the localization of DSMs derived from optical stereo im-agery, the filtering of raw DSMs, and the decomposition of DSMs into DTMs and nDSMs are specifically prone to errors due to the high variability of building types. Thus, improvements of the methodology are of great value in order to feed SimGeoI with better geometric scene knowledge. This is of particular importance, because the use of more reliable non-spaceborne DSMs, e.g. derived from airborne laserscanning, will usually be prohibited by the associated high planning efforts, and the significant need for man-power, equipment and costs.
• Extendability to GIS data: Besides DSMs, 3-D GIS
models may be used as input data. In [35], an interface to CityGML data [36] has been realized and exemplified, indicating the potential related to the input source.
• Parameter setting: All simulation and transformation pa-rameters are derived directly from interpreting the image meta information. This serves the transferability of the method as no empirical decisions are necessary.
• Differences in time: Temporal differences have to be taken into account in case of combinations of sensor sources (e.g. DSMs from optical satellite data and images from SAR sensor). These do not hamper the simulation-based method which relies on the DSM and the image meta data (not the image content). Therefore, the resulting image interpretation layers can be also used to detect changes in the scene (e.g. newly constructed buildings
at expected ground or shadow parts, removed or partly changed buildings at expected building sites; see [20]).
C. Opportunities
Although this article is mainly meant to introduce the framework SimGeoI for relating SAR and optical remote sensing images via 3-D object space, the authors already want to highlight several potential opportunities that will arise if the framework is used to exploit geometric scene knowledge:
First and foremost, SimGeoI will enable an object-related analysis of VHR optical and SAR images in multi-temporal multi-sensor environments, i.e. in the context of change de-tection or monitoring applications. It will provide a much greater flexibility when it comes to any image-to-image com-parison task. While hitherto mostly single-sensor comcom-parisons (similar-angle SAR-SAR or optical-optical) were possible for high resolutions and complex scenes, SimGeoI allows the comparison of SAR and optical data acquired from arbitrary viewing angles, which is beneficial both for spontaneous change detection tasks (e.g. in the frame of disaster moni-toring) and for continuous monitoring exploiting all available data sources without restriction.
In addition, SimGeoI opens the door for combining the strengths of optical and SAR data in the context of urban surface model generation. While optical imagery provides highly accurate stereo reconstruction capabilities, images fa-miliar to the human perception system, and multi-spectral information, SAR provides excellent localization accuracy,
strong sensitivity to object heights, polarimetric information, and a high stability of signal intensities over time.
Examples for the potential of complementary data fusing are provided in the following:
• Example 1: The limited height sensitivity of dense match-ing usmatch-ing optical data can benefit from the height sensi-tivity of SAR data (either based on the simulated object extent or the interferometric phase). As a pre-step, the image sections related to the object of interest have to be identified.
• Example 2: Persistent scatterer interferometry [37] or SAR tomography [38] provide relative height and de-formation estimates. GeoRaySAR may help to identify appropriate regions for selecting the reference point (note: focus on height reference; no gain w.r.t. phase stability) and to include object-related scene knowledge (geometry via layers and spectral information from optical sensors).
• Example 3: Urgent situations require the analysis of re-mote sensing data in near-real time. Given the coordinates of the scene of interest, sections of pre-event and post-event optical or SAR images can be related to objects and analyzed to identify object changes. In this context, the term object relates to the input 3-D shape, e.g. a city model, a building block or a facade of interest.
Last, but not least, a significant amount of multi-sensor data fusion research lies in the application of machine-learning methods [6]. However, in particular, deep networks require high amounts of training data, which must either be provided by time-consuming and expensive manual labeling, or by ground truth field campaigns. Thus, automated training data generation has become a major challenge in remote sensing research. SimGeoI can help to generate training data automat-ically for basic scene classes.
VII. SUMMARY ANDCONCLUSION
This paper has introduced SimGeoI (Simulator for Geo-coded Images), a simulator for the automated interpretation of optical images and SAR images based on given knowledge on the scene geometry (digital surface model, DSM) and remote sensing imagery (including image meta files). The integrated nature of the simulator has been detailed with focus on the new component GeoRayOpt for optical data, complementing the existing component GeoRaySAR for SAR data.
Inherent to the procedure, optical images and SAR images can be aligned in the context of objects of interest by ex-tracting the corresponding parts from satellite images. The method resolves the impact of geometric distortion effects and provides the basis for the joint exploitation of multi-modal data captured from different perspectives. The method benefits most in case the geometric knowledge is inherent to given image data (in the paper: DSM derived from WorldView-2 data). Then, unnecessary differences in time are avoided and multi-spectral information can be considered when defining the scene model, e.g. for identifying DSM parts representing trees.
Simulation results have been presented for test sites in Munich and London, using a set of WorldView-2 images and a
TerraSAR-X spotlight SAR image, respectively. Based on the results, properties of the method, the role of the input DSM as connecting element and promising research opportunies in the context of SimGeoI have been discussed.
In summary, the potential of SimGeoI for providing a solution to the alignment problem, which is non-trivial for very-high-resolution remote sensing imagery of complex urban scenes, has been demonstrated. By providing a semantically annotated connection between corresponding image parts, which can, e.g., relate to individual buildings, further analysis of the related objects in subsequent data fusion or change detection procedures becomes possible.
Future work will focus on the integration of further sources of scene knowledge and improving the extraction of building models. Furthermore, the impact of DSM quality and input parameters on the accuracy of output layers has to be evaluated in detail. Applications of SimGeoI will concentrate on tasks in the context of city monitoring, change detection and machine learning.
REFERENCES
[1] U. Stilla, “High resolution radar imaging of urban areas,” in Photogram-metric Week, D. Fritsch, Ed. Stuttgart: Wichmann: Heidelberg, 2007, pp. 149–158.
[2] G. Palubinskas, P. Reinartz, and R. Bamler, “Image acquisition geometry analysis for the fusion of optical and radar remote sensing data,”Int. J. Image Data Fusion, vol. 1, no. 3, pp. 271–282, 2010.
[3] C. Pohl and J. V. Genderen, “Multisensor image fusion in remote sensing: concepts, methods and applications,”International Journal of Remote Sensing, vol. 19, no. 5, pp. 823–854, 1998.
[4] S. Suri and P. Reinartz, “Mutual-information-based registration of TerraSAR-X and Ikonos imagery in urban areas,”IEEE Trans. Geosci. Remote Sens., vol. 48, no. 2, pp. 939–949, 2010.
[5] M. Schmitt and X. Zhu, “On the challenges in stereogrammetric fu-sion of SAR and optical imagery for urban areas,” in The Int. Arch. Photogram. Rem. Sens. Spatial. Inform. Sci., vol. 41, no. B7, 2016, pp. 719–722.
[6] ——, “Data fusion and remote sensing – an ever-growing relationship,”
IEEE Geoscience and Remote Sensing Magazine, vol. 4, no. 4, pp. 6–23, 2016.
[7] J. Tian, S. Cui, and P. Reinartz, “Building change detection based on satellite stereo imagery and digital surface models,”IEEE Trans. Geosci. Remote Sens., vol. 52, no. 1, pp. 406–417, 2014.
[8] M. Gerke and J. Xiao, “Fusion of airborne laserscanning point clouds and images for supervised and unsupervised scene classification,”ISPRS J. Photogramm. Remote Sens., vol. 87, pp. 78–92, Jan. 2014. [9] M. Ehlers, S. Klonus, P. J. strand, and P. Rosso, “Multi-sensor image
fusion for pansharpening in remote sensing,”Int. J. Image Data Fusion, vol. 1, no. 1, pp. 25–45, 2010.
[10] L. Schack and U. Soergel, “Matching persistent scatterers to optical oblique images,” in 2015 IEEE Conference on Computer Vision and Pattern Recognition Workshops (CVPRW), June 2015, pp. 52–60. [11] Y. Wang, X. X. Zhu, B. Zeisl, and M. Pollefeys, “Fusing
meter-resolution 4-D InSAR point clouds and optical images for semantic urban infrastructure monitoring,” IEEE Trans. Geosci. Remote Sens., vol. 55, no. 1, pp. 14–26, Jan 2017.
[12] Y. Wang, X. Zhu, S. Montazeri, J. Kang, L. Mou, and M. Schmitt, “Potential of the “SARptical” system,” inProceedings of 10th Interna-tional Workshop on Advances in the Science and Applications of SAR Interferometry and Sentinel-1 InSAR (Fringe 2017), 2017, accepted. [13] D. Brunner, G. Lemoine, and L. Bruzzone, “Earthquake damage
assess-ment of buildings using VHR optical and SAR imagery,”IEEE Trans. Geosci. Remote Sens., vol. 48, no. 5, pp. 2403–2420, may 2010. [14] I. Ali, A. A. Khan, S. Qureshi, M. Umar, D. Haase, and I. Hijazi,A
Hybrid Approach Integrating 3D City Models, Remotely Sensed SAR Data and Interval-Valued Fuzzy Soft Set Based Decision Making for Post Disaster Mapping of Urban Areas. Cham: Springer International Publishing, 2015, pp. 87–105.
[15] B. Bigdeli and P. Pahlavani, “High resolution multisensor fusion of SAR, optical and LiDAR data based on crisp vs. fuzzy and feature vs. decision ensemble systems,”Int. J. Appl. Earth Obs. Geoinf., vol. 52, pp. 126 – 136, 2016.
[16] B. Waske and J. A. Benediktsson, “Fusion of support vector machines for classification of multisensor data,”IEEE Trans. Geosci. Remote Sens., vol. 45, no. 12, pp. 3858–3866, 2007.
[17] B. Waske and S. van der Linden, “Classifying multilevel imagery from SAR and optical sensors by decision fusion,” IEEE Trans. Geosci. Remote Sens., vol. 46, no. 5, pp. 1457–1466, 2008.
[18] J. Tao, G. Palubinskas, P. Reinartz, and S. Auer, “Interpretation of SAR images in urban areas using simulated optical and radar images,” inJoint Urban Remote Sensing Event (JURSE), April 2011, pp. 41–44. [19] J. Tao, S. Auer, G. Palubinskas, P. Reinartz, and R. Bamler, “Automatic
SAR simulation technique for object identification in complex urban scenarios,”IEEE J. Sel. Topics Appl. Earth Observ. in Remote Sens., vol. 7, no. 3, pp. 994–1003, 2014.
[20] J. Tao and S. Auer, “Simulation-based building change detection from multiangle SAR images and digital surface models,”IEEE J. Sel. Topics Appl. Earth Observ. in Remote Sens., vol. 9, no. 8, pp. 3777–3791, Aug 2016.
[21] J. Tao, S. Auer, P. Reinartz, and R. Bamler, “Object-based change detection for individual buildings in SAR images captured with different incidence angles,” inProceedings of IGARSS Conference, 2013. [22] POV-Ray, “POV-Ray,” Persistence of Vision Raytracer Propriety
Lim-ited, www.povray.org [checked: 30.06.2017], 2017.
[23] R. Ilehag, “Exploitation of digital surface models from optical satellites for the identification of buildings in high resolution SAR imagery,” Master’s thesis, KTH, School of Architecture and the Built Environment (ABE), Urban Planning and Environment, Geoinformatics, 2016. [24] R. Perko, H. Raggam, K. Gutjahr, and M. Schardt, “Advanced DTM
generation from very high resolution satellite stereo images,” inISPRS Ann. Photogramm. Remote Sens. Spatial Inf. Sci., vol. II-3/W4, 2015. [25] H. Arefi, P. d’Angelo, H. Mayer, and P. Reinartz, “Iterative approach
for efficient digital terrain model production from CARTOSAT-1 stereo images,”J. Appl. Remote Sens., vol. 5, no. 1, pp. 053 527–053 527–19, 2011.
[26] B. Piltz, S. Bayer, and A. M. Poznanska, “Volume based DTM gen-eration from very high resolution photogrammetric DSMs,” In: The International Archives of the Photogrammetry, Remote Sensing and Spatial Information Sciences, vol. XLI-B3, pp. 83–90, 2016.
[27] G. Dial and J. Grodecki, “RPC replacement camera models,” in In: Proceedings of ASPRS, 2005.
[28] S. Auer, S. Hinz, and R. Bamler, “Ray-tracing simulation techniques for understanding high-resolution SAR images,”IEEE Trans. Geosci. Remote Sens., vol. 48, no. 3, pp. 1445–1456, 2010.
[29] N. Longbotham, C. Bleiler, C. Chaapel, C. Padwick, W. Emery, and F. Pacifici, “Spatial classification of WorldView-2 multi-angle sequence,” in2011 Joint Urban Remote Sensing Event, April 2011, pp. 105–108. [30] P. d’Angelo and G. Kuschk, “Dense multi-view stereo from satellite
imagery,” inProceedings of IGARSS Conference, July 2012, pp. 6944– 6947.
[31] W. Pitz and D. Miller, “The TerraSAR-X satellite,”IEEE Trans. Geosci. Remote Sens., vol. 48, no. 2, pp. 615–622, 2010.
[32] B. Phong, “Illumination for computer generated pictures,” Communica-tions of the ACM 18, vol. 18, no. 6, pp. 311–317, 1975.
[33] S. Auer and S. Gernhardt, “Linear signatures in urban SAR images -partly misinterpreted?”IEEE Geosci. Rem. Sens. Lett., no. 10, pp. 1762– 1766, Oct 2014.
[34] S. Auer, S. Gernhardt, and R. Bamler, “Ghost persistent scatterers related to multiple signal reflections,”IEEE Geosci. Rem. Sens. Lett., vol. 8, no. 5, pp. 919–923, September 2011.
[35] S. Auer and A. Donaubauer, “Buildings in high resolution SAR images - identification based on CityGML data,” inProceedings of Photogram-metric Image Analysis (PIA) Conference, 2015.
[36] G. Groeger, T. H. Kolbe, C. Nagel, and K.-H. Haefele, OGC City Geography Markup Language (CityGML) Encoding Standard, v2.0. OGC Doc. No. 12-019. Open Geospatial Consortium, 2012. [37] S. Gernhardt and R. Bamler, “Deformation monitoring of single
build-ings using meter-resolution SAR data in PSI,”ISPRS J. Photogramm. Remote Sens., vol. 73, pp. 68–79, 2012.
[38] X. Zhu and R. Bamler, “Very high resolution spaceborne SAR tomogra-phy in urban environment,”IEEE Trans. Geosci. Remote Sens., vol. 48, no. 12, pp. 4296–4308, 2010.
Stefan Auer received the Dipl.-Ing.(Univ.) degree in Geodesy in 2005 and the Dr.-Ing. degree in Re-mote Sensing in 2011 from Technical University of Munich (TUM), Munich, Germany. Since December 2014, he has been a senior researcher and project manager at the Remote Sensing Technology Institute (IMF), German Aerospace Center (DLR), Oberpfaf-fenhofen, Germany. Besides leading projects in the fields of multispectral and hyperspectral imaging, he works on the alignment of multi-modal remote sensing data. Beyond, his interest is in 3D simulation / data fusion techniques and the interpretation of high-resolution SAR and optical images. Stefan Auer developed the open-source 3-D SAR simulator RaySAR which can be used to better understand the nature of prominent SAR image signatures based on object models. In the context of his doctoral thesis, Stefan Auer spent three months as guest researcher at the Department of Electronic and Telecommunication Engineering (DIET) at the University of Naples ”Federico II” in Italy.
Isabel Hornig received the Dipl.-Ing.(Univ.) de-gree in Geodesy and Geoinformation from Technical University of Munich (TUM), Munich, Germany, in 2016. In her Master’s thesis she realized the optical component to the SimGeoI algorithm. Since 2017 she has been working at TerraLoupe, Munich, Germany, where she is concerned with deep learn-ing methods in the context of remote senslearn-ing and automotive applications.
Michael Schmitt (S08-M14-SM16) received the Dipl.-Ing. (Univ.) degree in Geodesy and Geoinfor-mation and the Dr.-Ing. degree in Remote Sensing from Technical University of Munich (TUM), Mu-nich, Germany, in 2009 and 2014, respectively. Since 2015, he has been a senior researcher and deputy head at the Professorship for Signal Processing in Earth Observation at TUM. In 2016, he was a guest scientist at the University of Massachusetts Amherst, Amherst, USA. His research focuses on signal and image processing for the extraction of information from remote sensing data. In particular, he is interested in sensor data fusion with emphasis on the joint exploitation of optical and radar data; in 3D reconstruction by techniques such as SAR interferometry, SAR tomography, radargrammetry, or photogrammetry; and in millimeter wave SAR remote sensing. He is a co-chair of the International Society for Photogrammetry and Remote Sensing Working Group I/3 SAR and Microwave Sensing and frequently serves as a reviewer for a number of renowned international journals. In 2013 and 2015 he was elected IEEE Geoscience and Remote Sensing Letters Best Reviewer, leading to his appointment as an associate editor of the journal in 2016.
Peter Reinartz (M09)received his Diploma (Dipl.-Phys.) in theoretical physics in 1983 from the Uni-versity of Munich and his PhD (Dr.-Ing) in civil engineering from the University of Hanover, in 1989. His dissertation is on optimization of classification methods for multispectral image data. Currently he is department head of the department Photogrammetry and Image Analysis at the German Aerospace Centre (DLR), Remote Sensing Technology Institute (IMF) and holds a professorship for computer science at the University of Osnabrueck. He has more than 30 years of experience in image processing and remote sensing and over 400 publications in these fields. His main interests are in machine learning, stereo-photogrammetry and data fusion using space borne and airborne image data, generation of digital elevation models and interpretation of very high resolution data from sensors like WorldView, GeoEye, and Pleiades. He is also engaged in using remote sensing data for disaster management and using high frequency time series of airborne image data for real time image processing and for operational use in case of disasters as well as for traffic monitoring.