PBL Note
Share of raw material costs
in total production costs
Harry Wilting and Aldert Hanemaaijer Corresponding author: harry.wilting@pbl.nl August 2014PBL Publication number: 1506
PBL | 2
Contents
Summary and conclusions 3
1 Introduction 5
2 Share of raw material costs in total production costs 7
2.1 The share of energy and material costs 7
2.2 The share of basic raw material costs 8
2.3 Shares of energy and material costs 9
2.4 Shares of basic raw material costs 11
2.5 Discussion and conclusion 13
3 International comparison 15
3.1 Production structure 15
3.2 Share of basic raw material costs in final demand 16 3.3 Comparison of raw material costs in three economic sectors 17
3.3.1 The food, alcohol and tobacco industry 17
3.3.2 Chemical industry 18
3.3.3 Electrical and optical equipment industry 18
3.4 Is Dutch industry less efficient? 20
4 Starting points for policy 22
4.1 Where in the production chain could interventions take place? 22
4.2 What type of policy for which natural resource? 23
4.3 Where would policy be most effective? 23
5 Conclusions 26
PBL | 3
Summary and conclusions
One way of promoting a more efficient use of natural resources by businesses and citizens is to put a price on raw materials (including energy). In order to predict the effects of pricing policy on the use of natural resources, insight is required into the share of raw material costs in the total costs for producers. This share can be calculated in at least two different ways:
1. Measuring the producers’ direct resource costs, indicated in this note as ‘energy and material costs’. This includes not only the costs of energy and materials, but also those of natural resources, products and semi-finished products, as well as the added value of, for instance, processed natural resources from upstream production chains.
2. A complete insight into the pure costs of natural resources requires the removal of as many as possible other costs related to the production chain, such as process-related labour costs. This enables determination of the so-called basic raw material costs, based on the price of natural resources. The calculated basic raw material costs are those related to purchased energy and materials in the production chain, broken down into all the natural resources used.
Basic raw material costs are a better indicator for resource use within an economy than the energy and material costs registered by producers. Because the basic costs do not include the added value from component-supplier production chains. In addition, basic raw material costs also are a better indicator for the potential behavioural effects of pricing such resources.
The fact that there are various ways of calculating the share of raw material costs in total production costs also explains the strongly deviating cost shares in the literature. The shares vary from over 40% in Germany to 5% in the Netherlands. The German studies also include the shares of energy and material costs, which include the added value from component-supplier production chains. The
calculations for the Netherlands only include the basic raw material costs. This partly explains the smaller share of raw material costs in total production costs. The German studies, furthermore, specifically focus on industry, whereas the Dutch study encompasses the entire economy.
To compare and understand the calculation methods, for this note, the shares of raw material costs were calculated both for the individual industrial sectors and for the economy as a whole.
1. The shares of basic raw material costs for Dutch industry in 2010 varied between 5% and 50%, and for energy and material costs between 20% and 60%. The food, chemical and base metal industries are particularly
resource-intensive. The direct use of natural resources in these sectors is relatively large, and is increased even further by the indirect use through purchased energy, materials and semi-finished products.
2. The share of basic raw material costs in the total final demand in the Dutch economy is over 14%. If only the domestic final demand is considered (therefore, excluding exports), the share of raw material costs is much lower, at 6.5%. Export itself, with a share of raw material costs of over 26%, is much more resource-intensive. The share of resource costs in domestic demand, as calculated for this note, is comparable to the results from a study by CE Delft (De Bruyn et al., 2009).
In order to compare raw material use in the Netherlands with that in the surrounding countries, we also calculated the raw material costs in Germany,
PBL | 4
Denmark and the United Kingdom. This international comparison showed the Dutch economy to be more resource-intensive than the economy in those surrounding countries. The use of resources in the Netherlands in production to meet domestic demand, however, is comparable. This means, therefore, that it is particularly the production of Dutch exports that is more resource-dependent than those in the other three countries. This is due to the fact that a relatively large share of basic industry (food, chemicals and metals) in the structure of Dutch industry mainly produces for the export market.
In a calculation example, this note demonstrates that the industries of food and food processing, base chemicals and base metals are the most vulnerable to price changes of raw materials. Pricing policy, therefore, provides an incentive for a more efficient use of resources. For sectors with small shares of resource costs in their total costs, the impact of pricing policy is expected to be small. In those cases, other policy measures would be more effective to improve efficiency such as standardisation of machinery and cars, and lease concepts for office furniture (circular economy).
The level of raw material use in economic sectors varies both within and between countries. This offers starting points for policy to promote a more efficient use of resources. A number of questions related to this subject must be answered first. These concern the most effective and efficient place for intervention within the chain, which raw materials policy should focus on first, and the possibilities of companies to improve the efficiency of using raw materials in their business processes. Answering these questions requires further research.
PBL | 5
1 Introduction
An important part of greening the economy is the more efficient use of raw materials (including energy). Much benefit, in this respect, is expected to be
achieved by improving the pricing of environmental use. Studies such as the Green Growth Strategy (OECD, 2011), the Green Growth Initiative (UNEP, 2011) and the Roadmap to a Resource Efficient Europe (EC, 2011) all agree on the importance of 'getting the prices right'. In addition, there is a growing realisation about the fact that investments in technologies that use resources more efficiently are beneficial to the economy (lower costs) as well as the environment (lower environmental burden per product unit), and that, therefore, such investments pay off.
Pricing raw materials is one of the ways to promote a more efficient use of natural resources by producers and consumers alike. For a more realistic estimation of the impact of higher prices on resource use, information is needed at the very least about the share of their costs in the total production costs and the expected price sensitivity or elasticity. This may help policymakers when formulating policy on efficiency improvements with respect to the use of natural resources.
In actual practice, there are large differences between economic sectors and companies in the share of raw material costs in total production costs. Therefore, a stronger impact may be expected from a price increase on an industrial sector with a relatively large share of resource costs, than on households and business services with much smaller shares of such costs. For the second group, other incentives must be sought for increasing the efficiency in the use of energy and materials. Because, otherwise, such efficiency improvements would have to be achieved by unpopular tariff differentiations or with a (very) high tariff across the board, which in turn would lead to evasive behaviour (e.g. getting petrol across the border where it's cheaper) and thus undermining the effectiveness of the policy incentive.
In case of an increase in the price of raw material, producers with a large share of such costs may be expected to try and keep these as low as possible and,
therefore, will sooner rather than later consider investments in resource-saving technologies. In addition, because these companies are so very dependent on raw materials, they may have taken many measures already to improve resource use efficiency.
The literature describes various methods for calculating the raw material cost share. This note first addresses the share of energy and material costs in total production costs both in the economy as a whole and in the economic sectors, in the Netherlands and in certain surrounding countries. Subsequently, it explains that this calculated share is not always a proper indicator of resource use within the economy as a whole or in individual economic sectors, and it introduces the term basic raw material costs.
Then it looks at possible starting points for policy on improving resource efficiency in various economic sectors. Regarding policy that is aimed at improving efficiency through price incentives, the note also poses the question of where possibilities lie to implement such price incentives into the chain. It finishes with conclusions and further points for discussion.
This note is intended to serve as input into discussions with policymakers, both in The Hague and Brussels, about the level of expectation regarding pricing policy as an instrument to promote more efficient resource use in the various economic sectors. Such discussion is needed for a better insight into where policy instruments
PBL | 6
other than those on pricing could be more effective. For example, on the
standardisation of electrical appliances and cars, or office furniture lease concepts (circular economy). This note, therefore, can be considered a building block for ultimately implementing policy tools more directly, to promote a more efficient use of raw materials within society.
From the perspective of resource saving, information is also needed on the 'rebound effect', which may cause disappointing resource policy results. A more efficient use in one economic sector may, for example, lead to in increased use of resources elsewhere, or to a greater demand for end products – which may even cause the absolute use of resources to increase. This rebound effect is not
discussed further in this note (for more information on this topic, see Oosterhuis et al., 2014).
PBL | 7
2 Share of raw material costs in total
production costs
In order to estimate the impact of policy on the use of raw materials, knowledge is required on the share of raw material costs in the total production costs. There are various methods for calculating that share, and a clear ‘protocol’ for doing so is lacking. This is why the literature provides strongly varying data on this share of raw material costs in total production costs. The Federal Statistical Office of Germany estimates ‘material costs’ of 40% in the manufacturing industry in
Germany (Bleischwitz et al., 2009, p.16). In 2008, material cost shares varied from 35% to 55% for individual industrial sectors (Schröter et al., 2011, p.10).
For the Netherlands, however, CE Delft indicated that the share of resource-based energy and material costs are around 5% (De Bruijn et al., 2009). These figures – varying from 5% to 40% – are the foundation for statements about the impact of pricing policy on resource use and the possibilities for any related efficiency improvements. The difference in figures is being caused by the difference in calculation methods. Therefore, this note first elaborates on the various terms and calculation methods.
2.1 The share of energy and material costs
German studies refer to the share of raw material costs as the share of energy and material costs in total costs made by companies for supplying of goods and
services. These total costs, per definition, equal the turnover or production value. From a business economics perspective, the total costs can be divided into so-called intermediate costs and the added value. Intermediate costs, in turn, include the purchased raw materials (including energy, materials, products and semi-finished products) used in the primary production process, as well as the purchased
auxiliary substances and third-party services (e.g. costs of housing, transport and insurance). The added value includes labour costs, taxes and depreciation, as well as profit margins. For any business sector, costs are divided into purchasing costs related to the primary process, other costs, and added value, as depicted in the upper bar of Figure 1.
The term energy and material costs, usually, refers to purchases for the primary process, and therefore not only includes the cost of energy and materials but also those of natural resources, products and semi-finished products. The share of energy and material costs calculated in this way is used as an indicator for the impact of pricing policy on resource-purchasing behaviour.
PBL | 8
Figure 1 Relationship between the share of energy and material costs and the share of basic raw material costs in the cost structure of companies.
2.2 The share of basic raw material costs
Energy and material costs form a less suitable indicator of the impact of pricing policy on raw materials, because the value of the energy and materials used does not equal the value of the raw materials used. The energy and materials include other costs that are incurred during processing along the chain, such as those related to labour and transport. Another measure for the raw materials used in production, therefore, are the costs related only to the use of those materials within the production chains of the purchased energy and materials. In this note, these costs are referred to as the basic raw material costs.
Basic raw material costs, thus, are the costs of all purchased natural resources within the entire production chain. These costs are, in fact, based on the price of the raw materials; all other costs are removed to the greatest extent possible1. The calculation follows the production chain; the basic raw material costs in an economic sector consist of the value of the natural resources in every stage of that production chain, all added together. They are represented by the lower bar of Figure 1. The other costs incurred by companies may still contain a small share of natural resource costs, such as in the paper used for commercial purposes, or in the maintenance of buildings. The share of basic raw material costs in total
production costs, generally, will be smaller than the share of energy and materials (unless the share of natural resource costs in other costs is very large). Further along this section the calculated shares of energy and material costs and basic raw material costs are presented for the Dutch economy and industry.
1The price of natural resources still include some other costs, such as those related to the labour
PBL | 9
2.3 Shares of energy and material costs
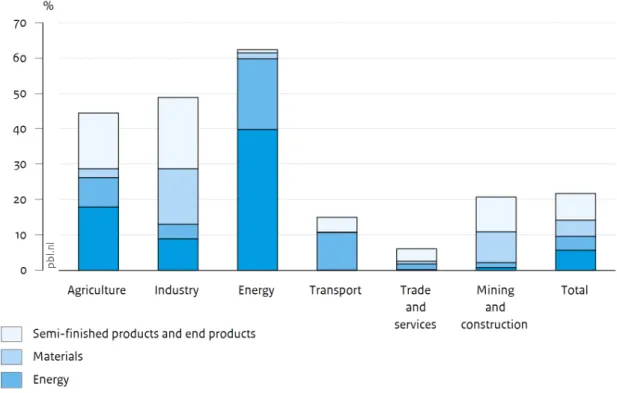
In 2010, the share of energy and material costs of all companies in the Dutch economy, together, was over 20%. The share of energy costs in the total costs of the entire economy was 4%. The largest shares of energy and material costs were found in the economic sectors of energy, industry and agriculture, with a relatively large amount of purchased natural resources (see Figure 2). The purchasing costs of energy are particularly relevant for energy companies and those in the transport sector. The latter may therefore be expected to be more affected by a tax on energy than the industrial sector. Energy and material costs generally form the main cost category for industrial companies. For the Dutch industrial sector as a whole, the share of these costs in the total costs is close to 49%, over 4% of which concerns energy. This is largely in line with the figure for German industry, as mentioned above, which is also over 40%.
Figure 2 Particularly agriculture, industry and the energy sector use large amounts of raw materials.
PBL | 10
Explanation of the calculated share of energy and material costs
The data in Figure 2 were derived from the economic input–output table for the Netherlands. Input–output tables describe the cost structure of economic sectors. For each sector, they provide the input costs related to goods and services purchased from other sectors, as well as the costs of, for example, labour, depreciation and taxation. The energy and material costs have been divided into those of natural resources, energy, materials, products and semi-finished products. The share of natural resource costs in a particular economic sector were based on the input costs from agriculture, forestry, fisheries and mineral extraction (including petroleum and natural gas extraction). The share of energy costs is based on the input from energy companies (refineries and power companies). The share of material costs is based on the input from the timber and paper industries, base chemical, construction material and base metal industries. And, finally, the share of costs related to products and semi-finished products concerns the other industrial sectors.
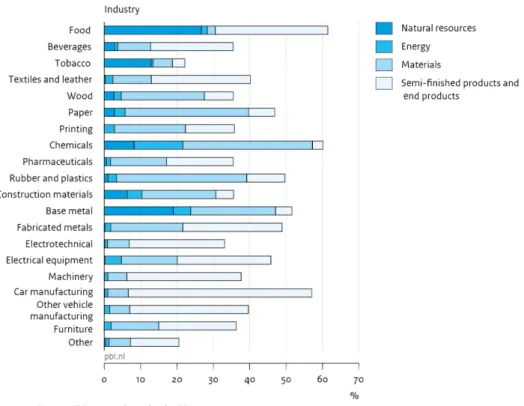
A similar calculation to that for the entire Dutch economy can also be made for the individual industrial sectors. The share of energy and material costs in total
production costs, in the various industrial sectors, is between 20% and 60% (see Figure 3). The food industry, base chemical industry and the construction material and base metal industry use relatively many natural resources. Further along the production chains, the amounts of natural resources decrease and the share of materials increases; at the end of the production chains (the ‘other industry’), the share of energy and material costs related to products and semi-finished products is relatively large.
The fact that the share of energy and material costs is a relatively large part of the operating costs, is used to justify a pricing policy on raw materials – as a tax on energy, materials and natural resources is expected to have a large impact on purchasing costs and thus will be an incentive to improve resource efficiency. However, it is also claimed that this is a reason for in fact not using policy, from the expectation that the market provides sufficient incentive for a more efficient use of raw materials.
PBL | 11
Figure 3 The food industry, base chemical industry and the construction material and base metal industry have relatively high shares of energy and material costs.
2.4 Shares of basic raw material costs
The resource use of companies can also be expressed as basic raw material use. Purchased energy, materials and semi-finished products are then retraced and recalculated into each separate natural resource that was used in the production chains of the purchased goods and services. Thus, in fact, the direct and indirect natural resource use by the various economic sectors is calculated. Economic input– output analyses were used to calculate the share of basic raw materials in total production costs. Because input–output analyses enable determination of the individual contributions from the economic sectors higher up the production chains. Subsequently, by selecting the contributions by the natural resource sector from all economic sectors, the relevance and value of natural resources as a share in the production costs can be determined. This calculation determines the share of the squares at the bottom of Figure 1 in total production costs.
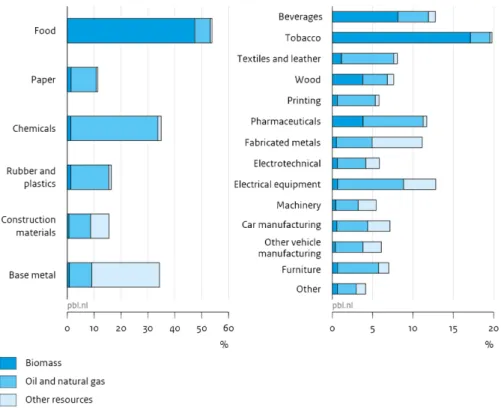
The basic raw material costs as a share in the costs of basic industry vary between around 10% and over 50% (see Figure 4, left side). These are in fact the shares of energy and material costs in these economic sectors (in Figure 3), recalculated to the natural resources that were used in the production. The food industry, with close to 27%, already had a rather large direct natural resource use. Added to this is a more or less equal percentage of indirect natural resource use within the production chain, particularly from agriculture. The basic raw material costs in the paper, chemical, rubber and synthetics industries mostly concern crude oil and natural gas. Production in the construction materials and base metal industries also require other natural resources, such as sand, gravel and ores.
PBL | 12
Figure 4 The shares of basic raw material costs are larger in the basic industry than in the processing industry.
The share of basic raw material costs in economic sectors in the processing industry is lower and varies between 4% and 20% (see Figure 4, right side). The share of direct natural resource costs in this industry, generally, does not exceed 0.3% (see Figure 3), whereas the indirect natural resource costs often are around 5% to 10% or even more. The other natural resources mostly concern metal ores that are applied in the production of materials and semi-finished products for the metal processing industry.
To obtain an impression of the use of natural resources within the entire economy, we calculated the share of basic raw materials in the Dutch final demand. Final demand concerns the value of the produced end products in the economy,
subdivided according to private and public consumption, investments and exports. The share of basic raw material costs in the total final demand was found to concern over 14%. When only domestic final demand is considered – excluding exports – the share is far smaller, namely 6.5%. Exports, with a share of over 26%, are much more resource-intensive. This is due to a relatively large share of the resource-intensive economic sectors (food, chemicals and metals) in the structure of the export-oriented part of Dutch industry.
CE Delft chose a similar approach for calculating the true resource costs in end product costs. They also calculated the share of natural resources from agriculture and mineral extraction, as the contribution to total production that is needed to meet the final demand. CD Delft has indicated that the share of resource costs in
PBL | 13 the total production costs was around 5% in 2005 (De Bruijn et al., 2009). This figure, therefore, not only includes the basic raw material costs specific to this industry, but concerns the entire economy and is of the same order of magnitude as the share in the domestic final demand of 6.5%, as calculated by us.
2.5 Discussion and conclusion
The seemingly large differences in the shares of raw material costs between studies (from 5% to 40%) are smaller in actual practice. The German studies, for example, talk about the industry, while CE Delft speaks of the economy as a whole.
Furthermore, in the German projections of 40%, the calculation of the shares of energy and material costs were based on intermediate use. This, however, also includes the labour costs involved in resource processing – which is another important factor in explaining the difference between the 5%, the share of basic raw materials, and the 40%. The energy and material costs, in fact, partly represent the added value in the production chains.
When taking the basic raw material costs as a starting point, the cost share is much lower for the industry than when the starting point is the energy and material costs (Figure 5). Energy and material costs are an indicator of resource use from a business cost perspective, but are less accurate in indicating the claim on natural resources. An indicator calculated on the basis of basic raw materials provides a more suitable indication of the use of natural resources within an economy. The share of basic raw material costs in industrial sectors varies from 5% to 50%, and for energy and material costs this is between 20% and 60%. Policy on natural resources, therefore, is likely to have a different impact on industrial sectors than would a policy on all raw materials (including energy, materials and semi-finished products). The two calculation methods are in fact each other's opposites, with on the one hand the costs from the perspective of energy and material use by
companies, and on the other hand the costs on the basis of the extracted resources at their point of entry in the economy. They offer different starting points for pricing policy.
PBL | 14
Figure 5 Shares of energy and material costs are larger than those of basic raw material costs in industry.
PBL | 15
3 International comparison
As it would be interesting to see whether economic sectors in the Netherlands and those abroad would be equally affected by a pricing policy on raw materials, we looked at the level of efficiency in their natural resource use. The more efficient these economic sectors would be, the less they would be affected by such a pricing policy. This chapter describes a comparison between the cost shares of raw
materials in the Netherlands and three of the surrounding countries: Germany, Denmark and the United Kingdom.
3.1 Production structure
A country's production structure partly determines the level of resource-intensity of its economy. Overall, the production structure of the Netherlands, measured in added-value shares, is comparable to that of a number of neighbouring countries (see Figure 6). Germany has a relatively higher added value in industry than the other countries, and therefore may be slightly more resource-intensive.
PBL | 16
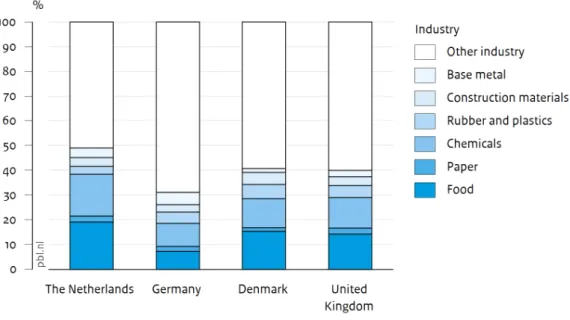
Figure 7 Shares of value added in industry, for four countries.
The industrial structure in the Netherlands clearly varies from that in the
surrounding countries. In the comparison, the Netherlands was found to have a relatively large food and chemicals industry (Figure 7), and these are the very sectors with a large claim on raw materials.
3.2 Share of basic raw material costs in final
demand
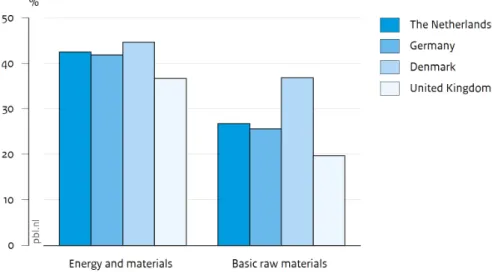
Figure 8 presents the resource-intensity of final demand in the various countries, on the basis of the share of basic raw material costs. The Netherlands, and to a lesser extent also Denmark, uses more natural resources across the entire chain from production to final demand, than both other countries in this study. The figure shows that this is not due to domestic final demand (private and public
consumption together with investments), but to exports. The claim on natural resources used in the production related to domestic final demand was found to be comparable for the various countries (around 4%)2. However, for exports the story is rather different; Dutch – and to a lesser extent also Danish – exports are more dependent on raw materials than the exports from Germany and the United
Kingdom. The composition of exports from the first two countries has a larger share of resource-intensive economic sectors, such as the food and processing industry and chemical industry.
2 Data on the Netherlands deviate from those presented in Chapter 2, because here a different source was used, with higher aggregation level of input–output tables as well as a different base year.
PBL | 17
Figure 8 Differences in the resource intensity of final demand between countries are caused by exports.
3.3 Comparison of raw material costs in three
economic sectors
The Dutch economy is more resource-intensive than those of some of the
surrounding countries. This is due to a relatively larger share of the base industry in the structure of the industry predominantly producing for the export. An additional question is whether Dutch industry produces less or more efficiently than that in other countries. Therefore, a comparison was made between the Dutch and other countries’ shares of energy and material costs and basic raw material costs in three types of industry: the food, alcohol and tobacco industry, the chemical industry, and the electrical and optical equipment industry.
3.3.1 The food, alcohol and tobacco industry
Compared to Germany and to a lesser degree both other countries, the Netherlands has a rather large food, alcohol and tobacco industry. That industry’s share of energy and material costs, however, is comparable with that of other countries (Figure 9). Basic raw material costs are also of the same order of magnitude. For the food sector, the share is slightly larger than that of Germany and the United Kingdom, possibly due to a larger share of relatively more resource-intensive industries in the Netherlands, such as those of sugar, starch and animal feed.
PBL | 18
Figure 9 Shares of energy and material costs are larger than those of basic raw material costs in food industry, in four countries.
3.3.2 Chemical industry
The differences between the countries are greater for the chemical industry, which includes both base chemistry and chemical products. The share of energy and material costs in total production costs is clearly larger for the Dutch chemical industry than that in other countries (Figure 10). Tracing back all the individual resources for the energy and material use leads to a score for the Netherlands that is a factor of 3 to 4 higher than for the other countries. This particularly appears to indicate that chemistry in the Netherlands consist mainly of the production of commodity chemicals supplied to other economic sectors, such as that of fine chemicals, for their incorporation into chemical products. This level of detail, however, is not present in the databases used, and therefore this assumption cannot be verified.
3.3.3 Electrical and optical equipment industry
In the combined electrical and optical equipment industry, the share of energy and material costs in the Netherlands is smaller than in the surrounding countries (Figure 11). The Dutch share of basic raw materials was found to be larger. These types of differences are important when implementing taxation of energy and material use. A tax on the extraction of natural resources generates different effects than one on the use of energy or materials within the production process itself. In the first case, the economic sector in the Netherlands receives a larger burden, while in the second case such a tax in fact improves the competitive position of the Dutch sector.
PBL | 19
Figure 10 The share of raw material costs in total production costs in the chemical industry is larger in the Netherlands than in other countries.
Figure 11 The shares of energy and material costs in total production costs in the electrical and optical equipment industry are far larger than the shares of basic raw material costs.
PBL | 20
Figure 12 The shares of energy and material costs declined in three of the four countries.
No significant difference was found between the total share of energy and material costs of industry in the Netherlands and that of other countries (Figure 12). In the 1995–2009 period, this share was between 35% and 40% in all four countries. However, the German share is notably increasing, whereas for the other countries a decline can be seen.
3.4 Is Dutch industry less efficient?
Differences in raw material costs in economic sectors may point to differences in efficiency levels, but other factors may also play a role. The largest factor is likely to be that of the different mixes of products produced. Another factor may be that of differences in price level. In order to exclude any such price differences, we calculated the energy intensity of industrial sectors on the basis of their physical use of energy (Figure 13). Results from this calculation varied; the Dutch chemical and machinery and equipment industries were found to have a higher energy intensity than in a number of surrounding countries. However, the Dutch food and timber industries had a lower energy use per product unit, when compared with those in other countries.
PBL | 21
Figure 13 Energy intensities vary between industries and countries.
From the databases used it was difficult to determine whether the Dutch economic sectors were less efficient or in fact more efficient than those in other countries. Benchmark studies on energy use could possibly provide more information, in this respect.
PBL | 22
4 Starting points for policy
Our calculations have shown that there are differences in raw material use between and among economic sectors, both in the Netherlands and its surrounding
countries. These may provide starting points for policymakers to promote a more efficient use of resources. The analyses have led to a number of follow-up
questions, which require further research, such as:
4.1 Where in the production chain could
interventions take place?
A chain approach offers various possibilities to intervene in the production chain; for example, at the point of extraction of natural resources, or at the use of energy or materials by businesses and consumers. This offers a number of different
starting points for policymakers. However, currently there are few scientific studies available on the implementation of, for instance, pricing policy on resources other than those related to energy.
A study by ETC/SCP (2012) distinguishes three types of taxation on resources, implemented at various points along the production chain: 1) at the extraction of the natural resources; 2) at the point where a resource or product enters the domestic economy; and 3) at the final consumption of products. Furthermore, the objectives and advantages and disadvantages of the various types of taxation have been listed:
1. A tax on natural resources at the extraction point of minerals and fossil fuels (Extraction Tax). This is the simplest taxation basis – for example, according to weight – and is relatively easy to implement. Such a tax may be aimed to generate revenue for the Treasury Department, but a higher price may also stimulate more resource efficiency in production processes further along the production chain, or at the point of consumption or recycling. However, only a relatively small amount of minerals is being extracted within the
Netherlands (and in the European Union), therefore, any taxation of natural resources will have to be complemented by an import tax and exports subsidies (via Border Tax Adjustments (BTA)), in order to guarantee the competitive position of domestic producers.
2. A tax on raw materials (including materials and semi-finished products) at the time of their first use in the national economy (Material Input Tax), in order to increase the resource efficiency in production. This will be at their first industrial use in the production process, regardless of resource origin (domestic or imported). If this tax is to be implemented, BTAs are required, on the basis of the resource content of imported products. As there are a very large number of products each with their own composition of resources, it will be difficult to implement BTAs. In contrast to the Extraction Tax, the Material Input Tax would be more focused on the level of dependency
related to the resources and on their use. Depending on price elasticities and possibilities of substitution, the Material Input Tax could reduce the demand for, and thus also the extraction of, natural resources.
3. Taxation of end products at the point of consumption, based on the resource content of these end products (Consumption Tax). This tax is intended to make consumer behaviour more sustainability conscious. It is very general and relatively easy to implement, comparable with an added-value tax. It is,
PBL | 23 however, very difficult to determine the exact resource content of every product, and this may become a point of discussion. It would be simpler to tax a limited group of products; for example, very resource-intensive products of more homogenous products, such as electricity. The further along the production chain, the lower the environmental burden per euro will be. In addition, natural resources carry a higher environmental burden per euro than end products and semi-finished products. In order to achieve the same environmental benefit, the tax on semi-finished products therefore will have to be higher than that on natural resources.
4.2 What type of policy for which natural resource?
Policy can be made for all types of natural resources, but is would be more logical to differentiate between specific resources and focus policy on specific objectives. If policy would be aimed to achieve more efficient use of resources in order to reduce the environmental burden, a relatively high tax per physical unit on resources with a large environmental burden could be imagined. Van der Voet et al. (2003) provide an overview of the environmental burden per type of resource.
Differentiation could also be applied according to resource scarcity, although this may already be organised by the market itself, as prices rise when resources become scarcer.
In the Netherlands, resource taxes are limited to the use of energy (particularly for small-scale use). In addition, there are tariffs for waste removal and sewage treatment. A number of EU Member States have experience in taxation of
resources, and in particular natural resources used in construction, such as sand and gravel (e.g. see Bahn-Walkowiak et al., 2012). Further along the production chain, the relationship with individual resources becomes more diffuse. It is difficult to determine which materials and natural resources were used in semi-finished and finished products.
4.3 Where would policy be most effective?
Whether policy is less or more effective depends on the adjustment possibilities in production processes. If producers have few options to substitute natural resources, they are less likely to do so and, therefore, will be affected less by such policy. Generally speaking, a larger number of substitutes will become available under an increasing degree of processing. Under policy on natural resources there are few substitution options for companies in heavy industry (where they make materials from natural resources and supply other industrial sectors). An aluminium
producer, for example, cannot replace bauxite by another resource. As these types of economic sectors are very dependent on natural resources, it may be assumed that companies already are making efficiency improvements and that, in the short term, few additional efficiency improvements can be expected. The possibilities for efficiency improvements in the use of energy and materials in the processing industry that works on end products are likely to be greater. At the end of
production chains – at the consumer end – the options for efficiency improvements and substitution are the greatest. To obtain further insight into the potential impact of policy, more knowledge is required on the physical possibilities of companies to improve their resource efficiency.
In addition, there is the question whether producers, for example, could pass price increases on to their customers or see their competitive position reduced in
exports. Whether or not companies could pass on the resource price increases would depend mainly on their competitive position, also internationally, and on
PBL | 24
their customers’ response and sensitivity to such increases (price elasticities). In markets with only limited competition, companies sometimes increase their prices only after the market leader has done so. In cases where companies cannot pass on the additional costs, their profit margins suffer.
Illustrative calculation example: what are the benefits of pricing policy?
Pricing policy is one of the options for promoting a more efficient use of natural resources. The impact of a tax on resource extraction differs for energy and material costs per economic sector, and cannot immediately be observed. Therefore, an example is given below of the impact of a fictitious tax of 10% on all natural resources on energy and material costs from the perspective of various economic sectors. Figure 14 presents an overview of the impact of such a tax.
Figure 14 The food industry and the chemical and base metal industries would be the most sensitive to the taxation of raw materials.
The tax on natural resources would have a varying impact on industrial costs. In particular, the food industry and the chemical and base metal industries would be the most sensitive to such taxes. Because their share of resource costs in production costs is the greatest, as indicated earlier in this note. The impact would be felt the most in the food industry, as this sector is very dependent on agricultural resources. The impact on the various economic sectors will vary if the tax is differentiated according to the type of resource. Thus, the food industry will be particularly sensitive to a tax on agricultural products, while for the chemical industry taxation of crude oil and natural gas would have the greatest impact.
Pricing effects may also be calculated for final demand – consumption and exports. The latter would be more sensitive to a tax on natural resources than would be domestic consumption. At a 10% tax on resources that is passed on to customers, the average price of exports would increase by around 3%. The average price of domestic consumptive purchases would be less sensitive to an increase in resource prices and would increase by over 0.5%
PBL | 25 The calculation is a ‘first-order approach’; it does not contain any feedback mechanism, such as through behavioural changes, which could lead to a more efficient use of resources. Price elasticities could be used to discover the degree to which such behavioural changes would occur and whether the demand for resources in the production process would decline. A general equilibrium model could be used to calculate the likely response to price changes. There are a number of practical examples of energy taxation, and extending this to also include other resources, including materials, seems a logical step. The application of this policy tool to non-energetic resources, however, does not appear to be a trivial matter, due to various implementation issues (ETC/SCP, 2012). The ETC/SCP study shows that, in general, a tax on non-energetic resources would be rather difficult to implement.
PBL | 26
5 Conclusions
An important factor in determining the impact of pricing policy that is aimed to promote a more efficient use of resources is the share of resource costs in total production costs. This share can be determined in various ways; for example, via the share of energy and material costs and that of basic raw material costs.
The share of basic raw material costs was found to be lower than that of the energy and material costs. This is due to the fact that the share of energy and material costs also includes other costs that are incurred during resource processing along the production chain; for instance, the transportation costs and the labour costs involved in resource processing. The calculated indicator based on basic raw
materials is more suited as an indicator for total resource use in an economy. Thus, the energy and material costs are a less suitable measure for obtaining an
indication of the impact of taxes on resources, because the value of the energy and materials purchased does not fully represent the value of the natural resources used.
For industrial sectors in the Netherlands, the share of basic raw materials varies from 5% to 50%, and for energy and material costs this is between 20% and 60%. The Dutch food industry and the chemical and base metal industries are particularly resource-intensive. These economic sectors already have a relatively large direct use of natural resources, and through the purchase of energy, materials and semi-finished products, the indirect resource use is added to that. To a measure of resource use in the Dutch economy, the share of basic raw material costs in final demand was calculated. This share in total final demand is 14%. If only the domestic final demand, thus excluding exports, is considered, this share is much lower, namely 6.5%. With a share of over 26%, exports are much more resource-intensive.
The international comparison showed the Dutch economy to be more resource-intensive than the economies of some of the surrounding countries. However, when looking at the claim on resources used in the production to meet the domestic demand, with around 4%, this is comparable to that of Germany, Denmark and the United Kingdom. Dutch exports, in particular, are more resource-dependent (15%). This is caused by a relatively larger share of the base industry (food, chemicals and metals) in the structure of the industry that produces mostly for exports. In relative terms, only the share of resource costs for the chemical industry is notably larger than that in the surrounding countries. However, this can also largely be attributed to a structure effect in the chemical industry because of its diversity: the
Netherlands produces large amounts of bulk chemicals – Dutch base chemistry is very resource-intensive, compared to other chemistry subsectors. The food industry and base chemical and base metal industries are the most sensitive to changes in the price of resources.
The strongly deviating data in the literature – varying from over 40% in Germany to 5% in the Netherlands – are clearly explained by the analysis that was carried out for this note. To begin with, the German studies refer to the industry, while data from CE Delft involve the entire economy. Furthermore, in the German studies, the shares of energy and material costs were calculated and, thus, also include some of the added value from the production chains. This is the second, important factor explaining the difference between the 5% and 40%. The previously calculated share of basic raw material costs of 5% for the entire
economy is around the same order of magnitude as the share of resource costs in domestic final demand of 6.5%, as was calculated for this note.
PBL | 27 In studying the economic sectors to determine where resource pricing would be more effective, the share of resource costs is only one of the important factors. After all, in sectors that use a relatively small amount of resources, the impact of pricing obviously will also be small. In those cases, policy tools other than pricing seem more promising, such as standardisation of appliances and cars, and lease concepts for office furniture (circular economy). To promote a more efficient use of energy and materials calls for a specific implementation of other policy tools, in addition to pricing. This, however, requires a more detailed and sector-specific analysis.
PBL | 28
Literature
De Bruyn S, Markowska A, De Jong F and Blom, M. (2009). Resource productivity, competitiveness and environmental policies, CE Delft, Delft.
Bleischwitz R, Giljum S, Kuhndt M, Schmidt-Bleek F, Bahn-Walkowiak B, Irrek W, Schepelmann P, Lutter S, Bohunovski L, Hinterberger F, Hawkins E and Pratt N. (2009). Eco-innovation – putting the EU on the path of a resource and energy efficient economy, Wuppertal Institute for Climate, Environment and Energy, Wuppertal.
Bahn-Walkowiak B, Bleischwitz R, Distelkamp M and Meyer M. (2012). Taxing construction minerals: a contribution to a resource-efficient Europe, Mineral Economics 25, pp. 29–43.
CBS (2013). Nationale Rekeningen, input-output tabel 2010 inclusief tabel van concurrerende invoer [National Accounts, input–output table 2010, including table on competing imports (in Dutch)], Statistics Netherlands (CBS), The Hague,
http://www.cbs.nl/nl-NL/menu/themas/macro-economie/cijfers/incidenteel/maatwerk/2012-i-o-cm.htm.
EC (2011). Roadmap to a Resource Efficient Europe, Communication from the Commission to the European Parliament, the Council, the European Economic and Social Committee and the Committee of the Regions, COM(2011) 571 final, Brussels.
ETC/SCP (2012). Resource taxation and resource efficiency along the value chain of mineral resources, Working paper prepared for the European Environment Agency (EEA), Copenhagen.
Eurostat (2013). Symmetric input-output table at basic prices 2007, Nace Rev. 1, http://epp.eurostat.ec.europa.eu/portal/page/portal/esa95_supply_use_input_table s/data/workbooks.
OECD (2011). Towards Green Growth, Organisation for Economic Co-operation and Development, Paris.
Oosterhuis F, Bouma J and Hanemaaijer A. (2013). Het reboundeffect bij resource efficiency [The rebound effect for resource efficiency (in Dutch)], Report R-13/03, IVM Institute for Environmental Studies (of the VU University Amsterdam),
Amsterdam.
Schröter M, Lerch C and Jäger A. (2011). Materialeffizienz in der Produktion:
Einsparpotenziale und Verbreitung von Konzepten zur Materialeinsparung im Verar- beitenden Gewerbe, Fraunhofer-Institut für System- und Innovationsforschung ISI, Karlsruhe.
Timmer MP. (ed.) (2012). The World Input-Output Database (WIOD): Contents, Sources and Methods, WIOD Working Paper Number 10, downloadable from http://www.wiod.org/publications/papers/wiod10.pdf
UNEP (2011). Towards a Green Economy: Pathways to Sustainable Development and Poverty Eradication, United Nations Environment Programme, Nairobi.
Van der Voet E, Van Oers L and Nikolic I. (2003). Dematerialisation: not just a mat- ter of weight, CML report 160, Centre of Environmental Science, Leiden.
Parts of this publication may be reproduced, providing the source is stated,
in the form: Wilting H.C., Hanemaaijer A. (2014), Share of raw material
costs in total production costs, PBL publication number 1506, The Hague,