EYE TRACKING METHODS FOR ANALYSIS OF VISUO-COGNITIVE BEHAVIOR IN MEDICAL IMAGING
A Dissertation by
FOLAMI TOLULOPE ALAMUDUN
Submitted to the Office of Graduate and Professional Studies of Texas A&M University
in partial fulfillment of the requirements for the degree of DOCTOR OF PHILOSOPHY
Chair of Committee, Tracy Anne Hammond Committee Members, Thomas R. Ioerger
Tiffani L. Williams Thomas Ferris Head of Department, Dilma Da Silva
May 2016
Major Subject: Computer Science
ABSTRACT
Predictivemodelingofhumanvisualsearchbehaviorandtheunderlying metacog-nitive processes is now possible thanks to significant advances in bio-sensing device technology andmachineintelligence.Eyetrackingbio-sensors,forexample,can mea-sure psycho-physiologicalresponsethrough changeevents inconfiguration of the hu-man eye. These events include positional changes such as visual fixation, saccadic movements, and scanpath, and non-positional changes such as blinks and pupil di-lation and constriction. Using data from eye-tracking sensors, we can model human perception,cognitiveprocesses,andresponsestoexternalstimuli.
Inthisstudy,weinvestigatedthevisuo-cognitivebehaviorofcliniciansduringthe diagnosticdecisionprocessforbreastcancerscreeningunderclinicallyequivalent ex-perimentalconditionsinvolvingmultiplemonitorsandbreastprojectionviews.Using ahead-mountedeyetrackingdevice andacustomizeduserinterface,werecordedeye changeevents anddiagnosticdecisionsfrom10clinicians (threebreast-imaging radi-ologists and seven Radiology residents)for a corpus of 100 screening mammograms (comprising cases of varied pathologyand breast parenchyma density).
We proposed novel features and gaze analysis techniques, which help to en-code discriminative pattern changes in positional and non-positional measures of eye events. These changes were shown to correlate with individual image readers’ identityandexperiencelevel,mammographiccase pathologyandbreastparenchyma density, and diagnostic decision.
Furthermore,our results suggestthat a combination of machine intelligence and bio-sensing modalities can provideadequate predictive capability for the character-ization of a mammographic case and image readers diagnostic performance. Lastly,
features characterizing eye movements can be utilized for biometric identification purposes. These findings are impactful in real-time performance monitoring and per-sonalized intelligent training and evaluation systems in screening mammography. Further, the developed algorithms are applicable in other application domains in-volving high-risk visual tasks.
DEDICATION
This work is dedicated to Oluwaseyi Alamudun, without who’s unwavering sup-port none of this could be at all possible; not even by a long chalk! And to my super clan: Abiodun, Oluwadarasimi, Adetutu, Oluwafolahanmi, and to the little one who is yet to arrive. I am humbled and thankful for your smiles, laughter, and love.
And my deepest gratitude to Him, through Who’s Grace I came into being and am permitted to exist!
ACKNOWLEDGEMENTS
First, I wish to extend my deepest gratitude to my advisor, Dr. Tracy Anne Hammond for her support as an advisor, a mentor, and a guide through much of the challenges I encountered during my graduate experience. I am always in awe at your brilliance both in the manner in which your fulfill your professional duties and in your exemplary character as a human being. I thank you for believing in me, for inspiring me through your passion for both work and play, and for supporting me. I will also like to thank Dr. Georgia Tourassi, who has been a strong mentor to me. I cannot thank you enough for taking me under your wing and providing immeasurable help in propelling my research through guidance, ideas, unwavering support, and through the many opportunities to conduct collaborative research. Many thanks to Dr. Hongjoon Yoon, for being such an awesome mentor and friend. Thank you for being so welcoming and keeping me grounded in my research whenever I let my imagination get the best of me. A special thanks to Dr. Lawrence Johnson, who has been a mentor to me since my first days as an undergraduate at the University of Texas at El Paso.
I wish to thank the members of my committee: Dr. Ioerger, who has offered his unwavering support as a mentor and teacher since I first set foot on the campus of Texas A&M University. Many, many thanks to Dr. Tiffani Williams, who has mentored, counseled, and advised me through the difficult and also the not so difficult experiences during my graduate program. And to Dr. Thomas Ferris for his inspiring contributions and guidance.
I wish to thank my peers at the Sketch Recognition lab, with whom I have had nothing but pleasant and inspiring experiences. First, a special thank you to
Stephanie Valentine for being an inspiring colleague and for the memorable conver-sations. Thank you to Manoj Prasad, Danielle Cummings, Paul Taele, Ayden Kim, Murat Russell, JongIn Koh, Sunah Park, Vijay Rajanna, Anna Stepanova and other members. Many thanks to my former colleagues Jongyoon Choi, Sandesh Aryal, Joseph Lee, and Gene Huang. Thanks to my other peers at Texas A&M University who have helped make this journey memorable. A special thank you to the depart-mental staff for their assistance over the years: Karrie Bourquin, Elena Rodriguez, Sybil Popham, Valerie Sorenson, Leslie Darling, Dave Cote, Bruce Veals, Theresa Roberts, and a special thanks to Kathy Waskom and other departmental staff mem-bers. Thank you kindly.
Thank you to my friends who have stuck with me through this process and put up with my many changes: Mighty & Salewa Itauma, Segun & Erma Williams, Soji & Lanre Awe, and Charles & Kemi Daramola, Samson & Yemisi Vese, Funke Owolabi, and Olusola Ilupeju. A special thank you to my siblings, Yele, Yemi & Alaba, and Jimi & Temi Alamudun, Kemi, Sesan, Taiye, and Kehinde Owonubi. And to Elizabeth Ayorinde, Damola Alamudun, Mike & Lara Ojowa, Sola & Funmi Oyewole, Kehinde & Yinka Alamudun, My deepest gratitude to my parents, Folagbade & Oluwatoyin Alamudun, and John & Olufunke Owonubi, who have provided their unwavering support and encouragement throughout my graduate experience. “E seun mo dupe lopo lopo!”
TABLE OF CONTENTS
Page
ABSTRACT . . . ii
DEDICATION . . . iv
ACKNOWLEDGEMENTS . . . v
TABLE OF CONTENTS . . . vii
LIST OF FIGURES . . . x
LIST OF TABLES . . . xiv
1. INTRODUCTION . . . 1
1.1 Overview of Mammography . . . 5
1.2 Computer-Aided Detection and Diagnosis of Breast Cancer . . . 9
1.2.1 Computer-Aided Methods for Improved Detection of Masses and Calcification Clusters . . . 9
1.2.2 Computer-Aided Detection of Architectural Distortions and Bilateral Asymmetry Anomalies in Mammograms . . . 12
1.2.3 Computer-Aided Detection For Real-Time Support in Mam-mography . . . 13
1.3 Image Perception Research in Screening Mammography . . . 15
1.4 Eye Tracking . . . 16
1.4.1 Visual Perception . . . 16
1.4.2 Eye Events . . . 19
1.4.3 Eye Tracking Research in Radiology . . . 23
2. FRACTAL ANALYSIS OF VISUAL SEARCH BEHAVIOR IN SCREEN-ING MAMMOGRAPHY . . . 30
2.1 Introduction . . . 31
2.2 Materials and Methods . . . 33
2.2.1 Image Database . . . 33
2.2.2 Data Collection Protocol . . . 34
2.2.3 Data Processing and Feature Extraction . . . 38
2.3 Results . . . 40
2.3.1 Diagnostic Performance . . . 40
2.3.2 Fractal Dimension of Image Reader’s Visual Search . . . 42
2.3.3 Analysis of Variations in Fractal Dimension of Visual Search . 45 2.4 Discussion and Conclusions . . . 49
3. SHAPELET ANALYSIS OF OCULAR CHANGES FOR MODELING VISUO-COGNITIVE BEHAVIOR IN SCREENING MAMMOGRAPHY . . . 52
3.1 Introduction . . . 52
3.1.1 Breast Cancer Screening . . . 52
3.1.2 Performance in Breast Cancer Screening . . . 53
3.1.3 Mental Workload and Task Performance . . . 56
3.1.4 Measures of Eye-Movement and Mental Workload . . . 57
3.1.5 Performance Prediction in Screening Mammography . . . 59
3.2 Materials and Methods . . . 59
3.2.1 Image Dataset . . . 59
3.2.2 Experimental Procedure . . . 60
3.2.3 Data Pre-Processing . . . 64
3.2.4 Measurements and Feature Extraction . . . 65
3.3 Analysis and Results . . . 71
3.3.1 Statistical Pattern Analysis . . . 71
3.3.2 Predictive Models Utilizing Aggregate Measures of Eye Events 76 3.3.3 Predictive Models from Time Series Shapelets . . . 77
3.3.4 Classification Results . . . 79
3.3.5 Discussions . . . 81
4. BIOMETRIC IDENTIFICATION OF IMAGE READER AND EXPER-TISE IN RADIOLOGY . . . 83
4.1 Introduction . . . 84
4.2 Related Work . . . 87
4.2.1 Sketch Gesture Recognition . . . 87
4.2.2 Eye Movement as a Biometric . . . 91
4.3 Materials and Methods . . . 93
4.3.1 Image Database . . . 93
4.3.2 Experimental Procedure . . . 94
4.3.3 Eye Events . . . 96
4.3.4 Encoding Saccadic Movements . . . 101
4.3.5 Rubine’s Gesture Recognition Features . . . 103
4.3.6 Long’s Gesture Recognition Features . . . 111
4.3.8 Alamudun and Hammond’s Vision-Based Gesture Recognition
Features . . . 116
4.3.9 Time Series Shapelets . . . 116
4.4 Analysis and Results . . . 118
4.4.1 Univariate Feature Analysis . . . 118
4.4.2 Classification Results . . . 127
4.4.3 Comparison with Alternative Methods . . . 128
4.5 Discussion . . . 130
4.6 Conclusions . . . 132
5. DISCUSSION . . . 134
5.1 Fractal Dimension of Scanpath . . . 134
5.2 Time Series Shapelet Analysis of Eye-Events . . . 135
5.3 Gesture Recognition of Saccadic Eye Movements . . . 137
REFERENCES . . . 139
APPENDIX A. REMOVAL OF SUBJECT-DEPENDENT AND ACTIVITY-DEPENDENT VARIATION IN PHYSIOLOGICAL MEASURES OF STRESS181 A.1 Abstract . . . 181
A.2 Introduction . . . 182
A.3 Background . . . 183
A.3.1 Stress and the Human Body . . . 183
A.3.2 Physiological Stress Response . . . 184
A.3.3 Factors Affecting Physiological Stress Response . . . 184
A.4 Reducing Individual Differences and Effects from Physical Activity . 186 A.4.1 Orthogonal Signal Correction . . . 186
A.4.2 Linear Discriminant Correction . . . 189
A.5 Materials and Methods . . . 191
A.5.1 Wearable Sensor System . . . 192
A.5.2 Experimental Setup . . . 192
A.6 Results . . . 196
A.7 Discussion and Conclusions . . . 202
APPENDIX B. TIME SERIES SHAPELET ANALYSIS . . . 206
APPENDIX C. MAMMOGRAPHIC CASES FROM THE DIGITAL DATABASE FOR SCREENING MAMMOGRAPHY . . . 209
LIST OF FIGURES
FIGURE Page
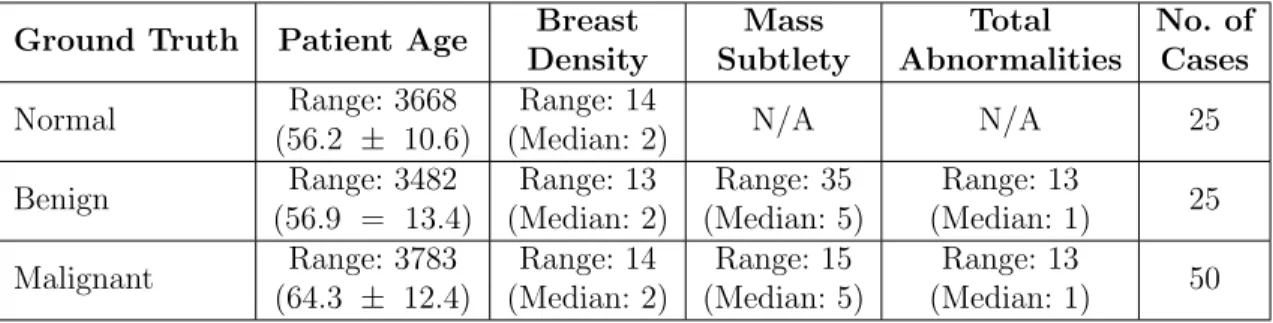
1.1 An illustration of the human eye (From Rhcastilhos [53]). . . 17 1.2 An illustration of the human eye muscles that generate the
verti-cal up-down movements (superior and inferior rectus), the horizontal outward-inward movements (lateral and medial rectus), and the tor-sional rotating movement (superior and inferior oblique)(From Open-Stax College, [52]). . . 19 1.3 Superior view of muscles responsible for horizontal (yaw), vertical
(pitch), and torsional (roll) eye movements. . . 20 1.4 Eye movements during the first 2 seconds of viewing a picture. (based
on data from Yarbus [298]). . . 22 2.1 Image reader outfitted with eye-tracking apparatus reviewing a
mam-mographic case. . . 36 2.2 Gaze data collected for a single reader synthesized in the 6 possible
configurations for data representation. . . 41 2.3 Averaged complexity of visual search across case and reader
proper-ties: (a) case pathology (normal, benign, and malignant); (b) breast density (fatty, fibroglandular, and heterogeneous/dense); and (c) im-age reader experience level: new Radiology residents (NR); advanced Radiology residents (AR), and expert radiologists (E). . . 43 3.1 Image reader outfitted with eye-tracking apparatus reviewing a
3.2 Sympathetic and parasympathetic innervation of the pupil. (1) sym-pathetic fibers arise from the hypothalamus, (2) the stellate ganglion, (3) synapse at the superior cervical ganglion, (4) sympathetic plexus around internal carotid artery, (5) oculomotor nerve (Cranial nerve 3) fibers synapse at the ciliary ganglion (blue), (6) Short ciliary nerves from ciliary ganglion carrying parasympathetic supply to sphincter pupillae (green), (7) Trigeminal fibers (Cranial nerve 5) relay in cil-iary ganglion and carry sympathetic supply (yellow), (8) Long cilcil-iary nerve fibers (from the ophthalmic branch of cranial nerve 5) carrying sympathetic supply to the dilator pupillae, (9) Sphincter pupillae (cir-cular fibers) and Dilator pupillae (radial fibers) muscles of the pupil. (From Rajan [227]) . . . 65 3.3 Change (mm) in pupil diameter from a 1s baseline preceding picture
onset when viewing erotic, neutral, or violent scenes. Inset: For scram-bled pictures, the light reflex did not differ as a function of original picture content. (Reprinted with permission from Henderson et al. [111]) 67 3.4 An illustration of the human eye muscles that generate the
verti-cal up-down movements (superior and inferior rectus), the horizontal outward-inward movements (lateral and medial rectus), and the tor-sional rotating movement (superior and inferior oblique)(From Open-Stax College, [52]). . . 69 3.5 Percentage change in pupil dilation. (a) case pathology (normal,
be-nign, and malignant); (b) breast density (fatty, fibroglandular, and heterogeneous/dense); and (c) image reader experience level: new Ra-diology residents (NR); advanced RaRa-diology residents (AR), and ex-pert radiologists (Exex-pert). . . 72 3.6 Aggregated performance results for predicting ground truth pathology,
readers’ diagnostic interpretation, and readers’ performance. . . 80 4.1 Superior view of muscles responsible for horizontal (yaw), vertical
(pitch), and torsional (roll) eye movements. . . 98 4.2 Sample saccadic movements recorded during a mammographic reading. 102 4.3 A sample saccade from a mammographic case reading. The x, y, and
time values were sampled at 60Hz from a head-mounted eye tracking device. . . 103 4.4 Rubine’s features capture a multitude of properties associated with
4.5 The θi value for a point pi on a saccade. . . 108 4.6 Illustrates the distribution of a subset of features in our dataset. (a)
Histogram showing distribution of features across all image readers. (b) Average and standard deviation of features for each image reader. 119 4.7 Illustrates the distribution of a subset of features in our dataset. (a)
Histogram showing distribution of features across all image readers. (b) Average and standard deviation of features for each image reader. 120 4.8 Illustrates the distribution of a subset of features in our dataset. (a)
Histogram showing distribution of features across all image readers. (b) Average and standard deviation of features for each image reader. 121 4.9 Illustrates the distribution of a subset of features in our dataset. (a)
Histogram showing distribution of features across all image readers. (b) Average and standard deviation of features for each image reader. 122 4.10 Illustrates the distribution of a subset of features in our dataset. (a)
Histogram showing distribution of features across all image readers. (b) Average and standard deviation of features for each image reader. 123 4.11 Illustrates the distribution of a subset of features in our dataset. (a)
Histogram showing distribution of features across all image readers. (b) Average and standard deviation of features for each image reader. 124 A.1 Wearable sensor prototype. (a) Subject wearing complete system with
visible holster unit, two electrodes placed on the proximal phalanges of middle and index finger, the wireless EDA node is placed on the wrist band. (b) The HRM is located on the center of the chest. (c) Respiration sensor and transmitter is located on the left side of the chest (from [3]) et al. [3]). . . 191 A.2 Experimental protocol The CWT, CIT and DB tasks lasted 5, 3 and
2 minutes respectively with a 2 minute break between tasks. Each task was repeated during all four sessions. . . 193 A.3 Android smartphone platform based tasks. (a) CWT task word name
prompt. (b) CWT task ink color prompt. (c) CIT task. (d) DB task. . 195 A.4 Android smartphone platform based tasks. (a) CWT task word name
A.5 Comparison of (a) average NN interval (AVNN) and (b) average skin conductance level (SCL) across all subjects. . . 198 A.6 Average classification rate for subject-independent case (µ = 0.67,
σ = 0.19). . . 199 A.7 Average classification rate for activity-independent case (µ = 0.66,
σ = 0.14). . . 200 A.8 Average classification rates for subject-and-activity independent case. 201 A.9 Principal component analysis of task response (a) before correction
LIST OF TABLES
TABLE Page
1.1 Cancer prognosis five years after diagnosis by prognostic characteris-tics and age (Five-Year relative survival). (From Mariotto et al. [166]) 3 1.2 Basic measures of positional eye movement events. . . 22 2.1 Specifications of the 100 four-view screening mammograms used in the
study. . . 33 2.2 Summary of characteristics of study participants. . . 35 2.3 Possible configurations for a combined two-dimensional data
represen-tation. . . 37 2.4 Enumeration of dual display viewing arrangements and corresponding
images on each monitor. . . 38 2.5 Mass detection performance: mass-present (M) vs. mass-absent (N) for
new residents (NR), advanced resident (AR), and expert (E) radiologists. 41 2.6 Multi-factor ANOVA test results for possible image configurations . . 46 2.7 Multi-factor ANOVA test results for case based image configurations. 47 2.8 Pairwise comparisons of groups of case pathology, breast density,
and radiologists experience level . . . . . . 48 2.9 Pairwise comparisons of individual readers (new resident resident (NR),
advanced resident resident (AR), and expert (E)). . . 49 3.1 Specifications of the 100 four-view screening mammograms used in the
study. . . 59 3.2 Summary of characteristics of study participants. . . 61 3.3 Possible configurations for a combined two-dimensional data
represen-tation. . . 63 3.4 Basic measures of positional eye movement events. . . 70
3.5 Summaryof eye movementfeatures. . . 73 3.6 Results for predicting ground-truth pathology, reader interpretation,
and reader performance using eye movement features (Feye). . . 77 3.7 Results for predicting ground-truth pathology, reader interpretation,
and reader performance using time series shapelets from percentage change in pupil size. . . 78 4.1 Specifications of the 100 four-view screening mammograms used in the
study. . . 93 4.2 Summary of characteristics of study participants. . . 95 4.3 Summary of basic eye events . . . 99 4.4 Top ten results from model-based and gain ratio-based ranking. . . . 126 4.5 Final feature subset. . . 126 4.6 Detailed performance metrics of predictive model for biometric
iden-tification using sketch-based features from eye movement. . . 127 4.7 Confusion matrix for predictive model using sketch-based features
from eye movement. . . 128 4.8 Detailed performance metrics of predictive model for experience-level
using shapelet-based features from pupillary changes. . . 129 4.9 Confusion matrix of predictive model for experience level using
sketch-based features from eye movement. . . 129 4.10 Detailed performance metrics of predictive model for biometric
iden-tification using shapelet-based features from pupillary changes. . . 130 4.11 Confusion matrix of predictive model for biometric identification using
shapelet-based features from pupillary changes. . . 131 A.1 Summary of experimental protocol. . . 194 A.2 Features extracted from psycho-physiological sensors. . . 196 C.1 Volume and corresponding case number for malignant cases from DDSM209 C.2 Volume and corresponding case number for benign cases from DDSM 210
1. INTRODUCTION
Diagnosis in medical practice is a broader term describing the process of gath-ering information about a patient, processing the acquired information, and finally aggregating this information to classify the patients condition into one of many well-defined category. The specificity of the latter category enables medical practitioners to make more meaningful medical decisions about treatment and prognosis. In short, medical diagnosis described in computational terms, is a subroutine, which involves data acquisition, data processing, and class identification.
The medical diagnostic process generally begins with a process of information gathering and information processing. Information about a patient is acquired by probing patient history and a general physical exam. With technological and com-putational advancements over time, medical practitioners now have access to more sophisticated techniques, such as medical imaging, for obtaining previously unavail-able direct information about the internal anatomy of a patients body. More formally, medical imaging describes the process of acquiring a visual representation of the in-ternal structures within a patients body (underneath the skin).
Medical imaging has revolutionized health care over the past several decades. Advances in imaging technology have led to the development of numerous image data acquisition modalities, such as X-ray radiography, magnetic resonance imaging (MRI), medical ultrasonography, endoscopy, elastography, tactile imaging, thermog-raphy, medical photogthermog-raphy, computed tomogthermog-raphy, and a large collection of nuclear based functional imaging techniques (such as positron emission tomography). These data allow for the characterization of anatomical state, metabolic processes, and other functions pertaining to body tissues, the assessment of which, aid the
prac-titioner in determining if an abnormality is present, where it is located, and other important case specific characteristics.
Imaging technology requires specialized training for data acquisition, and more importantly, for data interpretation. One area of speciality that focuses on the latter is radiology. Radiology is a branch of medicine that specializes in application of medical imaging technology in the diagnoses and treatment of injuries or diseases. Medical images are typically acquired by a radiographer (or radiologic technologist), while the image reading and interpretation is performed by a diagnostic radiologist (or radiographer).
One area of medical diagnosis where the application of medical imaging has had a significant impact is in cancer diagnosis and treatment. Cancer, in medicine, refers to a class of genetic diseases characterized by an uncontrolled growth and subsequent spread of abnormal cells. Cancerous cells (tumors) are caused by changes in the genes that control cell function, particularly those that control cell growth and reproduc-tion. These cancerous cells develop the potential, over time, to invade or spread to other parts of the body (metastasis), a stage at which the patient prognosis becomes terminal.
Breast cancer is one of the more prevalent forms of cancer among the female population globally. Most patients who suffer from breast cancer remain unaware of the disease because there are seldom any physically visible signs of the disease; a fact that holds true for other forms of cancer. For this reason, breast cancer is primarily diagnosed through an annually recommended mammographic screening procedure performed by a radiologist. Mammography is a medical imaging technique that uses low-energy X-Rays (approximately 30KV p) to capture images of the human breasts. These images, known as mammograms, are then examined by radiologists for the presence of cancerous growths.
Table 1.1: Cancer prognosis five years after diagnosis by prognostic characteristics and age (Five-Year relative survival). (From Mariotto et al. [166])
All ages (%) 20−44yrs (%) 45−54yrs (%) 55−64yrs (%) 65−74yrs (%) 75+yrs (%) All stages 89 (89−90) 88 (87−88) 90 (90−91) 90 (90−90) 91 (90−91) 87 (87−88) ER positive 94 (94−95) 93 (92−93) 94 (94−95) 94 (94−94) 95 (94−95) 96 (95−97) ER negative 79 (78−79) 79 (78−79) 80 (79−81) 80 (79−81) 79 (78−81) 72 (70−74) Stage I 100 + 98 (97−98) 99 (99−99) 100 (99−100) 100 + 100 + ER positive 100 + 99 (98−99) 100 (99−100) 100 + 100 + 100 + ER negative 97 (96−97) 94 (93−95) 96 (95−97) 97 (95−97) 98 (96−99) 100 + Stage II 93 (92−93) 92 (91−93) 94 (93−94) 94 (93−94) 93 (92−93) 91 (89−92) ER positive 96 (96−97) 96 (95−96) 97 (96−97) 97 (96−97) 96 (95−96) 96 (94−97) ER negative 84 (83−85) 85 (84−87) 86 (84−87) 86 (84−87) 83 (80−85) 74 (70−78) Stage Ill 73 (73−74) 75 (74−77) 78 (77−79) 75 (74−76) 73 (71−75) 58 (55−61) ER positive 81 (80−82) 84 (82−86) 85 (84−87) 83 (82−85) 79 (77−81) 65 (62−68) ER negative 59 (57−60) 59 (57−62) 63 (61−65) 59 (56−62) 58 (54−62) 45 (41−50) Stage IV 24 (23−25) 32 (29−35) 28 (25−30) 23 (21−25) 23 (21−26) 16 (14−19) ER positive 31 (29−32) 40 (36−45) 35 (32−38) 29 (27−32) 31 (28−34) 22 (19−26) ER negative 16 (14−17) 21 (16−25) 17 (14−20) 16 (13−19) 14 (10−18) 10 (7−14)
The mammographic screening process is not without flaw. Recent studies show the process as being plagued with low sensitivity (68−92% range), with a notably high type II error rate (false-negative) of 29% in visually detectable cancers [297, 138, 225]. Approximately 50% of these inaccuracies result from human error. While type I errors (false-positives), can have adverse negative impact/effect on the mental health and well-being of the patient, the occurrence of a type II error has a significant impact on the patients prognosis. A missed detection of a cancerous growth in its early stages, during which treatment outcomes result in higher chances of patient survival (as high as 100%), will likely result in a detection during later stages of the cancer (when it begins to manifest physically visible signs), which have a marked lower patient survival rate often as low as 18% (see Table 1.1).
A significant amount of research effort is currently dedicated to addressing these challenges. One body of research focuses on understanding the current diagnostic process and developing tools to improve performance. Other areas of equal impor-tance involve developing new processes that include advanced imaging techniques, improved computer vision algorithms for image understanding, and combining
hu-man beings and computing systems for more efficient and accurate results (computer-aided diagnostic systems).
Understanding the current diagnostic process affords improved patient outcomes in the short run. Intuitively, the mammographic screening process can be modelled as a visual search problem: a radiologist’s task is search for a cancerous growth in a mammographic image. This requires an investigation into the radiologist’s visual behavior and underlying cognitive process during the screening process. To this end, our research focuses on the application of visual sensory modalities (an eye track-ing device), to capture radiologists’ visual behavior durtrack-ing the diagnostic screentrack-ing process. Once captured, we attempt to understand underlying visual and cognitive behavioral processes during the screening process and how these two factors combi-natorially affect diagnostic outcomes.
The main area of inquiry for this research is in the development of eye-tracking algorithms to accurately quantify visuo-cognitive behavior of radiologists during the mammographic screening process and ultimately improve diagnostic accuracy in mammography. This research work has four objectives: (i) model radiologists’ over-all search behavior; (ii) development of spatial and temporal descriptors of visual search behavior during mammographic screening; (ii) evaluation of the efficacy of these features in predicting factors associated with diagnostic performance.
The contributions of the results of this research to the field of computational sciences is the development of eye tracking algorithms for interpreting the behavior or radiologists during mammographic cancer screening and individualized computa-tional models for predicting diagnostic performance. These contributions provide a the foundation for intelligent computing systems that will assist radiologists in man-aging performance. In addition, intelligent computing systems are applicable in the educational environment to improve training methodology for Radiology residents.
1.1 Overview of Mammography
The early detection of breast cancer affords the one diagnosed with a wider variety of treatment options and an improved chance of survival. There are several medi-cal imaging options available for use in examining human breasts. These include X-Ray imaging, magnetic resonance imaging (MRI), and positron emission tomog-raphy scan among others. The most commonly used method for breast imaging is known as mammography. Mammography is a medical imaging technique that uses low-energy X-Rays (approximately 30KV p) to capture a visual representation of the human breast. These visual representations, which can be film or digital, are subse-quently examined by a trained specialist (board certified radiologists) to determine the presence of any cancerous growths.
There are two types of mammographic examinations performed by radiologists: screening mammography and diagnostic mammography. Screening mammograms can be used to check for breast cancer in women who are absent of physically visible signs or symptoms of the disease. A screening mammogram generally involves four views from two X-Ray images of each breast: the craniocaudal (CC) view and the mediolateral oblique (MLO) view [119]. These x-ray images make it possible to detect tumors that cannot be felt. Screening mammograms also capture microcalcifications (tiny deposits of calcium) that sometimes indicate the presence of a cancerous growth. In contrast, a diagnostic mammogram is administered to a patient who has previ-ously demonstrated abnormality in previous clinical inquiry, such as the presence of a lump, a thickening of the skin of the breast, nipple discharge, breast pain, or other physically visible signs on the breast [119]. These abnormalities may be symptoms of some other disease or benign condition however. Additionally, a diagnostic mam-mogram may be administered to further evaluate changes found during a screening
mammogram or to view breast tissue when a screening mammogram is otherwise unobtainable due to special circumstances. As with screening mammography, diag-nostic mammography also involves four image views from X-Rays images of both breasts. In contrast, diagnostic mammography may offer a more in-depth view at specific areas of the breasts that are of interest.
A large number of research studies have been conducted to assess the impact of mammographic examinations on breast cancer [117]. The adoption of screening mammography for example, has led to an increased early detection rate for breast cancer and a subsequent reduction in morbidity and mortality rates [189]. In a study to determine the efficacy of screening mammography, Kerlikowske et al. performed a meta-analysis on studies reported between January 1966 to October 1993 [134]. They found that the screening mammography significantly reduced breast cancer mortality in women aged 50 - 74 years after 7 to 9 years of follow-up, regardless of screening interval or number of mammographic views used in each screening session. However, Kerlikowske et al. found no reduction in breast cancer mortality in women aged 40 - 49 years after 7 to 9 years of follow-up [134]. In a more recent study, Narod et al. tracked 50,436 Canadian women aged 40−49 years until the age of 60 for breast cancer morality [187]. They found a small but statistically insignificant increase in the cumulative risk of death from breast cancer between women who were assigned annual mammographic screening and women who were not assigned annual screening before age 60. To assess the impact of mammographic screening on breast cancer mortality in Europe, Broeders et al. performed a meta-analytic review of observational studies published on the subject up till February 2011 [39]. They concluded, based on studies where longitudinal individual data were used, that there was a 25−31% breast cancer mortality reduction in womeninvited for screening, and a 38−48% reduction in women who were actually screened [39]. In similar review of
trend studies of breast cancer mortality in Europe, Moss et al. found a range of 28− 36% reduction in breast cancer mortality in those studies that compared mortality in time periods before and after the introduction of mammographic screening [184]. Despite the well-studied benefits of screening mammography, the process is not without a few major drawbacks that pose significant challenges to the scientific re-search community. Most notable among these challenges is the occurrence of error in the mammographic screening process. The sensitivity of screening mammography varies because of the multitude of methods used in calculating and reporting [240, 23]. However, a general range for sensitivity in screening mammography generally fall be-tween 68−92% [297, 138, 225].
Human error, both perceptual error and interpretation error, in screening and diagnostic mammography is recognized as a significant problem [147, 144, 19]. Bird et al. performed an analysis of 320 cancers found in a population of women (age range 59±0.3), who had undergone mammographic screening between August 1985 and May 1990 [30]. In this study, they categorized missed lesions (false negatives) as cases where: (a) lesion could be seen in retrospect; (b) undetected by first reader, but subsequently correctly identified by second reader (double reading); and (c) a can-cer correctly diagnosed during a mammography examination immediately preceding the pathologic diagnosis, but retrospectively visible, but incorrectly interpreted as negative, on prior mammograms. Bird et al. found that 77 cancers were missed at screening mammography for reasons, which include: having a benign appearance; be-ing present at previous screenbe-ing; only visible in one of the mammographic views of same breast; being located on the site of a previous biopsy; and, in 47% of the cases, from being overlooked [30]. Similar studies conducted over the past few decades have drawn similar conclusions, which on average show human error accounting for nearly 50% of all diagnostic errors [168, 29, 25, 26, 27].
Over time, there have been notable attempts to improve the sensitivity of di-agnostic performance in screening mammography, including the supplementation of mammographic information through complimentary modalities such as ultrasound and magnetic resonance imaging.
Independent double reading of screening mammograms, where two radiologists perform readings of a screening mammogram independently to form a consensus, were proposed and adopted. Many studies have shown the effectiveness of this method in increasing the number of detected cancers [8, 266, 41, 66]. However, this process is associated with an increased workload and cost burden on the radiology community. To improve image quality, Rangaraj et al. analyzed the effectiveness of an adap-tive neighborhood contrast enhancement technique to improve sensitivity in mammo-graphic screening [230]. In this work, Rangaraj et al. evaluated the reciever operating characteristics (ROC) for six experienced radiologists on a corpus of 300 screen-film mammograms consisting of 222 digitized and enhanced mammograms, and 78 un-processed mammograms. In their results, Rangaraj et al. conclude that radiologists’ performance on images with image enhancements was significantly better in compar-ison with original film and digitized images [230].
Thanks to advancements in, and integration of, imaging and computing technol-ogy, computer-aided detection and diagnostic systems (CAD), have been developed to assist radiologists in the image acquisition, presentation, and diagnostic inter-pretation stages of mammographic screening. Research shows that the use of CAD systems have significantly improved the detection of breast cancer as measured by an increase in the number of cancers detected and increases in radiologists’ recall rate 21.2% [74, 38, 183, 265].
1.2 Computer-Aided Detection and Diagnosis of Breast Cancer Computer-aided detection and diagnosis, in a broad sense, integrates imaging, image processing, computing, machine learning, and artificial intelligence, with the primary aim of improving patient outcomes. The conventional definition for CAD, as a diagnosis that is made by a radiologist who uses the output from an intelligent computing system analysis of a preprocessed medical image as a “second opinion” in the process of detecting lesions and making diagnostic inferences, however, no longer suffices. Over the past several decades, CAD related research interest has grown significantly and, because of the challenging nature of mammography, spurred significant collaborative multidisciplinary research combining the areas of Radiology, Engineering and Computer Science.
While the impact of research developments in CAD are well documented [265, 15, 35, 6, 172], and a number of commercial systems are already available in the United States [231], research and development of new algorithms and technology is still very active. The following subsections highlight the major areas of CAD research.
1.2.1 Computer-Aided Methods for Improved Detection of Masses and Calcification Clusters
Calcifications are an accumulation of minerals (such as calcium) in body tissue, which form as a result of abnormal calcium deposits in soft tissue, causing it to harden. These calcium deposits can be found scattered throughout the tissues of the mammary gland as macrocalcifications and microcalcifications. Microcalcifica-tions (MCs) usually show up on mammograms as small bright spots. The presence of clusters of microcalcifications are an important indicator of malignancy, and they appear in 30−50% of mammographic cases [128, 248]. Since microcalcifications ap-pear brighter than surrounding tissue, a number of methods taking advantage of this
fact have been proposed. One approach to using these properties is the use of image enhancement methods to improve cluster identification. Mass lesions, however, are a specific type of lesion that have volume and occupy a clearly defines space. Masses found during mammographic screening are typically described according to shape, edge characteristics, and density (the number of fat cells present and the density of suspicious cells) [197]. Majority of mass detection algorithms take advantage of the spatial characteristics of a masses as a differentiator from non-masses.
Nishikawa et al. for example, developed a novel processing algorithm to automat-ically detect microcalcification clusters [191]. Their algorithm involves three main stages: denoising, filtering, and final classification. First, a difference-image filtering technique, using linear filters, is applied to suppress normal anatomical structure of the breast contained within the image, which for microcalcification cluster identi-fication are considered noise. In the second stage, a gray-level threshold based on a full-image histogram is applied, followed by morphological erosion, and finally an adaptive localized gray-level thresholding is used. Resulting in a set of candidate mi-crocalcification cluster locations. A final selection is achieved through a combination of spectral analysis, Minkowski distance based clustering analysis, and image prop-erties (size, shape, pixel intensity etc.). Their algorithm was able to detect 87% of true clusters when tested on a set of 78 mammograms (50% of which contain clusters of microcalcifications) [191].
McLoughlin et al. proposed a noise model based on an estimation of the quan-tum noise inherent in X-ray imaging [174]. In this work, McLoughlin et al. assume that baseline noise-level in mammograms is as a result of the limited X-ray quanta. Following from this, the quantum noise is estimated as a function of gray level using a square-root model based approach. The local image contrast is improved by decou-pling noise–gray level dependencies [174]. More recently , Panda et al. [202] developed
an image processing algorithm to automatically detect microcalcifications and mass lesions. In their work, Panda et al. proposed a three step process of region of interest identification (ROI), two-dimensional wavelet transformation, and feature generation based on Otsu threshold [200], used to automatically perform clustering-based image thresholding [245]. In summary, the methods discussed above apply standard image processing techniques for pre- and post image processing for subsequent detection.
In [304], Yu et al. presented system designed to detect clustered microcalcifi-cations in digitized mammograms. The proposed two-staged system involved the application of statistical and wavelet features for segmentation, followed by detec-tion of microcalcificadetec-tion by a neural network implementadetec-tion using a total of 31 features extracted from the first step. They report a 90% sensitivity in the detection of microcalcification clusters in a database of 40 mammograms [304].
Campanini et al. developed a novel method in which the mammographic image is encoded as using a multiresolution overcomplete wavelet representation, and sub-sequently processed through a two-stage machine learning algorithm consisting of a two sequential support vector machines and a final ensemble classifier [43]. In this work, they reported a sensitivity of up to 80% from the DDSM database. Jen et al. [122] developed a two step method for detecting tumorous masses. First, they apply gray level quantization on segmented images for feature extraction, and subsequently they apply principal component analysis to determine weights on each of the features extracted. Jen et al. report a sensitivity of 88% and 86% on two separate datasets. Choi et al. [47] proposed a novel computer-aided detection framework to improve sensitivity of mass detection by combining an unsupervised and supervised machine learning algorithms to improve identification of regiouns-of-interest (ROI), combined with an ensemble classifier. Their results suggest a 70% reduction in false-positive detections, but a 4.6% loss in sensitivity [47].
1.2.2 Computer-Aided Detection of Architectural Distortions and Bilateral Asymmetry Anomalies in Mammograms
A second general area of research in computer-aided detection and diagnosis of breast cancer is in the identification of structural abnormalities in anatomy of the breasts, which are not physically conspicuous as is the case with microcalcifications and mass lesions. The first type of anomaly in this group are architectural distortions. Architectural distortions rank as the third most common sign of non-palpable breast cancer found in mammograms [229], which due to subtlety and apparent arbitrary physical characteristics, are often missed during mammographic screening [136]. Ac-cording to the Breast Imaging Reporting and Data System (BI-RADS), architectural distortion is defined as a distortion in the normal architecture of breast in the ab-sence of a physically visible mass [198]. “This includes spiculations radiating from a point and focal retraction or distortion at the edge of the parenchyma” [198].
Architectural distortion accounts for 12−45% of missed breast cancers in screen-ing mammography [297]. In a review of 234 screen-detected and interval cancer cases (aged 44−84 years) of screening and diagnostic mammogram cases between 1991 and 1996, Broeders et al. concluded that detection of architectural distortion and non-spiculated high-density masses can lead to an improvement in the prognosis of breast cancer patients [40]. Deducing from this, there have been a number of attempts to characterize and quantify architectural distortion. Guo et al. investigated the use of Hausdorff fractal dimensions with an support vector machine classifier to character-ize architectural distortions [81]. They achieved an accuracy of 72.5% in identifying architectural distortions in a set of 40 regions of interest (ROIs). Tourassi et al. used fractal dimension to characterize architectural distortions patterns in ROIs. The area under the receiver operating characteristics (ROC) curve was 0.89 on a dataset of
1500 ROIs (112 with architectural distortions).
The second type of anomaly is generally referred to as bilateral asymmetry. Ra-diologists use a perceived difference in symmetry between the left and right mammo-grams of a given patient as an indicator to diagnose breast cancer [69]. According to BI-RADS bilateral asymmetry indicates a difference in volume or density of breast tissue in the absence of a distinct mass, or more prominent ducts, in correspond-ing areas between the left and right breasts of the same patient [198]. In a study of 252 asymptomatic women who had normal mammography but went on to de-velop breast cancer [243], Scutt et al. found measures of bilateral asymmetry to be strong predictors of breast cancer. In [181], Miller and Astley new methods to detect bilateral asymmetry by comparing pairs of corresponding anatomical struc-tures, which are detected using automatic segmentation of breast tissue types. In a more recent work [44], Casti et al. investigated differences structural informa-tion of automatically detected regions using spherical semivariogram descriptors and correlation-based similarity metrics in spacial and wavelet domains. Using features extracted from gray-scale values and magnitude and phase response of Gabor filters, they evaluate the performance of their method with linear discriminant analysis, Bayesian classifier, and artificial neural network with radial basis functions, on 188 two-view mammograms. They reported an accuracy of up to 0.94, and a sensitivity and specificity score of 1 and 0.88 respectively.
1.2.3 Computer-Aided Detection For Real-Time Support in Mammography
In this section, we discuss alternative applications of computer-aided detection re-search in mammography. Computer-aided detection methods discussed to this point remain decoupled from the mammographic screening and diagnostic process, where computing methods are applied before or after the mammographic process to verify
or question diagnostic decision. In contrast, some research studies have proposed the use of computer-aided systems in parallel to enhance the mammographic process. Karssemeijer et al. [129] developed an interactive mammographic screening system, which enabled the image reader to probe regions of interest on the image for relevant CAD information. Using a corpus of 60 cases, they tested their system on two ra-diologists and four non-rara-diologists and found a significant increase in performance, from 28.27% without CAD to 38.03% with the use of the interactive CAD system. Samulski et al. developed a similar customized workstation in which readers were able to probe mammographic image locations for relevant CAD information [238]. They tested their system with four screening radiologists, who were asked to review 120 cases. A significant (p= 0.012) improvement in detection performance was reported with an improvement in average sensitivity from 25.1% without CAD, to 34.8% in CAD-assisted sessions.
Content-based image retrieval methods have been applied as diagnostic tools to aid radiologists by providing data from previous cases, which are relevant to a cur-rent case based on computed similarities of image content. Qi and Snyder applied simple image pixel properties (including shape, size, and intensity) to quantify sim-ilarity between images [264]. Tourassi et al. [269] evaluated the use of information-theoretic image similarity measures in content-based retrieval and detection of masses in screening mammograms. They compared the precision and detection accuracy of eight entropy-based similarity measures on a database of 1820 mammographic ROIs. Their results showed image similarity measures can be used for semantic similarity, and the presence of a masses.
1.3 Image Perception Research in Screening Mammography In previous sections, we introduced research work in computer-aided detection in mammography. To summarize, the class of research discussed focused on compu-tational understanding of mammograms for the purpose of improving performance outcomes in mammography. A second important class of research focuses instead on computational understanding of the observer component for the purpose of improving diagnostic performance in mammography [142]. We define diagnostic performance of the human in mammography as a measure of how well the subject is able to predict the presence or absence of a cancer, and for the latter, how well the extent or mag-nitude of the disease or condition is measured. Deducing from this, we can conclude that perception and cognition serve as the primary drivers of the diagnostic process, and ultimately predict diagnostic performance. Therefore to understand and improve diagnostic performance (i.e. to reduce human error), it follows that we must examine both the perceptual and the cognitive processes during mammography. Since the two sources of human error screening mammography: perceptual error and interpretation error, account for nearly 50% of missed diagnosis [147, 19], a large body of research has been directed toward understanding how these errors occur and applying this knowledge to provide feedback during the diagnostic process, and to improve training methodology.
Nodine et al. [193] investigated the correlation between number of years of ex-perience, training, and mammography expertise. In this study, they investigated the effect of perceptual and cognitive skills in both detection and interpretation in mammography by analyzing the performance of three categories of image readers (expert radiologists, Radiology residents, and mammography technologists). Nodine et al. found that experts had the best performance, and residents had a significantly
lower performance, which however, was equivalent to that of mammography tech-nologists. They concluded that poor performance by residents resulted from a lack of perceptual-learning experience during mammography training, and recommended a systematic mentor-guided training and feedback to improve image perception and decision making [193]. The use of specialized technologies, such as eye tracking de-vices, to record eye position position data during mammography, enable us to develop psycho-physiological models useful in understanding how visual and cognitive errors occur, and ways to reduce their occurrence.
1.4 Eye Tracking
Eye tracking refers to a process of measuring the movement of the eye relative to the head. Eye tracking devices are bio-sensors that measure psycho-physiological response through changes in configuration of the human eye. These changes include positional measures such as visual fixation, saccadic movements, and scanpath, and non-positional measures such as blinks and pupil dilation and constriction. Using data from eye-tracking sensors, we can model human perception, cognitive processes, and responses to external stimuli.
Eye tracking technology has experienced improvement in precision, capability, and affordability. This trend has fostered the popularity of eye tracking both as a research tool and an interaction modality in a large variety of disciplines. Further-more, eye tracking is one of the best noninvasive methods which provide a window into users’ visual and cognitive processes relating to response and intent [64] [163].
1.4.1 Visual Perception
The human eye perceives light rays through the cornea. the cornea is the clear, transparent front covering which, acting as a lens, admits light and begins the re-fractive process. It also keeps foreign particles from entering the eye. The pupil is an
adjustable aperture in the center of the iris that controls the intensity of light per-mitted to strike the lens. The iris turns the image upside down in the lens and then projects it onto the back of the eyeballthe retina. The lens focuses light through the vitreous humor, a clear gel-like substance that fills the back of the eye and supports the retina.
The retina is filled with light-sensitive cells, called cones and rods, which trans-duce the incoming light into electrical signals sent through the optic nerve to the visual cortex for further processing. Cones are sensitive to high spatial frequency (visual detail) and provide color vision. Rods however, are very sensitive to light, and therefore support vision under dim lighting conditions
A small area at the bottom of Figure 1.1, known as the fovea, which spans less than 2◦ of visual field, has an extremely dense concentration of cones, while they are very sparsely distributed in the periphery of the retina. This results in our having full acuity only in this small area, roughly the size of a thumb nail at arms length. This has the implication that in order to see a selected object sharply, like a word in a text, we therefore have to move our eyes, so that the light from the word falls directly on the fovea; a process known as foveating. Only when we foveate on a word or object can we read or see it sharply.
For video-based measurement of eye movements, both the pupil and the cornea are very important. Though less known, the cornea covers the outside of the eye, and reflects light. The reflection visible in a person’s eyes comes from the cornea. When tracking the eyes, we are interested in a single reflection. Because visible light produces numerous reflections, to avoid all natural light reflections, we record in infrared by illuminate the eye with one (or more) infrared light sources.
Figure 1.2: An illustration of the human eye muscles that generate the vertical up-down movements (superior and inferior rectus), the horizontal outward-inward movements (lateral and medial rectus), and the torsional rotating movement (superior and inferior oblique)(From OpenStax College, [52]).
1.4.2 Eye Events
Eye events refer to voluntary or involuntary change in the configuration of the eye, which may or may not constitute actual movement of the eye (e.g. pupil dilation or constriction), but which help the subject to acquire, fixate or track visual stimuli. The eyes are able to move through the coordinated activity of a system of six muscles (see Figure 1.2.
The movement of the human eye is controlled by three pairs of muscles, depicted in Figure 1.2. The combined and coordinated actions of these muscles (depicted in Figure 1.3) are responsible for horizontal (yaw), vertical (pitch), and torsional (roll) eye movements, respectively, and hence control the three-dimensional orientation of the eye inside the head. According to Donders law [273], orientation uniquely decides the direction of gaze, independent of how the eye was previously orientated. Large
(a) Eye movement of lateral rectus muscle (From Lynch [157]).
(b) Eye movement of medial rectus muscle (From Lynch [158]).
(c) Eye movement of inferior rectus muscle (From Lynch [159]).
(d) Eye movement of superior rectus muscle (From Lynch [160]).
(e) Eye movement of superior oblique muscle (From Lynch [161]).
(f) Eye movement of inferior oblique muscle (From Lynch [162]).
Figure 1.3: Superior view of muscles responsible for horizontal (yaw), vertical (pitch), and torsional (roll) eye movements.
sections of the brain control these muscles to direct the gaze to the desired locations in space.
Humans and other primates (including other vertebrates) primarily engage in seven types of voluntary and involuntary eye movement: fixation, saccade, glissade, smooth pursuit, microsaccade, tremor, and drift (see Table 1.2) [115]. Afixationrefers to a state where the eyes remain still (within a small radius) over a period of time, such as is the case when the eyes pause on a given word while reading. Fixating on a point or region is generally considered as a measure of attention to a given position or region of interest, even though this is not always the case. While there is no universally excepted method for detecting fixations, there are established parameters based on ocular physiology, which permit a reasonable criteria for detecting and extracting fixations from gaze data. A typical algorithm to determine a fixation event uses the mean X and Y eye position coordinates measured over a minimum period of time during which the eye does not move more than some maximum amount. This algorithm requires that a point-of-gaze must continuously remain within a small area (approximately within 1-degree visual angle) for some minimum amount of time (approximately 100ms).
The eye is not completely still during a fixation, but exibits three distinct types of micro-movements:tremor,microsaccades, anddrifts [169]. A tremor is a small move-ment of approximately 90 Hz. The exact role of tremors is still a subject of research; it is generally believed to be imprecise muscle control. Drifts are slow movements that shift the eye away from the centre of fixation, while the counter movement, a microsaccades, serves to quickly return the eye back to the center of fixation.
The rapid motion of the eye from one fixation to another, from word to word while reading, for instance, is called a saccade. Saccades are considered the fastest movement the body can produce; typically taking 3080 ms to complete. It is a
gen-Table 1.2: Basic measures of positional eye movement events.
Description Duration (ms) Amplitude Velocity
Fixation 200−300 N/A N/A
Saccade 30−80 4−20◦ 30−500◦/s
Glissade 10−40 0.5−2 20−140◦/s
Smooth Pursuit N/A N/A 10−30◦/s
Microsaccade 10−30 10−400 15−50◦/s
Tremor N/A <10 200/s (peak)
Drift 200−1000 1−600 6−250/s
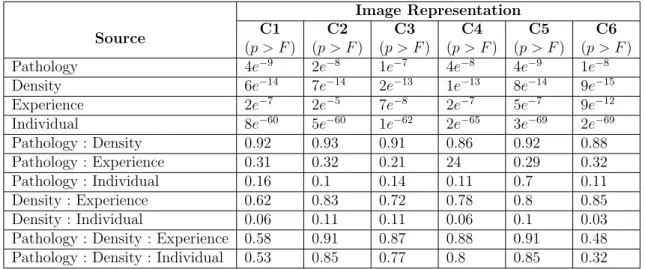
erally held view that human beings are perceptively blind during most of a saccadic event; a phenomena illustrated in Figure 1.4.
Figure 1.4: Eye movements during the first 2 seconds of viewing a picture. (based on data from Yarbus [298]).
An important characteristic of saccades is that they rarely take the shortest path between two points, but instead undergo one of severalshapes andcurvatures. Since a saccade is described in terms of the gaze data between detected fixations, a saccadic event can be computed as gaze points connecting the completion of one fixation to the beginning of the next fixation. The saccadic movement is not mechanically precise, that is they do not stop directly at the intended target, but instead the eye wobbles before coming to a stop. This post-saccadic movement is referred to as glissadic movements or glissade.
The movement of the eye is characteristically different in the case of following or tracking a moving object such as a bird flying across the sky. This type of eye movement is usually slower and referred to assmooth pursuit. The difference between the saccadic and the smooth pursuit movements is that the latter is driven by and requires a moving target, while the former can be made independent of any visiual stimulus. The term scanpath refers to the path (in two-dimensions) of the eye as it moves through a spatial scene. It can be described as the route of oculomotor events through space within a certain timespan. This definition assumes that the path has a beginning and end, and therefore a length. The scanpath can be characterized in one of two ways: (1) the raw gaze scanpath, and (2) the fixation-based scanpath. The raw gaze scanpath refers to all physical movements of the eye within a certain timespan, which encompasses saccades, glissades, microsaccades, etc. However, the fixation-based scanpath is the path formed when all fixations within a certain timespan are connected through a straight line.
1.4.3 Eye Tracking Research in Radiology
There is a wealth of research in the domain of radiology, specifically mammogra-phy, in which eye tracking sensors are used as a tool to gain a better understanding of
visual behavior during the mammographic process. Most research on visual percep-tion in mammography fall under one of two categories: (1) expertise, or (2) diagnostic error.
Research on visual perception and expertise in mammography focuses on how expertise is developed and attempts to characterize visual behavior associated with expertise. This area of research uses eye tracking to measure and quantify observable factors, which differentiate Radiology experts, such as duration and scanpath, from non-experts.
In a seminal work analyzed visual behavior during the reading of chest radio-graphs [150], Kundel and La Follette examined eye movements of a total of 24 sub-jects (including untrained laymen, medical students, Radiology residents, an staff radiologists) for trends that correlated with experience and expertise. Kundel and La Follette found an evolution of search patterns from a localized central pattern of untrained laymen, to a more circumferential pattern exibited by experienced staff radiologists, based on visual observation of the scanpath. Although Kundel and La Follette reported visibly noticeable differences in the scanpath with an increase in ex-perience and expertise, the aggregate measures of fixations fail to characterize these differences.
In a study, analyzing scan strategies in mammography [139], Krupinski examined the eye-event data of six image readers (3 staff mammographers and 3 Radiology residents) for differences in the search behavior of experienced and inexperienced radiologists during a mammographic reading. Using measurements of gaze duration and dwell time, Krupinski found differences between experienced and inexperienced image readers, reporting that more experienced image readers had shorter dwell times and longer gaze duration. However, the findings reported in [139] utilize simple aggre-gate eye-event features on a relatively small population and corpus of mammographic
images. Krupinski also reported that although there were notable differences between groups, these differences were not statistically significant.
To investigate human factors associated with the proficiency of diagnostic pathol-ogy, Krupinski et al. [143] conducted a study examining the eye movements of nine image readers, belonging to one of three experience groups (medical students, Pathol-ogy residents, and pathologists). In this study, each of the nine slide readers took part in a single 45 minute virtual slide reading session, during which they examined 20 breast core biopsy slides while their eye movements were recorded. They found that experienced pathologists had the longest saccade length on average (measured in seconds) compared with residents, who in turn had longer saccade lengths on average compared with medical students.
In addition, they found that the average saccade velocity (measured as length per second) for experienced pathologists was significantly lower than residents, who’s av-erage saccade velocity was higher than the avav-erage velocity for medical students. They also reported that the decreasing trend in saccade velocity with years of perience was consistent within the experienced pathology group, with the most ex-perienced pathologist having a significantly lower average saccade velocity than the less experienced pathologists. The findings by Krupinski et al. suggest distance and velocity measures of eye movements during visual search may also be important fac-tors in differentiating between experienced and inexperienced image readers. These findings are also based on simple aggregate eye-event features, which requirea priori
knowledge about the image stimulus (regions of interest).
Manning et al., examined groups of image observers of varied levels of expertise to investigated the influence of training and experience on visual search behavior and diagnostic performance during the interpretation chest nodule [164]. Eye-event data of four observer groups: eight experienced radiologists, five experienced
radiog-raphers before and after six months training in chest image interpretation, and eight undergraduate radiography students were recorded during detection and localisation of significant pulmonary nodules in posterior-anterior views of the chest. Manning et al. analyzed measures of fixation, saccade, coverage, and gaze duration, and reported finding experienced radiologists have significantly longer saccadic amplitude, a fewer number of fixations, and shorter duration of gaze than all other groups. They also reported the experienced group of radiologists and radiographers after training hav-ing a better detection performance, as measured with an Alternate Free Response Operating Characteristic technique, than the remainder groups. While Manning et al. observed distinct differences in search strategies between the experienced and in-experienced observers, there was no direct link between eye-event features used and task performance.
In a more recent work, Krupinski et al. examined and characterized visual be-haviour of four pathology residents as they progressed through residency training (at the beginning of their first, second, third, and fourth years of residency) [141]. Krupinski et al. recorded eye-event data for each resident while viewing a series of 20 digitized breast biopsy whole slide images at each of the above mentioned stages in their residency training. During the experiments, each resident was tasked to ex-amine the image and select three areas that they would want to zoom in on for further examination and diagnostic detail at a higher resolution. Using numberos-ity and movement measures of fixation, saccade, dwell time, and region of interest (ROI), Krupinski et al. reported finding that as the residents progressed through residency training, there was a decrease in the overall time taken to make decisions about where to zoom, a significant decrease in total fixations, and a decrease in time spent examining areas with no diagnostic value; indicating improved overall search efficiency. The findings presented in [141] are significant in establishing that visual
behavior changes as residents progress through training and gain more experience. However, the study was based on a small population (x = 4). The important find-ings in this study were also based on simple eye-event features, which requirea priori
knowledge about the image stimulus (regions of interest).
In a study on breast cancer detection, Tourassi et al. investigated the relationship between radiologists gaze, diagnostic decision, and image content of mammograms during mammographic cancer screening [267]. They examined eye-event data from six image readers (three breast imaging radiologists and three Radiology residents), and image content of 20 screening mammograms. Using machine intelligence algo-rithms, they developed predictive models combining image content, visual behavior, cognition, and risk of diagnostic error. Their results suggest that machine learning can be utilized in combination with image content and the image reader’s visual behavior to develop user-dependent models for predicting risk of diagnostic error in breast cancer lesion detection and characterization with an accuracy of 59%. The findings reported by Tourassi et al. [267] indicate a major step in linking image con-tent, human perception, human cognition, and human error in mammographic breast cancer detection. However, this work is based on a small population (x = 6) and a very small sample size (n= 20). In addition, the predictive models generated in this work are also dependent ona priori knowledge about the image stimulus (regions of interest).
Although many investigators have examined visual search behavior in the radiol-ogy, and more specifically mammography, the features utilized in these investigations have hitherto been limited to: (1) simple aggregates of positional, duration, or nu-merosity measures of eye-events; (2) based on a posteriori knowledge of regions of interest within the stimulus image.
dur-ing the mammographic screendur-ing process, they do so in a limited fashion. They also fail to capture observable differences such as the differences in gaze path trajectory between experienced and inexperienced image readers as for example is reported in [164], and are therefore insufficient to fully characterize the visual search process.
In this work, we developed novel eye-event primitives and extended existing algo-rithms, inspired from other domains including sketch recognition, data mining, and information retrieval to improve prediction of mammographic case characteristics (such as case pathology and breast parenchyma density), radiologists characteristics (including individual identity and experience level), and risk of diagnostic error.
We have developed an eye-event feature, fractal dimension, which requires no prior knowledge of regions of interest in stimulus image. The fractal dimension, which characterizes the space filling capacity of a pattern, provides a statistical index of complexity of radiologist’s scanpath during mammographic screening. This index, we hypothesize, can accurately characterize the characteristics of a mammographic case, the image reader’s identity and experience, and the risk of diagnostic error. Bhat and Hammond have shown a related measure, Shannon’s entropy, to be a good measure to distinguish between text and shape in sketch recognition [28].
We implemented an existing machine learning algorithm, time series shapelet analysis, originally developed for the data mining and information retrieval research domain, and applied it on eye-event data recorded during mammographic screen-ing. In addition, we extended the time series shapelet algorithm in a manner that optimizes its utility for eye tracking data.
We applied sketch gesture recognition techniques to extract geometric-based fea-tures from eye-event data to characterize visual search behavior during the mam-mographic screening process. These features, we hypothesize, provide a more fine-grained characterization of scanpath by aggregating the spatial (shape), directional,
and kinetic properties of its constituent saccadic movements. We compared fea-tures described above with a previously developed method, which applies timeseries shapelet analysis to extract discriminative information to from changes in pupil di-lation from eye-event data.
2. FRACTAL ANALYSIS OF RADIOLOGISTS VISUAL SEARCH BEHAVIOR IN SCREENING MAMMOGRAPHY∗
The goal of this study was to test the efficacy of radiologists visual search complex-ity, computed using fractal dimension, as a predictor of image characteristics, case pathology, and image reader experience level when viewing 4-view mammographic cases, as they typically do in clinical practice. The study was performed for the task of mammographic screening as typically done in clinical practice. Eye-tracking data and diagnostic decisions for 100 mammographic cases, collected from seven Radiol-ogy residents and three board certified radiologists, formed the corpus used for this study. Visual search complexity, using gaze data extracted from eye-tracking data, was estimated using fractal dimension computed using the Minkowski-Bouligand box-counting method. Mass conspicuity, assessed according to the subtlety rating, and parenchymal density, were provided in the DDSM truth files. Individual factor and group-based interaction ANOVA analyses were investigated.
The characteristics of a mammographic case, including case pathology and breast parenchymal density, image reader experience level, and individual differences each factor as independent predictors of a radiologists visual scanning pattern complexity in screening mammography. No higher order effects were found to be significant.
An aggregate characterization of visual search behavior, captured in visual search complexity, is dependent on case properties and image reader characteristics.
∗Description of methods and experimental results are reprinted with permission from “Fractal analysis of radiologists’ visual scanning pattern in screening mammography,” by Folami T Ala-mudun, Hong-Jun Yoon, Kathy Hudson, Garnetta Morin-Ducote, and Georgia Tourassi, 2015. Pro-ceedings of SPIE, 9416, pp. 94160T-94160T-8, Copyright 2015 by SPIE.

![Figure 1.1: An illustration of the human eye (From Rhcastilhos [53]).](https://thumb-us.123doks.com/thumbv2/123dok_us/1289865.2673004/33.918.271.681.384.776/figure-illustration-human-eye-rhcastilhos.webp)

![Figure 1.4: Eye movements during the first 2 seconds of viewing a picture. (based on data from Yarbus [298]).](https://thumb-us.123doks.com/thumbv2/123dok_us/1289865.2673004/38.918.156.795.523.927/figure-eye-movements-seconds-viewing-picture-based-yarbus.webp)