Exudate Segmentation using Fully Convolutional Neural
Networks and Inception Modules
Piotr Chudzik
a, Somshubra Majumdar
b, Francesco Caliva
a, Bashir Al-Diri
a, and Andrew
Hunter
aa
School of Computer Science, University of Lincoln, Lincoln, United Kingdom
bDepartment of Computer Science, University of Illinois, IL 60607, Chicago, USA.
ABSTRACT
Diabetic retinopathy is an eye disease associated with diabetes mellitus and also it is the leading cause of preventable blindness in working-age population. Early detection and treatment of DR is essential to prevent vision loss. Exudates are one of the earliest signs of diabetic retinopathy. This paper proposes an automatic method for the detection and segmentation of exudates in fundus photographies. A novel fully convolutional neural network architecture with Inception modules is proposed. Compared to other methods it does not require the removal of other anatomical structures. Furthermore, a transfer learning approach is applied between small datasets of different modalities from the same domain. To the best of authors’ knowledge, it is the first time that such approach has been used in the exudate segmentation domain. The proposed method was evaluated using publicly available E-Ophtha datasets. It achieved better results than the state-of-the-art methods in terms of sensitivity and specificity metrics. The proposed algorithm accomplished better results using a diseased/not diseased evaluation scenario which indicates its applicability for screening purposes. Simplicity, performance, efficiency and robustness of the proposed method demonstrate its suitability for diabetic retinopathy screening applications.
Keywords: Deep Learning, Fundus Photography, Convolutional Neural Networks, Exudate Segmentation, Di-abetic Retinopathy
1. INTRODUCTION
Early detection and treatment of DR is essential to prevent vision loss.1 The most cost-effective and non-invasive method for analysing the eye’s fundus is digital fundus photography (FP). Unfortunately, due to a growing number of diabetic patients (estimated 640 millions by 20402) and lack of trained specialists, especially in the less developed areas,3the screening of DR is a worldwide public health problem. Therefore, automated methods for the analysis of FP are required. Exudates (EX) are yellow-white dots with well-defined borders caused by vessel leakage.Compared to other retinal lesions such as microaneurysms and haemorrhages (red lesions), they are much brighter. EXs are one of the earliest signs of DR. As such, the automatic detection and segmentation of EXs can reduce the screening workload.
The main contributions of this paper are as follows. First, we propose an automatic EX segmentation method using a novel convolutional neural network with Inception Modules. Second, the proposed method does not require the removal of other anatomical structures present in FPs. Third, we show how to successfully transfer knowledge between small datasets of different modalities from the same domain.
This paper is organized as follows. The related work is described in Section II. Section III describes the datasets and the performance metrics used for experiments. The proposed method is described in Section IV. Section V presents evaluation results and comparison with existing approaches. Finally, in Section VI discussion and conclusions are given.
Further author information: (Send correspondence to P.C.) P.C.: E-mail: [email protected],
S.M.: E-mail: [email protected], F.C.: E-mail: [email protected], B.A.: E-mail: [email protected], A.H.: E-mail: [email protected].
2. RELATED WORK
The majority of EX segmentation and detection methods can be divided into four main groups: 1) Region growing, 2) Mathematical morphology based, 3) Threshold based, and 4) Machine Learning based algorithms. Region growing methods examine neighbourhoods of seed points and determine whether they should be part of a specific region. Li and Chutatape4 employed a combination of edge detection and region growing methods. Sinthanayothinet al.5 combined the Moat Operator with a recursive region growing segmentation algorithm to detect EXs. Mathematical morphology based methods employ a number of mathematical operators with various structuring elements. Zhang et al.6 used morphological operators to create candidate regions. Subsequently, true positive pixels were identified using a random forest classifier and contextual features. Harangi and Hajdu7 presented a method that combines morphological operators with an active contour model. Similarly to,6operators were used to find candidate EX regions, which were used as input for the active contour model. Threshold based methods exploit differences in colour intensity between various image regions. Pereira et al.8 combined a thresholding approach with the ant colony optimizer to segment EXs. EX candidates were identified using a thresholding method, whereas the unsupervised ant colony optimizer was used to enhance EXs edges. Garc´ıaet al.9 suggested a combination of adaptive and global thresholding approaches to find EX candidates. Next, a radial basis function classifier was designed to classify lesions based on features mainly derived from lesions’ shape and colour. Machine Learning based methods include both supervised (e.g. neural networks) and unsupervised (e.g. clustering) learning algorithms. Niemeijer et al.10 used k-nearest neighbour and linear discriminant classifiers to label each pixel as either EX or background. Rochaet al.11 introduced a method based on a dictionary of visual words constructed using SIFT12 and SURF13 features. Each image was treated as a bag of features and used as input to support vector machines for final classification.
The presented algorithm falls under Machine Learning based category. Compared to the methods mentioned above, the proposed algorithm does not require manually hand-crafted features, it automatically learns the most discriminative features for EX segementation. Furthermore, it leverages knowledge gained from microaneurysm detection task to improve its performance.
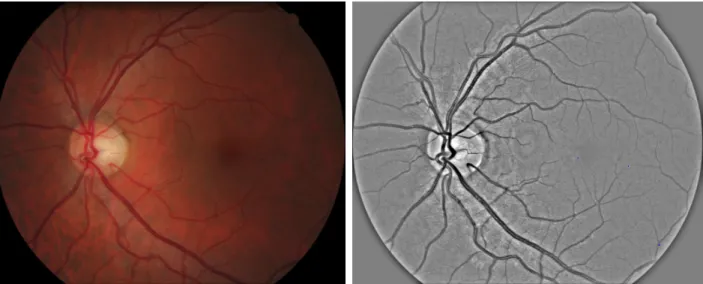
Figure 1. Example image from E-Ophtha EX dataset. From left to right: original image; preprocessed image.
3. MATERIALS AND EVALUATION
To validate the proposed approach we used the well-established and publicly available Opthta datasets: E-Ophtha MA and E-E-Ophtha EX.
E-Ophtha MAdataset14consists of 381 compressed images of which 148 have MAs present and 233 depict healthy FPs.
E-Ophtha EXdataset14consists of 82 compressed images of which 47 have at least 1 EX pixel present and 35 show healthy FPs.
Images were acquired in more than 30 screening centres around France at various resolutions at 45◦ Field-of-View (FOV). There are no separate testing and training datasets provided.
The proposed method was evaluated using most commonly used performance metrics: sensitivity (SN), specificity (SP) and area under receiver operating characteristic curve (AUC). Exudate segmentation can be defined as an imbalanced data classification problem because the number of non-exudate pixels is much grater than exudate pixels. Similarly to68we used the pixel-wise connected component evaluation. Pixels of a connected component are considered as true positives if they partially or totally overlap with a ground truth. As a result, SN and SP are calculated as
SN = T P
T P+F N, (1)
SP = T N
T N+F P, (2)
(3) where TP, TN, FP, and FN indicate correctly identified vessel pixels(true positives), correctly identified non-vessel pixels (true negatives), incorrectly identified non-vessel pixels (false positives), incorrectly identified non-non-vessel pixels (false negatives), respectively.
The Receiver Operating Characteristics (ROC) curve plots sensitivity versus false positive rate (1-specificity). The AUC metric measures the area under the ROC curve. To validate the suitability of the presented algorithm for screening purposes, AUC was calculated using diseased (at least one EX pixel is present) versus not diseased (no exudate pixels present) scenario. All the evaluation metrics were calculated using FOV pixels only.
4. METHOD
The majority of EX segmentation algorithms employ features based on various EXs attributes such as shape, colour and texture. Unfortunately, the presence of many image modalities makes it virtually impossible to model them manually. To address this challenge, a Convolutional Neural Network (CNN) was used. CNNs have emerged as a powerful family of algorithms for solving computer vision tasks such as object detection,15semantic segmentation,16and image classification.17
4.1 Preprocessing
During preprocessing we extract the green plane of FPs because it provides the highest contrast between EXs and background. Since we are only interested in pixels inside the FOV, we automatically generate a mask for pixels outside the FOV. A mask is generated by applying Otsu thresholding18 to the green plane of the image. Each image (I) was preprocessed (Ip) by computing a weighted sum as in Eq.4:
Ip=I·α+IGauss·β+γ (4)
wherealpha= 4 andβ =−10 are weight factors;IGauss is Gaussian blurred image that was created using filter
computed as described in Eq.5withσ= 10;γ= 128 is a scalar added to each sum. G(x, y) = 1
2πσ2e
−x2 +y2
2σ2 (5)
4.2 Pixel-Wise Classification
The main goal of this stage is to classify each pixel as either EX or non-EX. The Fully Convolutional CNN (FCNN) is trained to map an image patch P to the corresponding annotationA(P) for all possible locations within an image. A training sample consists ofS×S sizedP andA(P) : {P, A(P)}.
The goal of training is to learn a mappingP →A(P) in the form of a CNN by minimizing
L=
N
X
i=1
l(A(P)i, f(Pi; Θ)) + Φ(Θ)), (6)
whereA(P)iandPiare the i-th annotation patch and i-th image patch,N is the number of training samples,
l(·) is the loss function, Θ are learning parameters, and Φ(Θ) is the regularization term.
A canonical CNN consist of intertwining convolutional, pooling, and fully connected layers. The CNN ar-chitects have to decide on the amount and type of convolutional layers based on their knowledge, experience, and skills. Szegedyet al. 19 introduced Inception Modules (IM) that allow a network to use multiple types of convolutional filters at the same time and let the model decide which ones to use. Networks with IMs perform multiple convolutions in parallel and concatenate the resulting feature maps before going to the next layer. A FCNN uses convolutional layers instead of fully connected layers to limit the amount of computations required. In this paper, a novel FCNN architecture with Inception Modules was designed to segment EXs. This architecture includes skip connections to improve network’s convergence rate.
Compared with the original FCNN that uses whole images as input 20 due to the small localized nature of EXs and data scarcity, we designed a network that is optimized for small image patches. Furthermore, to overcome the class imbalance problem (the overwhelming majority of pixels depicts non-EXs) we incorporated a Dice similarity coefficient function as the cost function. The training algorithm maximises the Dice loss function which measures the overlap between ground truthsy and predicted segmentation ˆy. Its values range between 0 (no overlap) and 1 (perfect agreement) and is calculated as
DICE= 2∗ |y
Ty|ˆ +δ
|y|+|y|ˆ +δ (7)
whereδis a small smoothing factor that counteracts against zero value and zero denominator.
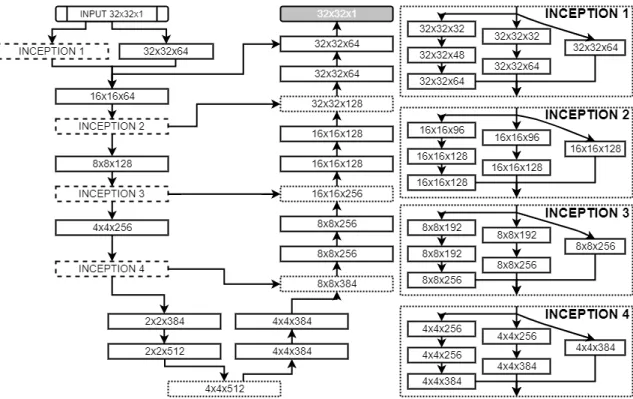
The FCNN architecture was determined experimentally and is depicted in Fig.2. It consists of 14 convolu-tional layers, each followed by a BN layer apart from the final classification layer; three 2×2 simple upsampling layers that replicate rows and columns of data; 4 skip connections between both paths. The network uses 4 Inception modules, each consisting of 7 convolutional layer. Multiple inputs are merged by concatenation. All convolutional layers use 3×3 filters and Leaky ReLU activation function21 with 0.1 slope, apart from the fi-nal layer which uses a sigmoid activation function. Weights are updated using stochastic gradient descent with batch size 128 and Adam optimization technique22with 0.0001 initial learning rate. All training pairs are shuffled between each epoch.
At training time, image patches are randomly extracted using a sliding window approach with 2×2 stride. We divide image patches into EX patches containing at least 1 EX pixel and non-EX patches consisting of all remaining patches. The random artificial transformations including rotation, horizontal and vertical reflections are performed to increase variety in the training set and combat overfitting. Since we are interested in EX pixels only, the training set consists in 80% of EX patches and in 20% of non-EX patches.
At testing time, all possible image patches from inside of a FOV are extracted. To reconstruct the final image segmentation a voting mechanism is used. EachA(P) produced by the model provides a single vote for all pixels it contains. Given that patches are centred at all possible locations and theA(P) size isS×S, each pixel receivesS2 votes, and a pixel receivingv votes as an MA is assigned a probability ofv/S2. As a result, a confidence map for pixel EX membership is created.
Figure 2. FCNN Architecture. Each block specifies the shape of its output. Dotted lined blocks correspond to upsampling layers. Dash-lined blocks represent Inception Modules. Multiple convolutional layers are combined through concatenation. The final grey block corresponds to final convolutional layer.
4.3 Transfer Learning
Data scarcity is one of the main challenges of medical imaging and EX segmentation in particular. The existing EX segmentation public datasets are small, images are very similar to each other and lack localized lesion annotations. Consequently, data-hungry methods such as FCNNs struggle to disentangle factors of variations in data. To overcome these limitations in other medical imaging domains, a transfer learning approach was adopted. Transfer learning allows model’s knowledge to be moved across domains in a form of neural network weights. Due to the abundance of labelled natural images, they serve as the original (”feature giver”) dataset. However, similarly to,23 we observe that the success of knowledge transfer depends on the similarity between involved datasets. Medical and natural images are fairly different from each other: in medical image analysis every single pixel is important whereas in natural image analysis such small differences are ignored. Therefore, the knowledge transfer between these domains has a varying success rate.23
To mitigate this problem, we propose a transfer learning approach using datasets from the same problem domain but designed for different modalities. Contrary to the common belief that a transfer learning approach is only useful when the original dataset is large, we show that transfer learning between even small datasets can be beneficial. By combining knowledge from two seemingly unrelated datasets created for different tasks (microaneurysm and exudate segmentation) in the same domain (fundus photography) we are able to improve the performance of the proposed algorithm. To the best of authors’ knowledge, this is the first time when a transfer learning between datasets of different modalities in FP was used for EX segmentation.
5. EXPERIMENTAL RESULTS
We evaluated the proposed method using the E-Opthta dataset.In all experiments, 20% of the training samples are held back as a validation set and an early stopping criteria is used: training stops when validation error does not improve for 20 epochs. If the validation error does not improve for 10 epochs, the learning rate is reduced by a factor of 0.3.
The base model for fine-tuning was trained using E-Ophtha MA dataset consisting of 381 images. Subse-quently, the model was fine-tuned using E-Ophtha EX dataset comprising of 82 images. During fine-tuning the initial 5 convolutional layers and 4 Inception Modules were frozen, whereas the remaining layers were trained as usual. Since E-Ophtha EX dataset does not provide separate train and testing datasets, it was randomly divided into two sets of 41 images each. During experiments 2-fold cross-validation was performed, with each set being either train or testing set. The input patch had 32×32 size. All parameters were determined experimentally.
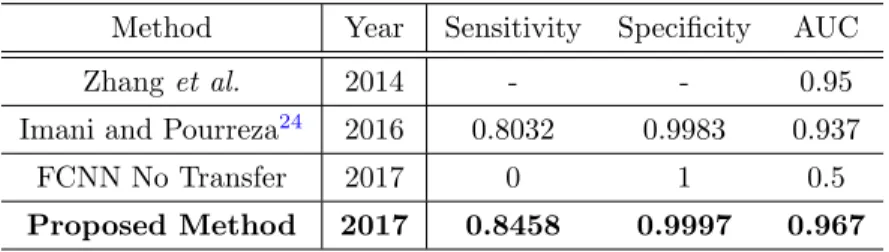
Table1 presents a performance comparison between the proposed method and the state-of-the-art methods using the E-Ophtha EX dataset. The sensitivity and specificity metrics were calculated pixel-wise using a 0.5 threshold. Following common practice, the AUC metric was calculated on the whole image level (diseased/not diseased). For comparison purposes, we evaluated the model directly trained using E-Ophtha EX dataset without the knowledge transfer from E-Ophtha MA. As expected, such network does not learn anything and produces only blank results due to the limited training set (41 images). As such, the specificity is equal to 1 since all pixels have 0 value. Compared to other techniques, the proposed algorithm accomplished highest values for sensitivity, specificity and AUC. Fig.3presents examples of lesion detection results. Table2 shows the amount of training images and patches used during experiments.
Table 1. Performance comparison using the E-Ophtha EX dataset.
Method Year Sensitivity Specificity AUC Zhanget al. 2014 - - 0.95 Imani and Pourreza24 2016 0.8032 0.9983 0.937
FCNN No Transfer 2017 0 1 0.5 Proposed Method 2017 0.8458 0.9997 0.967
The implementation was based on Keras deep learning framework25 and Tensorflow numerical computation library.26 The experiments were conducted using a PC with Intel Core i7-6700K CPU, two NVIDIA TitanX graphics cards, and 64GB of RAM.
Table 2. Training data.
Dataset Nr of training images Nr training patches E-Ophtha EX 82 79 063 E-Ophtha MA 381 552 451
6. DISCUSSION AND CONCLUSIONS
This paper presents a novel EX segmentation method evaluated using E-Ophtha EX dataset. The proposed algorithm uses a novel FCNN architecture with Inception Modules and Dice coefficient loss function to segment EXs. Compared to other techniques that remove other anatomical structure (e.g. vessels, optic nerve head, other lesions) before EX segmentation, the proposed method is able to differentiate EXs from other structures automatically. Furthermore, we show how to transfer knowledge between small datasets of different modalities in the FP domain.
The proposed algorithm achieves better results than state-of-the-art methods in terms of the sensitivity, specificity and AUC metric. Most importantly, it achieved best performance when evaluated using diseased/not diseased scenario. As such, we think that the proposed method would prove useful as a component of a DR screening process. In the future we plan to evaluate it using other modalities and datasets.
ACKNOWLEDGMENTS
This research was made possible by a Marie Curie grant from the European Commission in the framework of the REVAMMAD ITN (Initial Training Research network), Project number 316990.
Figure 3. Examples of exudate segmentation results for E-Ophtha EX dataset using 0.5 probability threshold. True positives are green coloured, false positives are blue coloured and false negatives are red coloured.
REFERENCES
[1] Cheung, N., Mitchell, P., and Wong, T., “Diabetic retinopathy,”Lancet376(9735), 124–36 (2010). [2] “Idf diabetes atlas, 7th edn.”,”International Diabetes Federation(2015).
[3] Guariguata, L., Whiting, D., Hambleton, I., Beagley, J., Linnenkamp, U., and Shaw, J., “Global estimates of diabetes prevalence for 2013 and projections for 2035,” Diabetes research and clinical practice103(2), 137–149 (2014).
[4] Li, H. and Chutatape, O., “Automated feature extraction in color retinal images by a model based approach,”
IEEE Transactions on biomedical engineering51(2), 246–254 (2004).
[5] Sinthanayothin, C., Boyce, J. F., Williamson, T. H., Cook, H. L., Mensah, E., Lal, S., and Usher, D., “Automated detection of diabetic retinopathy on digital fundus images,”Diabetic medicine19(2), 105–112 (2002).
[6] Zhang, X., Thibault, G., Decenci`ere, E., Marcotegui, B., La¨y, B., Danno, R., Cazuguel, G., Quellec, G., Lamard, M., Massin, P., et al., “Exudate detection in color retinal images for mass screening of diabetic retinopathy,”Medical image analysis18(7), 1026–1043 (2014).
[7] Harangi, B., Lazar, I., and Hajdu, A., “Automatic exudate detection using active contour model and region-wise classification,” in [Engineering in Medicine and Biology Society (EMBC), 2012 Annual International Conference of the IEEE], 5951–5954, IEEE (2012).
[8] Pereira, C., Gon¸calves, L., and Ferreira, M., “Exudate segmentation in fundus images using an ant colony optimization approach,”Information Sciences296, 14–24 (2015).
[9] Garc´ıa, M., S´anchez, C. I., Poza, J., L´opez, M. I., and Hornero, R., “Detection of hard exudates in retinal images using a radial basis function classifier,”Annals of biomedical engineering37(7), 1448–1463 (2009). [10] Niemeijer, M., van Ginneken, B., Russell, S. R., Suttorp-Schulten, M. S., and Abramoff, M. D., “Automated
detection and differentiation of drusen, exudates, and cotton-wool spots in digital color fundus photographs for diabetic retinopathy diagnosis,”Investigative ophthalmology & visual science48(5), 2260–2267 (2007). [11] Rocha, A., Carvalho, T., Jelinek, H. F., Goldenstein, S., and Wainer, J., “Points of interest and visual
dictionaries for automatic retinal lesion detection,” IEEE transactions on biomedical engineering 59(8), 2244–2253 (2012).
[12] Lowe, D. G., “Distinctive image features from scale-invariant keypoints,”International journal of computer vision60(2), 91–110 (2004).
[13] Bay, H., Ess, A., Tuytelaars, T., and Van Gool, L., “Speeded-up robust features (surf),”Computer vision and image understanding 110(3), 346–359 (2008).
[14] Decenci`ere, E., Cazuguel, G., Zhang, X., Thibault, G., Klein, J.-C., Meyer, F., Marcotegui, B., Quel-lec, G., Lamard, M., Danno, R., et al., “Teleophta: Machine learning and image processing methods for teleophthalmology,”IRBM34(2), 196–203 (2013).
[15] Simonyan, K. and Zisserman, A., “Very deep convolutional networks for large-scale image recognition,”
arXiv preprint arXiv:1409.1556(2014).
[16] Long, J., Shelhamer, E., and Darrell, T., “Fully convolutional networks for semantic segmentation,” in [Proceedings of the IEEE Conference on Computer Vision and Pattern Recognition], 3431–3440 (2015). [17] Krizhevsky, A., Sutskever, I., and Hinton, G. E., “Imagenet classification with deep convolutional neural
networks,” in [Advances in neural information processing systems], 1097–1105 (2012).
[18] Otsu, N., “A threshold selection method from gray-level histograms,”IEEE transactions on systems, man, and cybernetics9(1), 62–66 (1979).
[19] Szegedy, C., Liu, W., Jia, Y., Sermanet, P., Reed, S., Anguelov, D., Erhan, D., Vanhoucke, V., and Rabinovich, A., “Going deeper with convolutions,” in [Proceedings of the IEEE conference on computer vision and pattern recognition], 1–9 (2015).
[20] Ronneberger, O., Fischer, P., and Brox, T., “U-net: Convolutional networks for biomedical image segmen-tation,” in [International Conference on Medical Image Computing and Computer-Assisted Intervention], 234–241, Springer (2015).
[21] Maas, A. L., Hannun, A. Y., and Ng, A. Y., “Rectifier nonlinearities improve neural network acoustic models,” in [Proc. ICML],30(1) (2013).
[22] Kingma, D. and Ba, J., “Adam: A method for stochastic optimization,” arXiv preprint arXiv:1412.6980
(2014).
[23] Azizpour, H., Sharif Razavian, A., Sullivan, J., Maki, A., and Carlsson, S., “From generic to specific deep representations for visual recognition,” in [Proceedings of the IEEE Conference on Computer Vision and Pattern Recognition Workshops], 36–45 (2015).
[24] Imani, E. and Pourreza, H.-R., “A novel method for retinal exudate segmentation using signal separation algorithm,”Computer methods and programs in biomedicine133, 195–205 (2016).
[25] Chollet, F. et al., “Keras.”https://github.com/fchollet/keras(2017).
[26] Abadi, M., Agarwal, A., Barham, P., Brevdo, E., Chen, Z., Citro, C., Corrado, G. S., Davis, A., Dean, J., Devin, M., et al., “Tensorflow: Large-scale machine learning on heterogeneous distributed systems,”arXiv preprint arXiv:1603.04467(2016).