Worcester Polytechnic Institute
Digital WPI
Interactive Qualifying Projects (All Years) Interactive Qualifying Projects
April 2019
CAN SLIM Method V.s Robo Advising Stock
Market Simulation
Nimindu Bimsara Ambalangodage Worcester Polytechnic Institute
Follow this and additional works at:https://digitalcommons.wpi.edu/iqp-all
This Unrestricted is brought to you for free and open access by the Interactive Qualifying Projects at Digital WPI. It has been accepted for inclusion in Interactive Qualifying Projects (All Years) by an authorized administrator of Digital WPI. For more information, please [email protected]. Repository Citation
Ambalangodage, N. B. (2019).CAN SLIM Method V.s Robo Advising Stock Market Simulation. Retrieved from https://digitalcommons.wpi.edu/iqp-all/5380
1
Project Number: DTZ 1708
An Interactive Qualifying Project Report:
Submitted to the Faculty of
WORCESTER POLYTECHNIC INSTITUTE
in partial fulfillment of the requirements for the
Degree of Bachelor of Science
By
Nimindu Ambalangodage Project Advisor: Professor Dalin Tang
2
Abstract
A real-time stock market simulation was performed using two trading strategies,
Robo Advisors, and the CAN SLIM Method. Real matrices were used in the simulation.
Use of metrics enables the researcher in future financial investments and ventures by
providing him with the knowledge and skillset to trade confidently. Each strategy started
with $100,000 investment in its portfolio. The CAN SLIM Method had a $19,011.51
portfolio gain, with trade swings up to 17% weekly. While the Robo-Advisor had a
$3,587.60 portfolio gain with swings up to 3% weekly. The results of the simulation
showed that the CAN SLIM Method had a greater financial gain through large swings
during the six-week period. The Robo-Advisors show minimal gain and smaller swings,
indicating potential for sustainable long-term growth. The project and simulation proved very valuable for the participant’s future financial goals.
3
Acknowledgements
This IQP would not have been successful without the support of many people. First
the continuous support and belief of Professor Dalin Tang was instrumental to the success and completion of this IQP. Professor Dalin Tang’s commitment to his students and willingness to help, enabled me to achieve this goal. I would also like to thank my
family for their loving and financial support throughout this process. Next, The WPI Writing
Center was helpful in increasing the quality of this IQP. Finally, I would like to thank
Worcester Polytechnic Institute for giving me this opportunity to learn and gain skills that
4
Table of Contents
ABSTRACT... 2 TABLE OF CONTENTS ... 3 LIST OF FIGURES ... 6 LIST OF TABLES ... 7 1. INTRODUCTION ... 81.1GOALS AND SCOPE ... 8
1.2STOCK MARKET HISTORY... 8
1.2.1 Major Stock Exchanges ... 9
1.2.1 Major Indexes ... 10
1.3ROBO-ADVISOR HISTORY... 12
1.4CANSLIMMETHOD HISTORY ... 13
2. TRADE STRATEGIES ... 14
2.1 POPULAR TRADE STRATEGIES 2019 ... 14
2.2 Robo-Advisors... 14 2.3 Indexing/Mutual Funds ... 15 2.4 CAN SLIM ... 15 2.5 Contration Investing ... 15 2.6 Trend Trading... 16 2.7 401K/Retirement Investing ... 16 3. ROBOTIC ADVISORS ... 17
3.1ROBO-ADVISOR BACKGROUND ... 17
3.1.1 What is a Robo Advisor... 17
3.1.2 Benefits/Disadvantages of Using Robo Advisor ... 18
3.1.3 How to use a Robo Advisor ... 21
3.2SIMULATION ... 22 3.2.1 Platforms Chosen ... 22 3.2.1.1 Betterment ... 22 3.2.1.2 WealthFront ... 24 3.2.2 Week One ... 26 3.2.3 Week Two ... 27 3.2.4 Week Three ... 28 3.2.5 Week Four ... 29 3.2.6 Week Five ... 30 3.2.7 Week Six ... 31 3.3RESULTS ... 32
4. CAN SLIM METHOD ... 34
4.1CAN SLIM METHOD BACKGROUND ... 34
4.1.1 What is the CAN SLIM Method ... 34
4.1.2 Advantages/Disadvantages of Using CAN SLIM Method ... 34
4.1.3 How to CAN SLIM Method ... 36
5 4.2.1 Methodology/Companies Chosen ... 41 4.2.2 Week One ... 46 4.2.3 Week Two ... 49 4.2.4 Week Three ... 52 4.2.5 Week Four ... 55 4.2.6 Week Five ... 58 4.2.7 Week Six ... 61 4.3RESULTS ... 63 5. ANALYSIS ... 66 5.1COMPARISON OF RESULTS ... 66 5.2RECCOMENDATIONS ... 69 6. CONCLUSIONS ... 70 REFERENCES ... 71
6
LIST OF FIGURES
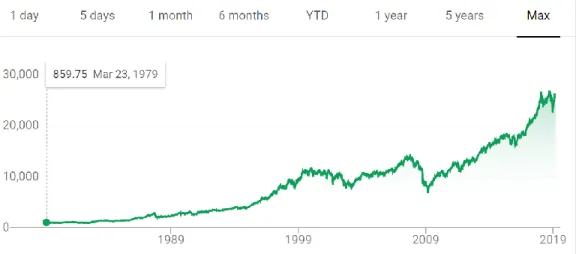
Figure 1.1 DOW Jones Performance from 1979 to 2019 (Google) ...11
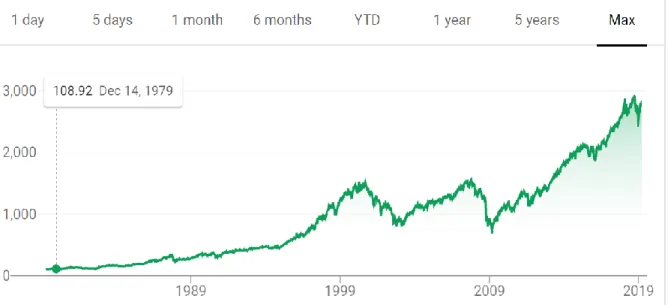
Figure 1.2 S&P 500 Performance from 1979 to 2019 (Google) ...12
Figure 3.1 Projected Growth of Robo-Advisors Charles Swhab ...18
Figure 3.2 Tool to change Percentage of Portfolio Allocation in Betterment ...23
Figure 3.3 SPDR S&P 500 ETF from 2/25/2019 to 3/1/2019 (Macro Trends). ...26
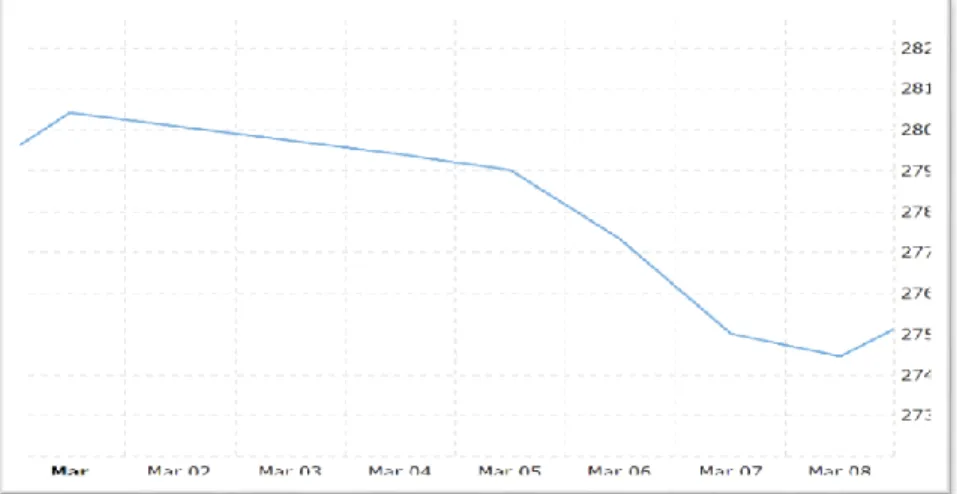
Figure 3.4 SPDR S&P 500 ETF from 3/1/2019 to 3/8/2019 (Macro Trends) ...27
Figure 3.5 SPDR S&P 500 ETF from 3/8/2019 to 3/15/2019 (Macro Trends) ...28
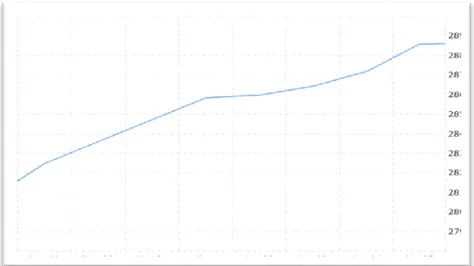
Figure 3.6 SPDR S&P 500 ETF from 3/15/2019 to 3/22/2019 (Macro Trends) ...29
Figure 3.7 SPDR S&P 500 ETF from 3/22/2019 to 3/29/2019 (Macro Trends) ...30
Figure 3.8 SPDR S&P 500 ETF from 3/29/2019 to 4/05/2019 (Macro Trends) ...31
Figure 3.9 Weekly Portfolio Value of Robo-Advisor Simulation ...33
Figure 4.1 Growth in Netflix Stock after CAN SLIM Sell Indicators Noticed. ...36
Figure 4.2 Finviz Stock Screener Fundamental Indicators ...39
Figure 4.3 Finviz Stock Screener Criteria Search Example ...40
Figure 4.4 Results of Finviz Stock Screening ...42
Figure 4.5 Champions Oncology One Year Stock Performance ...43
Figure 4.6 Gray Television Incorporated One Year Stock Performance ...44
Figure 4.7 Rubicon Project One Year Stock Performance ...45
Figure 4.8 Southwest Airlines One Year Stock Performance...46
Figure 4.9 Results of Finviz Stock Screening for Week Two ...51
Figure 4.10 Weekly Portfolio Values CAN SLIM Simulation ...65
Figure 5.1 Weekly Percent Change Comparison CAN SLIM VS. ROBO ...67
7
LIST OF TABLES
Table 1.1 Robo Advisors Assets of October 2017 (Forbes) ...12
Table 3.1 Initial Investment Robo-Advisor Simulation...26
Table 3.2 Percent Change Week One for Robo-Advisor ...26
Table 3.3 Percent Change Week Two for Robo-Advisor ...27
Table 3.4 Percent Change Week Three for Robo-Advisor ...28
Table 3.5 Percent Change Week Four for Robo-Advisor ...29
Table 3.6 Percent Change Week Five for Robo-Advisor ...30
Table 3.7 Percent Change Week Six for Robo-Advisor ...31
Table 3.8 Percent Change Weekly for Robo-Advisor Simulation ...32
Table 4.1 Initial Investment for CAN SLIM Method Simulation ...46
Table 4.2 Percent Change and Portfolio Value for Week One Stocks ...47
Table 4.3 Relative Strength Index, Relative Volume, and % Change Comparison Week One ...47
Table 4.4 Table of transactions before Week Two of Simulation ...48
Table 4.5 Percent Change and Portfolio Value for Week Two Stocks ...49
Table 4.6 Relative Strength Index, Relative Volume, and % Change Comparison Week Two ...50
Table 4.7 Table of transactions before Week Three of Simulation...51
Table 4.8 Percent Change and Portfolio Value for Week Three Stocks ...52
Table 4.9 Relative Strength Index, Relative Volume, and % Change Comparison Week Three 53 Table 4.10 Table of transactions before Week Four of Simulation...54
Table 4.11 Percent Change and Portfolio Value for Week Four Stocks ...55
Table 4.12 Relative Strength Index, Relative Volume, and % Change Comparison Week Four 56 Table 4.13 Table of transactions before Week Five of Simulation ...57
Table 4.14 Percent Change and Portfolio Value for Week Five Stocks ...58
Table 4.15 Relative Strength Index, Relative Volume, and % Change Comparison Week Five .59 Table 4.16 Table of transactions before Week Six of Simulation ...60
Table 4.17 Percent Change and Portfolio Value for Week Six Stocks ...61
Table 4.18 Table of transactions End of Week Six Simulation ...62
Table 4.19 Performance of Stocks Weekly CAN SLIM Simulation...63
8
1. Introduction
1.1 Goals and Scope
Stock market investment options have increased in the past decade with the
advancement of technology. For example, Robo-Advisors, a new automated type of
investing, have been utilized by millions of investors. Furthermore, older investing
strategies, such as the CAN SLIM method are still commonly used. The goal of this IQP
is to understand these strategies, the differences between them, how to use them, and
conduct a six-week simulation comparing the strategies. The simulation will be conducted
comparing the two main investment strategies, Robo-Advisors, and CAN SLIM Method. I
am simulating a 100,000$ investment in each strategy. The results of the simulation will
be documented weekly. After concluding the six-week simulation, there will be an analysis comparing and choosing a “winner” out of the two strategies. First, I will provide a brief history of the stock market, along with the history of Robo-Advising and the CAN SLIM
Method. Furthermore, a general basis of other popular investment strategies will also be
included. The simulation will help me learn different investment strategies, be able to
educate others of the strategies. It will let me learn from my mistakes during the simulation
and be able to analyze which investment strategy should be chosen based on the results
of the simulation.
1.2 Stock Market History
The journey from Europe to the West Indies by ship in the 1600’s was a dangerous one. The owners of the ships dealt with obstacles, pirates, shipwreck and other conditions
9
investors to buy a portion of the ship, and in turn would share a portion of the profits
if/when the ship returned. Therefore, the risks for owners were mitigated as they would
only be responsible for the losses of a portion of the ship, in case of misfortune. The East
India Company found opportunity to capitalize on this process. They created a platform
for investors and shipowners to find each other. The consensus was that this type of trade
was powerful. Soon it became a part of many governmental procedures and corporations.
The East India Company merged and became the Dutch East India Trading Company
(DETC) and the DETC created the Amsterdam Stock Exchange, the first stock exchange
in the world (Hur, 2016).
1.2.1 Major Stock Exchanges
The stock market has blossomed since the Amsterdam Stock Exchange. In the
U.S, the first stock market exchange was established in Philadelphia in 1791, as it was
the center of domestic and foreign trade. The first stock exchange in New York was
created in 1792 and was formally named in 1817 as the New York Stock Exchange
(NYSE) (Siegel, 2005). These early adaptions of the Stock Exchange were unregulated
and relied on the word of the brokers and traders. After the Great Depression and the
stock market crash of 1929, The Security and Exchange commission (SEC) created
regulations and licenses to ensure a crash of this magnitude would not occur again. This
paved the way to the modern stock exchanges that we use today. Some of the more
popular ones include the NYSE, Pacific Stock Exchange (PSE), Philadelphia Stock
Exchange (PHLX) and the Chicago Board of Trade (CBOT). All these stocks exchanges operate on the basic principle that the ship owners and investors adopted in 1600’s. The modern exchanges apply the same principle to securities, bonds, commodities, futures,
10
options and investors can trade instantly at the tip of their fingers with new technology
(Forbes, 2019).
1.2.2 Major Indexes.
The Major Indexes are tools used to indicate the health of the stock market on a
given day. Understanding what these indexes are, how they are made up, and how they
are interpreted will prove useful to any investor.
Dow Jones
The most popular index is the DOW. Figure 1.1 shows the performance of the
DOW from 1979 to 2019. It is the index that is used most frequently to measure the
strength of investments. The DOW is the collection of the thirty largest stocks in the United
States. The DOW has changed 52 times since its inception by adding and removing
companies. A big swing one way or another in the DOW is a gauge of the direction of the
economy. However, the DOW should not be used as the only indicator as it only consists
of large-cap stocks. Small-cap stocks, bonds, international stocks can all do well despite
a drop in the DOW. The fluctuations in DOW are frequent and can move hundreds of
points at a time, which indicates a big swing. For example, the DOW over Christmas 2018
swung 600 points down and 1000 points up in the span of two days. These swings can
be daunting and confusing to understand. However, research shows that although larger
swings are more common in modern trading, they are not something to generally be afraid
of. The larger modern swings match the percentage swings of the years in the past. In
other words, a 46-point drop in 1986 would be equal to a 718-point drop in modern trading.
11
swings and not be afraid of the magnitude, rather focus on the percentage. However,
there are swings of 1000 points, these are significant, and something to keep in account
for, as a 1000 point swing is a 5 percent drop or increase (Ganti, 2019).
S&P 500
The S&P 500 consists of 500 companies that meet certain criteria such as being
a U.S company and being publicly backed by at least 50 percent of ownership. It was
founded on March 4, 1957. The S&P 500 also consists of several markets including
technology, infrastructure, agriculture, medical, etc. It has a larger sample size of 500
compared to 30 with the Dow Jones, as well as a more diverse group of stocks. Therefore,
many consider the S&P 500 to be a better indicator of how the economy is doing.
Financial institutions agree with this sentiment as there are over 9.9 Trillion US Dollars
benchmarked against the index. Financial planners and brokers will use the Index to
compare their individual performance with S&P 500 as shown below in Figure 1.2
(Murphy, 2019).
12
1.3 Robo Advisor History
Betterment was the first Robo-Advisor. It was founded in 2008. The use of
automated investments was not a new technology, wealth managers used it frequently.
However, they were the only ones that could purchase this software at a hefty price. It
was not available to the average investor. Betterment changed the status Quo in 2008.
Robo-Advisors have developed significantly over the past eleven years. Robo-Advisors
must be registered investment agents and are monitored by the Securities and Exchange
Commission. Table 1.1 is a chart of popular Robo-Advisors and their total asset
management (Frankenfield, 2018).
Figure 1.2 S&P 500 Performance from 1979 to 2019 (Google)
13
1.4 CAN SLIM Method History
The CAN SLIM Method was developed by William J. O’Neil in the 1950’s. The Method was discovered by completing rigorous work analyzing the best performing stocks
with every metric available to him. The work was outstanding as it was completed in absence of today’s technologies. O’Neil found that no matter what the stock is, they shared seven traits that made them successful or failures. These traits will be discussed further in the report. O’Neil used his CAN SLIM method to become the youngest person at the time to get a seat at the New York Stock Exchange. Investors seeing the success
the method brought to portfolios, started adopting O’Neil’s methodology in their own portfolios. The CAN SLIM method still uses the fundamental seven traits O’Neil described and has been in use for decades (Bajkowski, 2016).
14
2. Trade Strategies
2.1 Popular Trade Strategies 2019
This chapter will cover some of the most commonly used trade strategies in the
investing world today. It will give a brief history of each trading strategy as well as key
features of them. The key strategies to understand are the Robotic-Advisors and the CAN
SLIM trading as they will be used in the simulation of this report.
2.2 Robotic Advisors
Robotic Advisors are a type of financial advisors that will select stocks or provide
financial advice using computer generated algorithms. The algorithms are generated
using software developed by each individual robotic advising company. Robotic advising
is relatively new, and the results from Robotic advising thus far have been promising.
Some of the top robotic advising companies include Fidelity, Betterment and Wealth
Front. After doing some research, I have decided to use Betterment and WealthFront for
the simulation. Robotic Advisors tend to have minimal fees as there is very limited human
interaction. The customer can also customize settings such as risk, preference of
investment, etc.- which will alter the algorithm the Robotic Advisors use on the customers
assets (Frankenfield, 2018).
2.3 Indexing/Mutual Funds
Index funds will follow specific rules depending on your investment interests. Often
these rules include popular indexes such as the S&P 500 and the Dow Jones Industrial
15
invested in actively. Index funds can be customized by size, value and profitability. Index
funds tend to be low-risk and long-term investments (Chen, Indexing, 2017).
2.4 CAN SLIM
CAN SLIM is an extremely curated method into determining when a stock will rise.
CAN SLIM is an acronym which each letter pertaining a rule that must be met to buy a stock. For example, “C” stands for “Current Big or Accelerating Quarterly Earnings and Sales per share”. “I” stands for “Institutional Sponsorship” etc. The theory is that if these rules are met, the chance of a stock rising is very likely. CAN SLIM has been a popular
method used by investors for years. The rules of the CAN SLIM method will be explained,
and its methods will be tested through a simulation of stocks that follow these rules
(Bajkowski, 2016).
2.5 Contrarian Investing
Contrarian Investing is finding companies in a time of economic downturn and
buying many shares of that company in the hope of an economic return. It is the very essence of “buy low, sell high.” The trickiness to this investing is understanding why a company’s stock is down and understanding if it will be able to rise. This includes understanding the industry the company is in, the durability of the company, the management of the company, the company’s long-term value, etc. A failed attempt at contrarian investing can lead to a disaster. This is also a very active form of investing that
16
2.6 Trend Trading
Trend Trading is a technique that follows a certain trend of a market price, rather
than the assets or strengths of a company. The basic trends in stocks is that it follows an
up and down cycle, with a general increase over time. With trend following, active
investors try to predict when the up cycle of the general trend will occur. Many investors
will just leave the money in over a long period of time, in hopes of accepting a potential
short-term loss for a long-term gain. The down-side of trend trading is that it often involves
little research into the basic strengths of a stock or company. Trends can and have been
wrong and less experienced investors could invest in companies with little to no research.
This in turn may put their money at a large risk (Chen, Trend Trading, 2018).
2.7 401K
401K investments are a retirement investment that can only be used after a certain
age. These investments typically have a higher return because of that reason. Benefits
of 401k include a match from employees, and tax benefits. 401k investing is strategy that
has many long-term benefits, the earlier the foundation is built for this type of investment,
the gains will grow incrementally in the future (Kagan, 2019).
Out of all the investment methods mentioned above, I will be discussing and testing
the Robotic Advisors and the CAN SLIM method in this simulation.
17
3. ROBOTIC ADVISORS
This chapter will go in depth into what Advising is, the features of
Robo-Advising, and how to use Robo-Advising. The chapter will give context to readers
unfamiliar with the relatively new technology, as well as show why Robo-Advising is
increasing in popularity over the years. The chapter will give insight to what to expect
when starting and creating an account with Robo-Advisors. Finally, I will conduct a
simulation mirroring the average results of Robo-Advisors platforms such as WealthFront
and Betterment.
3.1 Robo-Advisor Background
3.1.1 What is a Robo-Advisor
Robo-Advisors are automated investing systems that use algorithms and
advanced software to manage your investment portfolio. The Robo-Advisors require
limited human interaction because of these technologies. A Robo-Advising platform gives
individuals the ability to provide information about their financial status and future goals
in-order to create an individual plan that the Robo-Advisor will suggest.
They can complete complex tasks such as tax-loss harvesting, and retirement
planning. This is all done automatically through the software and algorithms. The
18
460 billion in investments by 2022. Figure 3.1 below shows the growth and the projected
growth of Robo-Advisors from 2015 to 2022 (Frankenfield, 2018).
Figure 3.1 Projected Growth of Robo-Advisors (Charles Schwab)
Robo-Advisors are known for the following common practices:
Rebalancing of portfolio to keep the level of portfolio allocation and risk desired. The
rebalances can be real-time, by day, by week, or any other interval. All this is programmed
into the software and algorithms. The platforms have information on financial planning
and tools to use such as projection calculators, and retirement calculators. Robo-Advisors
are also known for automatically implementing tax-loss harvesting and other tax
strategies (Frankenfield, 2018).
3.1.2 Benefits/Disadvantages of Using a Robo-Advisor
Cost of Service:
Cost is the main benefit of using Advising. As mentioned before,
Robo-Advisors use algorithms and software to manage assets, limiting the human involvement
19
human run investments. For comparison, most Robo-Advisors take a fee of .02% to .05% of a client’s total account balance where-as a traditional financial planner will take 1% to 2% of a total account balance. That percentage over a long period of time can amount to
huge savings. Furthermore, investment portfolios run by humans can have transaction
fees. Fees that are applied every time money is re-allocated. Robo-Advisors are
consistently and automatically re-allocating money for the client, therefore the
transactions fees are usually waived. This is another area of savings for the client. It is
important to note that investment companies are saving money on maintenance, and
salaries of employees using this technology. Companies like Fidelity, Vanguard, and
Charles Schwab have developed Robo-Advising programs to run with the trend (Delloite,
2016).
Accessibility/Low Minimums:
Robo-Advisors are far more accessible than traditional financial planners. With
internet connection, a client can re-allocate assets, start retirement planning, open a new
account, etc. Traditionally a client would need to drive to bank and find a time where
his/her financial advisor is available. Robo-Advisors are accessible 24/7 and are accommodating to the client’s time. Low minimums are a major factor to this accessibility. Traditionally financial planners look for individuals with at least 100,000$ in investable
assets to get started. With Advising, the minimums are much lower. Many
Robo-Advisors have $10,000 or $5000 minimums, while many like Betterment require no
20
accessibility to investing for people who were previously not able to afford it (Delloite,
2016).
Simplicity:
As mentioned earlier, the Robo-Advising platforms have an extremely simple and
easy to understand interface. Straight-forward financial information and tools are
available to clients. Clients may be moved away from the prospect of investing if they
have a notion that it is time-consuming and requires major effort. Robo-Advisors
automatically allocate funds to fit their client’s needs, therefore an investor looking to make money over-time with minimal effort, will be attracted to a Robo-Advising platform
(Delloite, 2016).
Efficiency:
Robo-Advisors tend to be more efficient than traditional financial planners.
Traditionally, a client would have to call their financial planner, then physically meet with them and sign paperwork to make a move regarding the client’s assets. With Robo-Advising, the client can re-allocate portfolio, withdraw/deposit money, speak to virtual
advisors, from the comfort of their home and with the click of a mouse (Delloite, 2016).
Potential Disadvantages of Robo-advising:
Critics of Advisors say that the lack of human element limits the
Robo-Advisors from having the complexity that you need to manage a portfolio. Things like
21
and decision making. The lack of complexity could prove to be financially detrimental to
some clients.
Critics also say that Robo-Advisors are not equipped to handle money under
extraordinary circumstances such as a stock market collapse. A human interaction could
help with making unorthodox plays that could save money in case of an extraordinary
event. Human interaction also plays a role in gaining financial information that may not
be available to a Robo-advising platform. Having a financial planner who can give a
personalized answer to any question an investor has, can be more attractive than learning
information from a platform for many clients. Robo-Advisor Platforms may give the same
common solution for multiple clients (Delloite, 2016).
3.1.3 How to use a Robo-Advisor
Using a Robo-Advisor is the simplest out of the two trading methods I will simulate.
Generally, each platform starts with a questionnaire or survey to assess financial goals
and risk tolerance. These goals can include something large such as retirement savings,
down-payment for a house savings, or a new car. The Robo-Advisor will then take the
inputs from the questionnaire to develop a portfolio of electronically traded funds that will
match the risk tolerance assessed in the questionnaire. Next, the Robo-Advisor will
monitor market activity and re-allocate funds accordingly based on an algorithm or
software. The user also can change risk tolerance and choose which type of electronically traded funds (ETF’s) he/she wants the algorithm to favor. After an account has been made and a portfolio has been matched to the client by the algorithm, the money will start being
22
Using a Robo-Advisor is a passive form of investment that requires minimal effort
from the investor. The CAN SLIM Method discussed later in the paper is an active form
of investing. The simplicity of Robo-Advising and passiveness of it will prove to be
outstanding if it can match or beat the active traditional trading and save the investor time,
which itself is a financial gain.
3.2 Simulation
3.2.1 Platforms Chosen
The two platforms that will be used for the simulation are Betterment and
WealthFront. Betterment as explained earlier was the first Robo-Advisor available to
clients and has the most market share, WealthFront has the second most market share.
Both platforms are credible in this investing category (Betterment, 2018).
3.2.1.1 Betterment
Betterment states that its portfolio is designed to obtain optimal returns for your
financial goals. The website states that through diversification, automated rebalancing,
better behavioral guardrails and low fees, that Betterment can help generate 2.66%
higher returns than of a typical investor (Betterment, 2018).
Cost of Service:
Betterment’s annual fee for its most used plan and the one that the simulation will be run on is .25% of the total account balance. This fee covers tax-efficient investing
features, investment advice, and customer service seven days a week. Betterment has
no minimum to invest and there are no transaction, trading, transfer, or rebalancing fees
23
Portfolio Offerings on Betterment:
Betterment offers two major investing subgroups in the investing field, stocks and
bonds. They state that stock investments are risker and bond investment are safer.
Therefore a 90% risk tolerance would have an investment with a mix of 90 percent stocks
and 10 percent bonds. A 40% risk tolerance would have 40 percent stock and 60 percent
bond mix.
The percentage of the stocks above can be chosen in the stock portfolio as shown
in Figure 3.2. After completing my survey, Betterment gave me 80% stocks to 20% bonds
ratio to follow as a guide. This is the ratio I will be starting off my simulation with. I will not
be changing these percentages throughout the simulation as I will want to imitate a
passive buy-hold investment strategy to replicate minimal effort for a typical investor
(Betterment, 2018).
24
3.2.1.2 WealthFront
WealthFront works similarly to Betterment. The idea is passive investing and
building a globally diversified portfolio with low cost index-funds. The WealthFront
software puts money to work automatically while managing the chosen risk and keeping
tax losses at a minimum. The motto of the company is to keep the investing effortless to
the consumer (WealthFront, 2019).
Cost of Service:
They also have a simple .25% annual fee of the total balance and have no
transactions fees. WealthFront has claimed that it would take 105 hours of human time
to replicate trade strategies from the algorithm it uses. $2,926 in transaction fees would
be acquired in traditional investing compared to the algorithm and the average number of
free trades completed per account each year is around 418. The savings of time, money,
and free transactions allow WealthFront to keep their operational and service costs low
(WealthFront, 2019).
Portfolio Offerings on WealthFront:
The Portfolio Offerings on WealthFront include, U.S stock, Foreign Stock,
Emerging Stock Markets, Dividend Stocks, Real Estate, Treasury Inflation- Protected
Securities, Municipal Bonds, Corporate Bonds, U.S Government Bonds, Emerging
25
Foreword on Robo Advisor Simulation:
This simulation will look to approximate the results using Betterment and
WealthFront by using Major Indexes, specifically the S&P 500 as a benchmark for
projected growth. The reason for choosing the S&P 500 as benchmark is for because of
the following. The portfolio mix displayed in Figure 3.2 most accurately mirrors the
diversification in the S&P 500. Furthermore, Betterment and WealthFront both claim to
have a 2% higher yield than the S&P 500. Therefore, The Robo-Advisor Platforms
themselves use the S&P 500 as a benchmark to indicate that their performance is a
slightly better than the S&P 500. At the end of the simulation in this chapter, I will add 1%
to the value of the portfolio to mirror the slight edge that Betterment and WealthFront
claim to have over S&P 500. I will be using the SPDR S&P 500 ETF as the stock that will
be trading during the simulation. This stock is known for mirroring the S&P 500. This part
of the report is the passive buy-hold part of the simulation. Chapter four will include the
26
3.2.2 Week One
The initial investment for Robo-Advisor Simulation is listed below in Table 3.1.
This week in simulation led to a -0.06% loss with the portfolio value going from
$100,000.00 to $99.408.00. This can be summarized in the Table 3.2 below.
The performance of the SPDR S&P 500 ETF from 2/25/2019 to 3/1/2019 is
displayed in Figure 3.3.
Date Stock Price Buy/Sell Shares Cost/Proceeds
2/24/2019 SPDR S&P 500 ETF
$279.52 Buy 357 $99788.64
Table 3.1 Initial Investment Robo-Advisor Simulation
Stock 2/25/2019 Price 3/1/2019 Price Percent Change Portfolio Value SPDR S&P 500 ETF $279.52 $279.35 -0.06% $99,408.00
Table 3.2 Percent Change Week One for Robo-Advisor
27
3.2.3 Week Two
This week in simulation led to a -2.16% loss with the portfolio value going from
$99.408,00 to $97,260.79. This is the second straight week with losses. The change can
be summarized in the Table 3.3 below.
The performance of the SPDR S&P 500 ETF from 3/1/2019 to 3/8/2019 is
displayed in Figure 3.4.
Stock 3/1/2019 Price 3/8/2019 Price Percent Change Portfolio Value
SPDR S&P 500 ETF
$279.35 $273.32 -2.16% $97,260.79
Table 3.3 Percent Change Week Two for Robo-Advisor
28
3.2.4 Week Three
The third week in simulation led to a 2.89% gain, with the portfolio value going from
$97,260.79 to $100,070.81. This is the first week the simulation resulted in a gain. The
gain was large enough to move the portfolio value into a net positive for the whole
simulation. The change can be summarized in the Table 3.4 below.
The performance of the SPDR S&P 500 ETF from 3/8/2019 to 3/15/2019 is
displayed in Figure 3.5.
Stock 3/8/2019 Price 3/15/2019 Price Percent Change Portfolio Value SPDR S&P 500 ETF $273.32 $281.22 2.89% $100,070.81
Table 3.4 Percent Change Week Three for Robo-Advisor
29
3.2.5 Week Four
The fourth week in simulation led to a 0.77% loss, with the portfolio value going
from 100,070$ to $99,300.26. This is the third out of four weeks with losses. The loss puts
the total portfolio value in the negative again. The changes are summarized in the Table
3.5 below.
The performance of the SPDR S&P 500 ETF from 3/15/2019 to 3/22/2019 is
displayed in Figure 3.6.
Stock 3/15/2019 Price 3/22/2019 Price Percent Change Portfolio Value SPDR S&P 500 ETF $281.22 $279.05 -0.77% $99,300.26
Table 3.5 Percent Change Week Four for Robo-Advisor
30
3.2.6 Week Five
The fifth week in simulation produced a 1.20% gain, with the portfolio value going from $99,300.26 to $100,491.86. This week’s gain brings the total portfolio value back over the original $100,000. It is also the second consecutive time the weeks have
swapped from gains to losses, possible indicating a trend for this month. The changes
are summarized in the Table 3.6 below.
The performance of the SPDR S&P 500 ETF from 3/22/2019 to 3/29/2019 is
displayed in Figure 3.7.
Stock 3/22/2019 Price 3/29/2019 Price Percent Change Portfolio Value SPDR S&P 500 ETF $279.05 $282.49 1.20% $100,491.86
Table 3.6 Percent Change Week Five for Robo-Advisor
31
3.2.6 Week Six
The sixth week of simulation produced a 2.06% gain, with the portfolio value going
from $100,491.86 to 102,561.99. This is the first time in the simulation that there have been two positive weeks in a row. This week’s gain brings the total portfolio value to the highest it has even been. The changes are summarized in the Table 3.7 below.
The performance of the SPDR S&P 500 ETF from 3/29/2019 to 4/05/2019 is
displayed in Figure 3.8.
Stock 3/29/2019 Price 4/05/2019 Price Percent Change Portfolio Value SPDR S&P 500 ETF $282.49 $288.31 2.06% $102,561.99
Table 3.7 Percent Change Week Six for Robo-Advisor
32
3.3 Results
The Total Portfolio Value went from $100,000 to $102,561.99. This is an increase
of roughly 2.56% in a six-week period. The average rate of return for a typical investor
annually is six to seven percent so 2.56% gain in this period is a great success. As
explained earlier in the section, I will be adding a one percent increase to the total value
of the portfolio. This change is to simulate the claim that WealthFront and Betterment
perform One to two percent better than the S&P 500. This brings the total portfolio value
from $102,561.99 to $103,587.60. A total portfolio value increase of 3.58%. Table 3.8 is
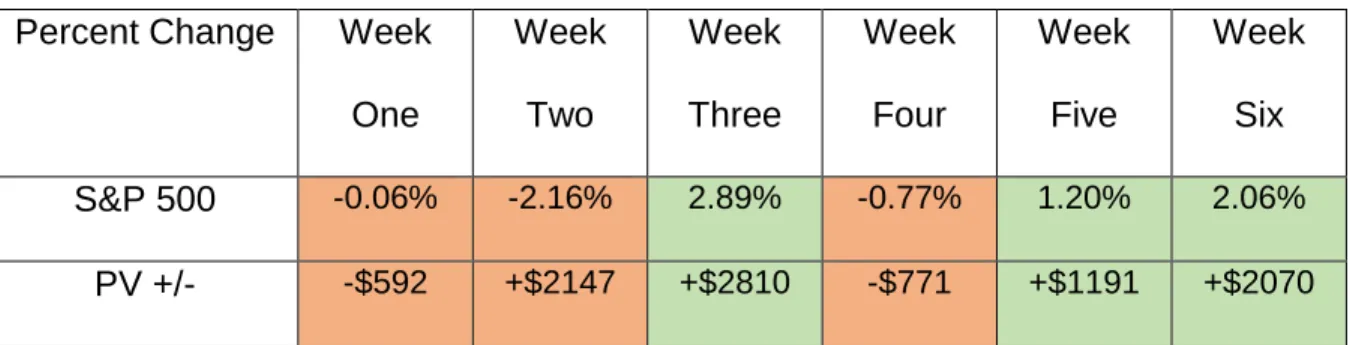
a summary of the S&P 500 Weekly Performance and Portfolio Value (PV) through the
simulation.
Percent Change Week
One Week Two Week Three Week Four Week Five Week Six S&P 500 -0.06% -2.16% 2.89% -0.77% 1.20% 2.06% PV +/- -$592 +$2147 +$2810 -$771 +$1191 +$2070
Some key notes to take from this simulation is that the average investors would
spend no time looking into metrics, finding stocks, and re-allocating money. This is a
passive buy-hold method, and Robo-Advisors main selling point is that they do the work
for you compared to an active investing method like CAN SLIM that will be simulated later
in the report. Furthermore, the simulation reinforced that Robo-Advisor investing has a
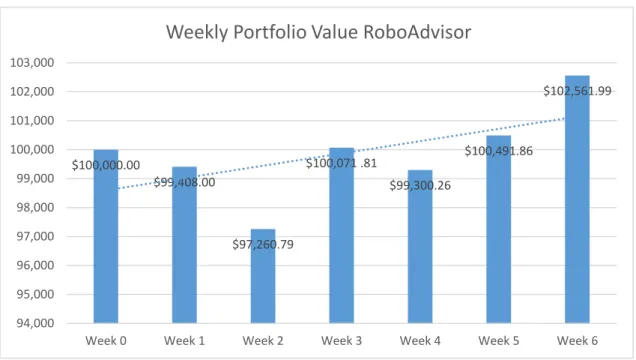
small risk factor, based on the low percentage losses and gains. Figure 3.9 shows the
change in the total portfolio value and the trendline for the six-week period. Table 3.8 Percent Change Week Six for Robo-Advisor
33
$100,000.00 $99,408.00 $97,260.79 $100,071 .81 $99,300.26 $100,491.86 $102,561.99 94,000 95,000 96,000 97,000 98,000 99,000 100,000 101,000 102,000 103,000
Week 0 Week 1 Week 2 Week 3 Week 4 Week 5 Week 6
Weekly Portfolio Value RoboAdvisor
34
4. The CAN SLIM Method
This chapter will first include an explanation of what the CAN SLIM Method is. Next
it will detail the advantages, disadvantages, and features of using the Method. It will also
include a detailed explanation of how to use the method with metrics. Then a simulation
using the CAN SLIM method will be conducted. Methodology, results, and transactions
will be conducted weekly for a six-week period.
4.1 The CAN SLIM Method Background
4.1.1 What is the CAN SLIM Method
The CAN SLIM method is an investing Method that was developed by William J. O’Neil. He saw that many investors knew how to buy stocks but did not know when to buy or when to get out of a stock. He developed general rules that could be followed for
investors who want guidance. CAN SLIM is an acronym that is broken down into Current
Quarterly Earnings, Annual Earnings Growth, New Product Service, Supply and Demand,
Leader of Laggard, Institutional Sponsorship, and Market Direction. The simple rules have
been time-proven to generate results and the CAN SLIM Method is one of the more
popular investing methods used by many investors. The goal of the strategy is to look for
strong basic indicators and fundamentals of a company and buy these companies when
they are at a weaker position than they should be (Bajkowski, 2016).
4.1.2 Advantages/Disadvantages of using CAN SLIM Method
CAN SLIM is a step by step approach to the “Buy Low Sell High” Method. By providing the investor indicators and metrics to look for in stock, the investor can feel more confident with their stock purchase knowing it’s based on time-proven metrics.
35
The CAN SLIM Method has the capacity for massive growth in a short period of
time. The method thrives in bull markets and bubbles. When the market is strong, the
CAN SLIM Method can make more money than traditional mutual funds or
Robo-Advisors.
CAN SLIM provides information of how to get into a stock uptrend when the stock
has 2/3 of its growth left. In other words, it will help prevent the investor from buying stocks
when the stock has already reached its peak momentum. This again can be an advantage
to make decisions more efficiently compared to passive investing where the money
follows the ups and down of market (Bajkowski, 2016).
Potential Disadvantages:
The CAN SLIM, method does not work well in a bear market. With Robo-Advising
and other mutual or index funds, although the market is falling, continuously adding
money into the account will help build a foundation for when the market is good. In CAN
SLIM a bear market could mean major losses if investors don’t react to the economic downturn indicators. CAN SLIM is riskier than other investment strategies and that is why
it can yield the greatest rewards. Furthermore, because CAN SLIM is a short-term
operator, it may miss out on the long-term gains of other investment strategies. Figure
4.1 below shows a stock that CAN SLIM indicators would tell you to pull out of after the
first downturn. The method missed out on the major gains in the long-term future of Netflix.
CAN SLIM also require constant monitoring and a great deal of daily effort to be
36
4.1.3 How to Use the CAN SLIM Method
To use the CAN SLIM Method, an investor should look for companies that most
resemble the rules and indicators that are listed below. By checking quantitative and
non-quantitative metrics that are recommended, an investor can feel confident about
purchasing or letting go of a stock.
Current Quarterly Earnings:
Through basic finance tools, one can find the Current Quarterly Earnings of a
company. This indicator is extremely important, because it is what large institutional
investors look at when investing in a company stock. Generally, the CAN SLIM method
says that a good stock should have at least quarterly earnings of 25% and the better
stocks can have somewhere near 50% to 100%. To analyze these metrics, investors
should look for earning per share growth rate (Business Insider, 2011).
37
Annual Earnings Growth:
Annual Earnings Growth is another important metric that is recommended to use.
The Annuals Earnings Growth works in tandem with the Current Quarterly Earnings. It
shows that a company is strong on all ends and do not have any unknown problems that
is not aware to the public. Some of these issues could include falling demand for a company’s products, declining profit margins, or negative industry trends. Again, the metric to look at is, earnings per share growth, but this time annually instead of quarterly.
The baseline for this growth should be from 25% to 50% in each of the past two to three
years for a company to be considered a strong contender (Business Insider, 2011).
New Product or Service:
The third rule to watch for is if the company you are looking to invest in has the
capacity to grow, whether it is a revolutionary technology or an upgrade to an existing
technology, a new service or a new trend. Looking for companies like this can lead to
significant gain in a short period of time. Wall Street Investors are also looking for new
products and services that influence the market share (Business Insider, 2011).
Supply and Demand:
Supply and demand dominate many areas of life as they do in market activities. A
strong demand for a stock that has limited supply will drive that stock price up. An
oversupply with weaker demand will drive a stock price down. Therefore, CAN SLIM
investors have learned to look for high trading volume coupled with high price increases.
This indicates an increase in demand and decrease in supply, therefore the prices should
38
Leader of Laggard:
There are two types of companies that deliver gains. However, companies that
deliver gains are leaders that show great results where as companies that deliver gains
and lag show mediocre results. Investors can look at the relative price strength metric of
a company to find leaders vs laggards. The relative price strength works from price ranks
from 1 to 99. A 99-price rank means that a company has achieved more than 99 percent
of other stocks in its industry over the period selected. Generally, the CAN SLIM method
advocates to looks for stocks with at least a 70 on the relative price strength indicator.
Stocks in the 80 to 90 range are preferred (Business Insider, 2011).
Institutional Sponsorship:
This investigates whether a stock/company is “sponsored” by banks mutual funds, pensions, or other investors. Generally, if companies are trusting the retirement accounts
and pensions of their employees to a stock, then it has great confidence to perform well.
Many other investors look for Institutional Sponsorship too. If the stock an investor is
looking at is gaining attention from many places, chances are it is a stock that will have
rising stock prices. The benchmark is to look for stocks that have at least 3 institutional
39
Market Direction:
The Idea of CAN SLIM investing is to move with the market. There is a saying in
the CAN SLIM method that 3 out of 4 stocks will follow the market in a bull market and in
a bear market. Therefore, it is important to understand the difference between a bull and
bear market and how to recognize what market we are in currently. This way an investor
can invest in a bull market and pull out in a bear market (Business Insider, 2011).
During my simulation, I will be using stock screeners to find stocks that resemble
the guidelines and metrics to the CAN SLIM method the most. I will be using the stock
screener from Finviz to conduct this analysis. Finviz has many categories in which to
screen from. Figure 4.2 is a layout of their tools.
As shown above, Finviz has all the metrics explained by the CAN SLIM method
to narrow down my stock search. I will be using this screener to determine the strength
of the stocks I choose and to allocate money differently each week, based on the
screening results. Figure 4.3 is an example of how I can narrow down my search results Figure 4.2 Finviz Stock Screener Fundamental Indicators
40
even further using criteria search, with EPS, Institutional Ownership, Relative Strength
Index and other indicators I can choose.
41
4.2 Simulation
4.2.1 Methodology/Companies Chosen
The companies chosen in CAN SLIM trading simulation conducted are based off
the metrics involved in the CAN SLIM Methods. As explained above, the simulation will
use the Finviz Stock Screener to screen the companies that fit the metrics. The stocks
chosen will be attractive to CAN SLIM investors. For instance, although the CAN SLIM
method recommends a 25% increase in quarterly earnings, a more attractive company
would have a 30% increase. Therefore, the simulation would use the 30% benchmark for
quarterly earnings. The numbers could vary due to the individual requirements.
The benchmarks used in the simulation are listed below, as well as the FinViz
coding used to screen the stocks and the results of the screening are as follows:
30% Quarterly Earnings can be analyzed through earnings per share. 30% Annual
Earnings or more for past 5 years. Relative Strength Price of 80 or above, which is
analyzed through the Relative Strength Index. A Relative Volume indicator of 2.0 or
greater and an Institutional ownership of 30% or above.
Based on the above settings, the stock screener screened thousands of stocks
down to nine stocks that fit selected metrics as shown in Figure 4.4 below. The simulation
will choose four stocks, and the four stocks chosen will also consider the Supply and
42
The first three stocks chosen were the ones with significantly higher trading value
than the other stocks. These three stocks were Gray Television Incorporated (GTN) at
4,296,627 volume. The Rubicon Project (RUBI) at 3,004,607 volume, and Southwest
Airlines at 15,177,668 volume. These companies are significantly higher in trade volume,
as the other six companies are all less than 170,000 in volume. They are chosen using
Supply and Demand, a key methodology of the CAN SLIM method.
The last stock chosen is Champions Oncology (CSBR) with a trade volume of
168,478. This stock fits the New Product or Service category of the CAN SLIM. They are
in a very new and emerging market, have a lower trade volume with strong growth
indicating that they could be a New Product Leader.
Below is a summary of each of the companies and stocks chosen, along with their
recent performance history:
43
Champions Oncology:
Champions Oncology was founded on June 4, 1985. The primary function of the
company is the development and sale of oncology related drugs. The company has
shown tremendous fiscal growth. The average Annual Earnings Per Share (EPS) for the
past 5 years are 37.90% and an EPS this year of 79.20%. It’s Relative Strength Index (RSI) is 64.07, Relative Volume (RV) of 2.04. and a strong institutional ownership
percentage of 53.90%. Champions Oncology has high growth partly because it has the
highest strength in the New Product or Service category of CAN SLIM while having strong
results for all the other benchmarks. Figure 4.5 shows CSBR stock chart. (Rueters, 2019)
Gray Television Incorporated:
Gray Television Incorporated shown in Figure 4.6 was founded on January 25,
1897. It is a large television broadcast company owning 91 TV Markets including 150 Figure 4.5 Champions Oncology One Year Stock Performance
44
affiliates of NBC, ABC, and FOX networks. Gray Television network has an annual
earnings per Share growth over 30.20% in the last 5 years, and current year earnings of
83.50%. GTN also has a very strong Relative Volume of 5.33. Traders are watching and
using this stock. It has an RSI of 89.41. This is a high Strength Index but may indicate
that the stock is overbought already. Finally, it has a strong Institutional Ownership of
84.30% indicating institutions trust this stock to perform well. (Rueters, 2019)
The Rubicon Project:
The Rubicon Project was founded on April 20, 2007. Their primary function is to
offer technological solutions to automate the purchase and sale of advertising for buyers
and sellers. They make the advertising process and system easier to use for the average individual/company. The Rubicon Project’s annual EPS for the past 5 years is a staggering 138.75%. This is a significant difference in growth compared to the other
stocks in the simulation. The RSI is 81.73, and the RV is 7.55. This indicates that this Figure 4.6 Gray Television Incorporated One Year Stock Performance
45
could be a high performing stock. The Institutional Ownership is at a strong 70.40%.
Figure 4.7 shows the Rubicon Project Stock Chart. (Rueters, 2019)
Southwest Airlines:
Southwest Airlines was founded on March 9,1967. It is a passenger airlines
company that provides transportation all around the United States and near-international
markets. Southwest has an Annual EPS growth rate of 32.40% and earnings this year of
24.10%. It’s RSI is 57.49 and its RV of 3.11. Southwest has a strong Institutional Ownership of 81.30% percent. It is a very common and popular stock in the industry and
this is demonstrated by the Institutional Ownership. Figure 4.8 shows the Southwest
Airlines Stock Chart. (Rueters, 2019)
46
4.2.2 Week One
The simulation will start with an initial investment of 25,000$ in each of these
stocks. The stocks will be monitored by the metrics above and their performance.
Re-allocations will be made weekly to achieve the maximum profit by the end of the six-week
simulation. Table 4.1 shows the equal distribution of stock cost for each initial investment
and the number of shares purchased.
Table 4.1 Initial Investment for CAN SLIM Method Simulation
Date Stock Price Buy/
Sell
Shares Cost/Proceeds Profit /Loss Total Cash $100,000.00 2/24/2019 CSBR $8.91 Buy 2805 $24,992.55 0 $75,007.45 2/24/2019 GTN $18.15 Buy 1377 $24,992.55 0 $50,014.90 2/24/2019 RUBI $5.18 Buy 4826 $24,998.68 0 $25,016.22 2/24/2019 LUV $53.93 Buy 463 $24,969.59 0 $46.63.00
47
The first week of CAN SLIM trading generated staggering increases in total portfolio
value. Table 4.2 is a summary of the Week One trading results.
Table 4.2 Percent Change and Portfolio Value for Week One Stocks
The first week of simulation created a portfolio growth to $117,226.53 total for an
increase of 17.23%. Champions Oncology has the greatest single stock growth of
28.17%, followed by Gray Television with 24.29% and Rubicon with 16.02%. Southwest
Airlines results were disappointing compared to major gains of the other three stocks in
the simulation with an increase of only 0.78%. The inclination is to allocate stocks from
Southwest to the higher percent increases, however with the CAN SLIM approach this
simulation will monitor Relative Strength Index, Relative Volume, as well as performance
to make decisions on the future weeks. Table 4.3 reflects these metrics.
Table 4.3 Relative Strength Index, Relative Volume, and % Change Comparison WK 1
Stock 2/25/2019 Price 3/1/2019 Price Percent
Change Portfolio Value CSBR $8.91 $11.42 28.17% $32,033.10 GTN $18.15 $22.56 24.29% $31,065.12 RUBI $5.18 $6.01 16.21% $29,004.26 LUV $53.93 $54.35 0.78% $25,164.05 $117,266.53 Stock (RSI)/(RV) 2/24/2019 (RSI)/ (RV) 3/3/2019 Weekly Performance CSBR (64.07) / (2.04) (62.94) / (1.34) 28.17% GTN (89.41) / (5.33) (90.35) / (5.05) 24.29% RUBI (81.73) / (7.55) (82.93) / (3.49) 16.02% LUV (57.49) / (3.11) (49.06) / (1.78) 0.778%
48
The Performance of CSBR of 28.17% is strong and cannot be ignored, however the
Relative Volume (RV) of the stock took a major hit from 2.04 to 1.34. The RV of 1.34 is
below the recommended value of the CAN SLIM method. This may have been caused by
a large amount of selling in the stock and this selloff could continue into Week Two.
Therefore, for Week Two, I will not re-allocate any funds into CSBR and wait to see the
performance and metric changes after week 2. LUV (Southwest Airlines) although
positive for the week, had the most disappointing results comparatively. Furthermore, LUV’s RSI and RV are both below the recommended value of CAN SLIM. Based on the above observations, I will be selling all of LUV stock and reallocating funds into GTN and
RUBI. GTN has a strong showing of 24.29% gain, while keeping RV and RSI almost the
same throughout the week. This indicates that GTN has the potential for further growth,
and investors are not selling quite yet. RUBI took a hit in RV, but still has a healthy 3.49. With a strong RSI and great percent change as well, I plan to allocate a portion LUV’s shares into RUBI. Table 4.4 is a summary of my transactions before Week Two.
Portfolio Value of CSBR: $32,033.10 (2805 Shares)
Portfolio Value of GTN: $31,065.12 (1377) + $17,484.99 (775) = $48,550.11 (2152 Shares) Portfolio Value of RUBI: $29,004.26 (4826) + $7,494.47 (1247) = $36,498.73 (6073 Shares) Total Cash: $230.53
Date Stock Price Buy/
Sell Shares
Cost/ Proceeds
Profit/
Loss Total Cash
3/3/2019 LUV $54.35 Sell 2805 $25,164.05 $194.46 $25,210.68 3/3/2019 GTN $22.56 Buy 775 $17,484.99 $0 $7,725.69 3/3/2019 RUBI $6.01 Buy 1247 $7,494.47 $0 $230.53
49
4.2.3 Week Two
The second week of simulation produced a portfolio loss from $117,226.33 to
$111,285.40. This is percent change of approximately -5% from last week. Most of this
loss can be attributed to the -15.32% loss in Champions Oncology (CSBR) stock. I was
hesitant to re-allocate Southwest Airlines (LUV) stock to CSBR at the end of last week
because of the Relative Volume drop of CSBR. This hesitation proved to be a correct
one. The 15.32% loss highlights the large pendulum swings CAN SLIM traders must
consider. CSBR had a 28.17% gain last week and a 15.32% loss this week,
demonstrating the high risk, high reward nature of the CAN SLIM method. Gray (GTN)
Television Network also had a 4.08% loss this week, which is a minimal loss considering
a 24.29% gain last week. Rubicon Project (RUBI) was the only profitable stock of week
two with a 3.00% increase. The re-allocation of LUV stock into RUBI proved to be
beneficial for week two. Like the previous week, the simulation will now analyze the
changes in RSI and RV to decide on transactions for the coming week. Table 4.5 is a
summary of Week Twos performance and new portfolio values.
Table 4.5 Percent Change and Portfolio Value for Week Two Stocks
Stock 3/1/2019 Price 3/8/2019 Price Percent
Change Portfolio Value CSBR $11.42 $9.67 -15.32% $27,124.35 GTN $22.56 $21.64 -4.08% $46,569.28 RUBI $6.01 $6.19 3.00% $37,591.87 $111,285.40
50
The Relative Strength Index (RSI) and Relative Volume (RV) Analysis for Week Two is worrying for any CAN SLIM trader. The RSI and RV’s of each of the stocks have dropped dramatically. The most notable is the drop in Champions Oncology (CSBR) from
which also had a very poor weekly performance, RSI from 62.94 to 27.55 and a RV drop
from 1.34 to a 0.32, with a very poor weekly performance as well.
Investors have turned away from this stock. There is a potential for a large increase in
buying for Week Three for CSBR. However, according to CAN SLIM, I should re-allocate
funds to a different investment. The other two stocks also have struggling RSI and RV
metrics as shown in Table 4.6. Therefore, I used Finviz stock screener with the original
parameters in section 4.2.1 to find alternative stocks to invest in.
Table 4.6 Relative Strength Index, Relative Volume, and % Change Comparison WK 2
The stock screening led me to three results, one of them being Gray Television
Inc, wish is already included in the simulation. From the other two stocks, I chose to invest
in Energy Recovery Inc (ERII) as it has a larger Market Cap and a larger total volume
than Rice Bran Technologies. Energy Recovery Inc. has a Relative Volum of 4.94, and a
Relative Strength Index of 72.99. The Relative Volume is much stronger than the current
stocks in the simulation. Therefore, I will be re-allocating most of the capital in Champions
Stock (RSI)/ (RV) 3/3/2019 (RSI)/ (RV) 3/10/2019 Weekly Performance CSBR (62.94) / (1.34) (47.55) / (0.32) -15.32% GTN (90.35) / (5.05) (71.82) / (2.26) -4.08% RUBI (82.93) / (3.49) (83.53) / (1.34) 3.00%
51
Oncology stock to Energy Recovery Incorporated. I will keep Gray Television and
Rubicon stocks untouched. The reasoning for this is that Gray Television Inc. still has
strong metrics as it passed the week two stock screening. Rubicon Project had a positive
weekly performance despite dropping in metrics, indicating it has potential to rebound.
Table 4.7 is a Table of Transactions at the end of week two and Figure 4.9 is the results
of the stock screening for Week Two.
Table 4.7 Table of transactions before Week Three of Simulation
Portfolio Value of CSBR: $27,124.25 (2805) - $19,340.00(2000) = $7784.35 (805 Shares) Portfolio Value of ERII: $18,994.32 (2139 Shares)
Portfolio Value of GTN: $46,569.28 (2152 Shares) Portfolio Value of RUBI: $37,591.87 (6073 Shares) Total Cash: $576.21
Date Stock Price Buy/
Sell
Shares Total Cost ($) Profit/ Loss Total Cash 3/10/2019 CSBR $9.67 Sell 2000 $19,340.00 $1520 $19570.53 3/10/2019 ERII $8.88 Buy 2139 $18,994.32 $0 $576.21
52
4.2.4 Week Three
The third week of simulation produced an increased portfolio of $117,814.13 from $111,285.40. This week’s gains recovered last week’s losses and put the simulation portfolio value at the highest point since the start of the simulation. The change of the
portfolio this week was around 5.76%. A large part of the gain can be attributed to the
Rubicon Project (RUBI) with a weekly performance of 11.47%. RUBI was the only positive
stock of last week, it also increased in RSI, therefore it was a beneficial decision not to
sell RUBI stock last week. This week produced positive numbers for all stocks, CBSR
had a 4.75% gain, GTN a 3.70% gain, RUBI an 11.47% gain, and ERII a 2.48% gain. This
week is a great example of how powerful the CAN SLIM method can be. It is difficult to
have every stock perform positively on a week-to-week basis. Table 4.8 shows new
portfolio values for Week Three.
The decision to allocate Champions Oncology stock to the Energy Recovery
Incorporated turned out not optimal. CSBR has a 4.75% gain, while Energy Recovery has
a 2.48%. The idea of re-allocating CSBR stock was to minimize the losses if CSBR
continued to decline. Although the re-allocation was optimal, the minimization of risk was
worth the trade-off, as both stocks performed positively.
Stock 3/8/2019 Price 3/15/2019 Price Percent
Change Portfolio Value CSBR $9.67 $10.13 4.75% $8,154.65 GTN $21.64 $22.44 3.70% $48,290.88 RUBI $6.19 $6.90 11.47% $41,903.70 ERII $8.88 $9.10 2.48% $19,464.90 Total: $117,814.13 Table 4.8 Percent Change and Portfolio Value for Week Three Stocks
53
As analyzed in previous weeks, the simulation will look at the Relative Strength
Index (RSI), Relative Volumes (RV), and the Weekly Performance of each stock. (Table
4.9) Rubicon Project had a strong week, showed minimal loss in RSI and a large
increase in RV. Therefore, RUBI stock will not be altered. CSBR will also be untouched,
as CSBR has increased in RSI. GTN has a large portion of portfolio value at $48,290.
Although it has had a positive week, the RSI has decreased, and the RV has decreased
significantly down to 1.05. At the start of the simulation GTN had a 5.33 RV and now it
is down to 1.05. This indicates that investors are turning away from the GTN stock.
Furthermore, to minimize risk and diversify the portfolio I will again be using the Finviz
stock screener. With the CAN SLIM parameters input into the screener I found the
Huazhu Group Limited (HTHT) stock. HTHT has an RSI of 69.95 and an impressive RV
of 6.61. Table 4.10 is a summary of transactions made to reallocate the GTN stock to
HTHT.
Table 4.9 Relative Strength Index, Relative Volume, and % Change Comparison WK 3
Stock (RSI)/ (RV) 3/10/2019 RSI)/ (RV) 3/17/2019 Weekly Performance CSBR (47.55) / (0.32) (52.12) / 0.25) 4.75% GTN (71.82) / (2.26) (69.44) / (1.05) 3.70% RUBI (83.53) / (1.34) (80.85) / (2.60) 11.47% ERII (72.99)/(4.94) (67.57) / (2.13) 2.40%
54
Table 4.10 Table of transactions before Week Four of Simulation
Portfolio Value of CSBR: = $8154.65 (805 Shares) Portfolio Value of ERII: $19,464.90 (2139 Shares)
Portfolio Value of GTN: $48,290.88 (2152) -$19,994.04 (891) = $28,296.84 (1261 Shares) Portfolio Value of RUBI: $41,903.70 (6073 Shares)
Portfolio Value of HTHT: $19,715.20 (505 Shares) Total Cash: $855.05
Date Stock Price Buy
/Sell
Shares Cost/Proceeds Profit/ Loss
Total Cash
3/17/2019 GTN $22.44 Sell 891 $19,994.04 $3822 $20570.25 3/17/2019 HTHT $39.04 Buy 505 $19,715.20 $0 $855.05
55
4.2.5 Week Four
The fourth week of simulation dropped the total portfolio value from $117,814.13
to $113,013.50. Although the week produced the single largest drop in portfolio value,
this week was the first week where all weekly performances were negative. Three stocks
showed the most significant losses. GTN had a loss of 4.19%, RUBI had a loss of 4.93%,
and ERRI had the largest loss of 6.26%. Many of these losses can be attributed to
downward day of trading on Friday of this week (3/22) The Dow Jones lost nearly 500
points, and as it is an economic indicator, many stocks including the ones in this
simulation suffered. HTHT had a 0.10% loss and CSBR a 0.39% loss proving to be
resilient stocks in the face of negative indicators.
The decision to Sell GTN stock in favor of HTHT stock last week proved to be
beneficial. The RSI and RV drop in GTN was worrying considering about 30% of the
whole portfolio value was in GTN. The diversification was helpful as GTN had a 4.19%
loss while HTHT had a 0.10%. Following the RSI and RV indicators saved nearly $2000
in losses. Below is Table 4.11 summarizing week four performance and new portfolio
values.
Stock 3/15/2019 Price 3/22/2019 Price Percent
Change Portfolio Value CSBR $10.13 $10.09 -0.39% $8,122.45 GTN $22.44 $21.50 -4.19% $27,111.50 RUBI $6.90 $6.56 -4.93% $39,838.88 ERII $9.10 $8.53 -6.26% $18,245.67 HTHT $39.04 $39.00 -0.10% $19,695.00 Total: $113,013.50 Table 4.11 Percent Change and Portfolio Value for Week Four Stocks