NBER WORKING PAPER SERIES
THE WELFARE EFFECTS OF MEDICAL MALPRACTICE LIABILITY Darius N. Lakdawalla
Seth A. Seabury Working Paper 15383
http://www.nber.org/papers/w15383
NATIONAL BUREAU OF ECONOMIC RESEARCH 1050 Massachusetts Avenue
Cambridge, MA 02138 September 2009
For their helpful comments, the authors wish to thank Jay Bhattacharya, John Cawley, Amitabh Chandra, Mike Conlin, Susan Gates, Jonah Gelbach, Dana Goldman, Steven Haider, Eric Helland, Emmett Keeler, Anup Malani, Michelle Mello, Mark Showalter, Gary Solon, Bob Town, and Chapin White, as well as seminar participants at the University of Chicago, Cornell University, Georgia State University, Harvard Law School, the Medical University of South Carolina, Michigan State University, Rice University and the University of Houston, the 2006 ASHE meetings, the 2006 Conference for Empirical Legal Studies, the 2006 Medical Malpractice Liability Conference, the 2007 IHEA meetings, and the 2007 NBER Summer Institute. Jianglai Zhang and Qian Gu provided excellent research assistance. All errors or omissions are our own. Financial support for this research was provided by the National Institute on Aging (1R03AG025809). The views in this paper are those of the authors and do not represent those of NIA or the RAND Corporation. The views expressed herein are those of the author(s) and do not necessarily reflect the views of the National Bureau of Economic Research.
NBER working papers are circulated for discussion and comment purposes. They have not been peer-reviewed or been subject to the review by the NBER Board of Directors that accompanies official NBER publications.
© 2009 by Darius N. Lakdawalla and Seth A. Seabury. All rights reserved. Short sections of text, not to exceed two paragraphs, may be quoted without explicit permission provided that full credit, including © notice, is given to the source.
The Welfare Effects of Medical Malpractice Liability Darius N. Lakdawalla and Seth A. Seabury
NBER Working Paper No. 15383 September 2009
JEL No. I1
ABSTRACT
Policymakers and the public are concerned about the role of medical malpractice liability in the rising cost of medical care. We use variation in the generosity of local juries to identify the causal impact of malpractice liability on medical costs, mortality, and social welfare. The effect of malpractice on medical costs is large relative to its share of medical expenditures, but relatively modest in absolute terms—growth in malpractice payments over the last decade and a half contributed at most 5.0% to the total real growth in medical expenditures, which topped 33% over this period. On the other side of the ledger, malpractice liability leads to modest reductions in patient mortality; the value of these more than likely exceeds the cost impacts of malpractice liability. Therefore, policies that reduce expected malpractice costs are unlikely to have a major impact on health care spending for the average patient, and are also unlikely to be cost-effective over conventionally accepted ranges for the value of a statistical life.
Darius N. Lakdawalla
Schaeffer Center for Health Policy and Economics University of Southern California
Los Angeles, CA 90089-0626 and NBER Darius.Lakdawalla@usc.edu Seth A. Seabury RAND 1776 Main Street Santa Monica, CA 90407 Seth_Seabury@rand.org
A.
Introduction
Both physicians and the broader public identify the spiraling costs of malpractice insurance and
lawsuits as a major problem facing the US health care system (cf, Blendon et al., 2002).
Physician groups such as the American Medical Association have advocated federal limits on the
damages that can be assessed in malpractice cases. Republican senators, governors, and even
presidents, have echoed this sentiment, and repeatedly pointed to rising malpractice costs as a
major driver of growth in health care spending.1 Even many Democratic politicians who oppose limits on damages show little faith in the present tort liability system. For instance, President
Obama has expressed opposition to damage caps, but he and Senator Hilary Clinton have
identified the current liability environment as a major contributor to adverse outcomes for
patients (Clinton and Obama, 2006).
The hardened political lines around malpractice reform belie major gaps in our
understanding of the issue. Both the CBO (2006) and the GAO (1999) have concluded that the
overall effects of malpractice exposure on total health spending and outcomes are simply not
known.2 Fueling the political debate have been several apparently contradictory facts about malpractice. Opponents of malpractice reform often note that malpractice payments are a
relatively small fraction – between 1 and 2 percent – of total expenditures on physicians.
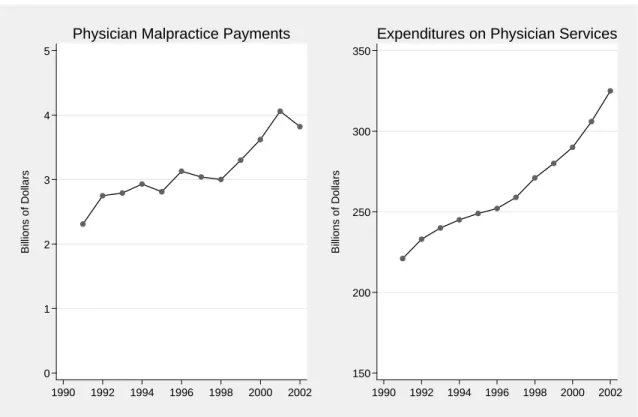
However, supporters of reform point to the recent and dramatic rise in malpractice costs, as
documented in Figure 1 (also see Mello et al., 2003). According to data from the National
1
President Bush reiterated his longstanding position in the 2007 State of the Union Address.
2
Two recent papers by Baicker and Chandra (2006; 2007) — post-dating the CBO and GAO reports — tackle the overall effects. Using cross-sectional and longitudinal variation by state, they find that malpractice risk has little impact on total costs, but substantial impacts on specific procedures, like medical imaging. As Baicker and Chandra note, however, a strategy for causal inference is required, in order to elicit the policy implications of these relationships.
Practitioner Data Bank (NPDB), from 1991 to 2002 physicians’ real annual medical malpractice
payments grew from $2.3 billion to $3.8 billion (65% growth).3 Over the same time period, real health expenditures on physician services grew from $221 billion to $325 billion (47% growth).4 Moreover, previous research provides a mechanism for even modest malpractice payments to
have a disproportionately large effect on total medical costs. Using data on elderly heart attack
patients, Kessler and McClellan (1996; 2002a; 2002b) find that the threat of liability from
medical malpractice causes doctors to practice “defensive medicine,” performing extraneous
(and expensive) tests and medical procedures to ward off the possibility of a malpractice suit.
The identification of “defensive medicine” by Kessler and McClellan has been confirmed
and deepened by a number of important studies. For instance, Currie and MacLeod (2008)
recently demonstrated that tort reforms impact the behavior of obstetricians both in the large and
even in subtly predictable ways. Baicker and Chandra (2007) find evidence that malpractice
pressure is associated with more diagnostic imaging. Other work has identified a relationship
between malpractice costs on the use of obstetric and pre-natal procedures (Tussing et al., 1994;
Corrigan et al., 1996; Dubay et al., 1999; Dubay et al., 2001), more general medical practices
(Bovbjerg et al., 1996), and the labor supply of physicians (Encinosa and Hellinger, 2005;
Kessler et al., 2005; Klick and Stratmann, 2007; Matsa, 2007; Helland and Showalter, 2008).5 While the mechanisms from malpractice to medical care have been carefully established,
the overall welfare consequences of reducing malpractice costs have not been as well
documented, for two reasons. First, much of the causal research on defensive medicine has
3
The malpractice payment figures are conservative, because they omit payments made by a state fund, and not all payments appear in the NPDB (Government Accounting Office, 2000).
4
Health expenditures are from the Census Bureau’s Statistical Abstract of the United States.
5
In contrast, however, other research has found that malpractice premium growth does not adversely affect the net income of physicians (Pauly et al., 2006).
justifiably focused on particular kinds of patients, so as to homogenize the study population. For
example, Kessler and McClellan caution that their studies were designed not to estimate the
impact of malpractice risk on total medical spending, but rather the impacts on the treatment,
costs, and outcomes of heart attack patients (Kessler and McClellan, 1996; Kessler and
McClellan, 2002a; Kessler and McClellan, 2002b). Other researchers have focused on different
subpopulations like expectant mothers (cf, Dubay et al., 1999; Currie and MacLeod, 2008).
Unfortunately, the effects of malpractice are not always uniform and are difficult to generalize
across the population (Congressional Budget Office, 2006).
Second, the dominant identification strategy to date has relied upon state-level tort
reform. The empirical evidence supports tort reform’s validity in the frequently studied contexts
of heart attack patients and expectant mothers (cf, Kessler and McClellan, 2002a; Currie and
MacLeod, 2008). However, questions have been raised about validity in the study of overall
medical costs and outcomes. Danzon (2000) argues that states with managed care may have
been more likely to adopt tort reform measures, and that the cost savings attributed to tort reform
could be a result of managed care itself.6 In the context of overall costs, the CBO finds empirical evidence consistent with this argument: reform states are more likely to have slower growth in
total health care spending prior to the reform’s adoption (Congressional Budget Office, 2006).
In this paper, we attempt to quantify the social welfare effects of medical malpractice,
and to do so with a new identification strategy. Our strategy relies on changes over time in the
generosity of local juries. Using this approach, we find that malpractice risk increases medical
spending in the aggregate, above and beyond its direct effects, but the total impact on overall
6
However, also see Arlen and MacLeod (2005), who point out that managed care organizations are generally not held liable for physician negligence.
medical costs is relatively modest. A ten percent reduction in malpractice costs would reduce
total health care expenditures by, at most, 1.2 percent. During the malpractice “crisis” of the
1990s, we predict this would have added about 5 percent to real hospital expenditure growth,
which exceeded 33% over this period. Using the same identification strategy, we find that, on
the margin, 10 percent increases in malpractice costs reduce mortality by a modest amount,
approximately 0.2%. Using values of a statistical life most commonly adopted by US regulators,
the value of the mortality decline more than likely outweighs the increase in medical costs. On
balance, reducing malpractice costs is more likely to harm than improve social welfare.
We proceed as follows. In Section B, we present our framework for analysis. Section C
describes our data sources. Section D investigates issues of measurement and identification.
Section E presents our results for costs, mortality, and overall welfare. Finally, we conclude
with a discussion of directions for future research.
B.
Analytical Approach
B.1 Theoretical BackgroundOur approach to welfare can be summarized in a stylized model with a single composite health
care output, q. The medical cost of this output is c(q). Total malpractice payments to patients,
MedMal, vary with output, since providers can be sued for the failure to diagnose, treat, or treat
appropriately (Kessler and McClellan, 1996). Therefore, the equilibrium value of q depends on
providers’ expectations about malpractice payments,7 which in turn depend on an exogenous variable X .
7
Specifically, quantity depends on the uninsured portion of expected malpractice costs, since fully insured providers have no incentives to reduce the probability of lawsuits. This
Malpractice payments themselves represent a pure transfer between providers and
patients. However, several studies have concluded that the deadweight costs of litigation are
approximately equal to payments to victims (Kakalik and Pace, 1986; Studdert et al., 2006).8 Therefore, we approximate the expected social cost of medical care, including malpractice, as:
{
SC(q,X)} {
E MedMal(q,X)} { }
E c(q)E = + (1)
The causal effect of exogenous changes in malpractice payments on social cost is then:
⎟ ⎟ ⎟ ⎟ ⎠ ⎞ ⎜ ⎜ ⎜ ⎜ ⎝ ⎛ ⎪ ⎭ ⎪ ⎬ ⎫ ⎪ ⎩ ⎪ ⎨ ⎧ + = ⎪ ⎭ ⎪ ⎬ ⎫ ⎪ ⎩ ⎪ ⎨ ⎧ dX dMedMal dX dq q c E dX dMedMal dX X q dSC E ) ( ' 1 ) , ( (2)
The first right-hand term (equal to unity) is the direct effect of malpractice, holding behavior
constant. The second captures the indirect effects on quantity often labeled “defensive
medicine” – the provision of services designed to ward off lawsuits. Converting to an elasticity:
⎟ ⎟ ⎟ ⎟ ⎠ ⎞ ⎜ ⎜ ⎜ ⎜ ⎝ ⎛ ⎪ ⎭ ⎪ ⎬ ⎫ ⎪ ⎩ ⎪ ⎨ ⎧ + = ⎪ ⎭ ⎪ ⎬ ⎫ ⎪ ⎩ ⎪ ⎨ ⎧ SC MedMal dX dMedMal dX dq q c SC MedMal E SC MedMal dX dMedMal dX X q dSC E ) ( ' ) , ( (3)
The “direct” component of the elasticity equals the share of malpractice in total medical costs.
An elasticity larger than this indicates the presence of an indirect behavioral effect.
If V(q) is the gross value of output to the representative consumer, we can write the
causal effect of expected malpractice cost on net social welfare as:
distinction is less relevant for hospitals, 40% of whom are self-insured (GAO, 2003). However, even market insurance fails to cover the substantial time and reputational costs associated with being sued (Kessler and McClellan, 2002b; Currie and MacLeod, 2008).7
8
While the social cost of out-of-court settlements are likely lower than that of litigation, we conservatively assume they are equal. This biases us in favor of malpractice cost reductions.
⎪ ⎭ ⎪ ⎬ ⎫ ⎪ ⎩ ⎪ ⎨ ⎧ ⎟⎟ ⎟ ⎟ ⎠ ⎞ ⎜⎜ ⎜ ⎜ ⎝ ⎛ + − = ⎪ ⎭ ⎪ ⎬ ⎫ ⎪ ⎩ ⎪ ⎨ ⎧ − X dMedMal dX dq q c X dMedMal dX dq q V E X dMedMal dX X q dSC X dMedMal dX q dV E ) ( ' 1 ) ( ' ) , ( ) ( (4)
The first term is the gross value (if any) of the additional output induced by malpractice. Due to
the relatively high economic value of life and the difficulty of measuring morbidity, we focus on
mortality as a single index of health care output.9 To evaluate welfare consequences, we assess whether the expected cost of malpractice in dollars per life saved is larger or smaller than the
(approximately constant) dollar value of a life to society, or:
) ( ' 1 ) ( ' ? q V dX dMedMal dX dq dX dMedMal dX dq q c E > ⎪ ⎪ ⎪ ⎪ ⎭ ⎪⎪ ⎪ ⎪ ⎬ ⎫ ⎪ ⎪ ⎪ ⎪ ⎩ ⎪⎪ ⎪ ⎪ ⎨ ⎧ + (5) B.2 Estimation Approach
The welfare criterion in expression 5 depends on the ratio between the cost effect of malpractice,
and its mortality effect. Estimating these two quantities is complicated by reverse causality and
measurement error. If defensive medicine is effective, areas with high medical costs (or better
health outcomes) may have fewer lawsuits, precisely because providers are responding to
malpractice incentives. This reverse causality problem may bias ordinary least squares estimates
towards zero. In addition, providers respond not to actual malpractice cost, but to expected
malpractice costs, which are unobservable. The resulting measurement error reinforces the
problem of reverse causality by biasing estimated coefficients towards zero.
9
B.2.1 Empirical Framework
To address reverse causality and measurement error, we employ instrumental variables models
of the cost and mortality outcomes. Defining outcome Yct for county c at time t, we estimate:
(
)
(
)
ct t c ct ct i t c ct i t c ct ct t c ct ct ct X Z V MA e V MA b a MedMal E X MedMal E Y δ γ φ α α α ε γ φ β β β + + + + + = + + = + + + + + = − − v v 2 1 0 , , * * * 2 * 1 0 ) ( ) ( (6)(
MedMalct)
E* is the expected direct cost of malpractice in county c at time t. Providers’
behavior depends upon their expectations about malpractice costs, rather than the realized costs
in any given period. While these are unobserved, we proxy for currently expected malpractice
costs using past malpractice jury awards, and specifically, a moving average of past awards,
) (Vc,t i
MA − .10 Zct is our instrument, which is discussed below. Xc,t v
is a vector of other county
characteristics, including county demographics and the composition of cases (timed to coincide
with MA(Vc,t−i)). φc and γt are county and year fixed-effects, respectively. For some
specifications, we run models at the hospital-, rather than county-level. These incorporate
hospital, rather than county, fixed-effects.
Substituting for the unobserved variable E*(MedMalct) yields the estimating equations:
ct t c ct ct i t c ct ct t c ct i t c ct X Z V MA e X V bMA a Y δ γ φ α α α β ε γ φ β β β β + + + + + = + + + + + + + = − − v v 2 1 0 , 1 2 , 1 * 1 0 ) ( ) ( ) ( ) ( (7)
As long as the instrument Zct satisfies standard validity conditions, we can consistently estimate
the extra medical cost incurred per life saved. This is the key welfare parameter on the left-hand
10
An alternative proxy would be total payments, including settlements. Unfortunately, settlement data are not available at the county-level. Below, we present evidence that, at the state-level, jury awards perform reasonably well at predicting total settlements.
side of expression 5. In other words, estimation of the welfare parameter is robust to the error in
measuring expected malpractice costs.
If the instrument satisfies the stronger condition of orthogonality to the measurement
error ect, we can also recover consistent estimates of β1. If this stronger condition fails to be met, the IV model will overstate the impact of malpractice on the outcome variables. All these
results are proven in Appendix A.
B.2.2 Approach to Identification
Increases in the generosity of local juries will tend to shift out expected malpractice costs. Total
jury awards consist of three components: economic damages, noneconomic damages, and
punitive damages. Economic damages represent concrete, measurable losses to the plaintiff,
including lost wages, medical costs, and other out-of-pocket costs. Since these incorporate
medical costs directly, we might be concerned that local trends in medical costs will drive
economic damages in an empirically problematic fashion. Punitive damages, very rare in
malpractice cases, are also less relevant.
Noneconomic damages, in contrast, compensate a plaintiff for his/her unquantifiable
“pain and suffering.” We argue that, when juries value the severity of this suffering, their
determinations are plausibly exogenous to local trends in medical costs, care, and outcomes.
Therefore, as our instrument, we use MA(Noneconc,t−i), past trends in mean noneconomic
damage awards per plaintiff victory, in county c. If the instrument is valid, unusually rapid
growth in noneconomic damage awards will lead to growth in expected malpractice payments,
but growth in medical costs, care, and outcomes will not cause changes in noneconomic
1. Noneconomic damage awards are statistically unrelated to past and current trends in
medical costs and mortality (Section D.2.1).
2. Current and past noneconomic damage awards predict future trends in medical costs
and mortality (Section D.2.1).
3. Past growth in noneconomic damage awards is correlated with increases in the
propensity of patients to file malpractice claims against providers (Section D.3).
4. Past growth in noneconomic damages is correlated with higher malpractice premia
(Section D.3).
Finally, we address a specific threat to validity. If jurors use simple “rules of thumb” to
construct noneconomic damages as a mechanical function of medical costs awarded, this would
invalidate the instrument. We show that, while plaintiffs’ claimed medical losses are highly
predicted of their economic damages award, they are entirely uncorrelated with the noneconomic
damage award (Section D.2.2). To be clear, this does not imply that noneconomic awards are
always uncorrelated with economic awards, rather it implies that the determinants of plaintiff
medical costs appear unrelated to pain and suffering awards. It is the latter condition that serves
as our identifying assumption, rather than a stronger claim about the independence between
economic and noneconomic damage awards.
C.
Data
Our econometric approach requires data on jury verdicts, medical costs, mortality, and
county-level characteristics. We measure medical costs using data from Medicare and total hospital
spending. These components together cover about two-thirds of health care spending exposed to
C.1.1 Jury Verdicts Data
We use the RAND Jury Verdicts Database (JVDB) to recover the verdicts data. The
RAND JVDB contains information from 1985 to 1999 on jury verdicts occurring in all counties
in the states of New York and California, as well as Cook County, IL (Chicago), Harris County,
TX (Houston), King County, WA (Seattle) and the counties in the greater St. Louis, MO area
(125 counties in all). These data cover 23.6% of the total US population, as of the 2000 Census.
Table 1 reports the geographic composition of the JVDB counties, ranked in decreasing order of
population size. The Los Angeles metro area accounts for about 15% of the population covered
by our sample, and the New York City metro area accounts for about the same. The cities
outside New York and California represent about one-fifth of the data’s population weight.
The data in the JVDB are collected from court reporter publications, trade publications
that provide trial attorneys with information on verdicts in local courts.11 The JVDB includes data on plaintiff win rates, average economic and noneconomic damage awards and type of
injury for medical malpractice and other tort cases.
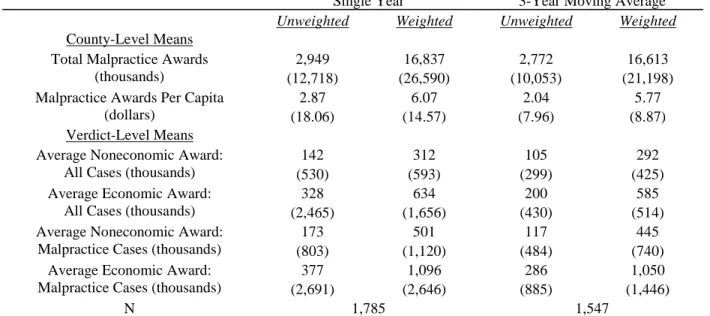
In Table 2, we present JVDB county-level averages for: total malpractice awards,
malpractice awards per capita, average noneconomic damages awards per plaintiff win, and total
jury verdict awards in all tort cases. The columns of the table present the current year’s average
(year t), along with 3-year moving averages, defined as the mean across years t − 1, t − 2,
11
Some researchers have noted that jury verdict reporters do not comprehensively cover all verdicts (cf, Vidmar, 1994; Moller et al., 1999; Eisenberg, 2001; Seabury et al., 2004). Earlier studies on the RAND JVDB used samples of public records to validate the data from several of the reporters used in this study. Peterson and Priest (1982) found that the Cook County Jury Verdict Reporter contained more than 90 percent of all verdicts in almost every year from 1960-1978. Shanley and Peterson (1983) found that the California Jury Verdicts Weekly contained more than 84 percent of 1974 and 1979 verdicts in San Francisco County. Moreover, the verdicts most likely to be omitted were contract and financial injury cases, which do not enter into the noneconomic damages instrument or the malpractice awards measure we use. Finally, verdict reporters represent a primary source of information upon which agents base expectations.
and t − 3. On a per capita basis, the average county hands out $2.87 in malpractice awards. Larger counties tend to award more per capita: the population-weighted county average is $6.07.
The average verdict in our sample involves a noneconomic award of $142,000, and an economic
award of $328,000, where both means are higher on a population-weighted basis. Malpractice
cases involve higher verdicts, due to higher noneconomic and economic damage awards.
C.1.2 Hospital Costs and Utilization
Data on hospital spending, utilization, and facilities come from the American Hospital
Association (AHA) database. Since 1946, the AHA has conducted an annual census of its
member hospitals. We use data from the 1980 to 2003 survey years.
Hospital administrators are surveyed about their total facility expenditures over the most
recent 12-month fiscal year, available resources at the end of that 12-month reporting period, and
resource utilization during that period.12 Hospitals report information longitudinally. All costs, here and throughout the paper, are deflated over time using the overall Consumer Price Index.13
The upper panel of Table 3 summarizes the expenditure and utilization data from the
AHA survey. Since our core regression models use the 1985-2003 data, we have restricted the
summary statistics to cover these years. The table shows the weighted and unweighted statistics
over the counties in our JVDB sample, as well as the corresponding numbers for all counties.
The average person in our sample tends to live in a county with slightly higher expenditures and
lower utilization than the average American, but these differences are typically around 5 percent.
While the differences are modest, the JVDB sample somewhat over-represents large counties.
12
In some cases, the length of reporting periods may vary, due for example to a hospital closure. In these cases, we annualize the expenditure and utilization numbers, based on the actual length of the reporting period.
13
For the usual well-known reasons, we do not use the medical care CPI (Boskin et al., 1997; Berndt et al., 1998). Therefore, our estimates include real growth in medical care costs compared to other goods.
Appendix B presents a formal statistical analysis demonstrating that this tendency does not alter
our primary empirical results. Since the data also over-represent New York and California,
Appendix G demonstrates and discusses the similarity of our key results across California, which
has noneconomic damage caps, and the uncapped state of New York.
C.1.3 County-Level Medicare Costs
From the Centers for Medicare and Medicaid Services (CMS), we obtained county-level data on
Medicare expenditures, from 1980 to 2003. Based on their administrative records, CMS reports
total Medicare Part A and B enrollees residing in a county, and total Parts A and B expenditures
for the residents of each county.14 Due to inconsistencies over time in the reporting of Medicare HMO data, we use Medicare fee-for-service expenditures and enrollees, with a focus on aged
(not disabled or end-stage renal disease) enrollees.
The Medicare data are summarized in the middle panel of Table 3. Part A is the inpatient
hospital insurance portion of Medicare that is free to all eligible Americans (over age 65 or
disabled). Part B covers physician visits, outpatient procedures, and diagnostic imaging.
Eligible individuals must pay a premium for Part B, but approximately 94 percent15 of Part A beneficiaries are enrolled in Part B. Therefore, we focus on costs per enrollee, rather than
impacts on enrollment per se.
C.1.4 County-Level Characteristics
Information on county-level demographics is taken from the Area Resource File (ARF). The
ARF collects county-level per capita income from the Bureau of Economic Analysis (BEA)
14
Ideally, we would have preferred measures of Medicare utilization by Medicare beneficiaries who sought care in a particular county, rather than those who live in a particular county. The mismatch induces measurement error in the dependent variable.
15
Based on CMS enrollment data from 2004, available from the authors or at http://www.cms.hhs.gov/MedicareEnRpts/Downloads/Sageall04.pdf
Local Area Income Tapes. The data on population are from the Census Bureau, which produces
estimates for intercensal years based on a demographic model of its own. The vector Xct
includes time-varying county-level demographic characteristics: proportion male, proportion
black, proportion white, income per capita and its square, and proportion of the population in
5-year age categories (one category for every five-5-year age interval between 0 and 85, and a single
category for 85+). These demographic data are summarized in the bottom panel of Table 3.
In addition, we control for the time-varying characteristics of the county’s jury verdicts,
based on the JVDB data, with a set of variables measuring the proportion of cases that fall into
each of the following mutually exclusive and exhaustive categories: no injury, physical injury
but no permanent disability, partial disability, permanent and total disability, death, or multiple
plaintiffs in the suit. This accounts for changes in the severity of injuries, which might affect the
size of awards. These covariates appear in both the first- and second-stage models.
D.
Measurement and Identification
D.1 Measuring Expected Malpractice CostWe measure the currently expected cost of malpractice using past malpractice trial verdicts from
the JVDB. Even though approximately 90% of malpractice claims are settled out-of-court, this
is theoretically plausible for two reasons. First, necessity may dictate the use of trial verdicts in
forecasting costs, since verdicts are publicly available, but out-of-court settlements are typically
confidential.16 Second, the expected size of a verdict will influence pre-trial negotiation and settlement. Therefore, information about past trial verdicts may be enough to draw educated
inferences about expected total costs, of verdicts plus settlements.
16
As we exploit later, state-level data on malpractice settlements are publicly available, but more local measures are not made public.
We think of expected costs as a function of past verdicts in a county, according to: ,...), , | (MedMalct Vc,t−1 Vc,t−2 E (8)
where Vc,t−i represents malpractice jury verdicts in county c and time t−i. To assess the
signal-to-noise ratio in this strategy, we turn to an external data source, the 1990-2005 National
Practitioner Data Bank (NPDB), which reports both malpractice jury verdicts and total
malpractice settlements, but only at the state-level. For state s at time t, we estimate:
st i i t s i st V MedMal =ϕ +
∑
ϕ +ω = − 6 1 , 0 (9)This regression tests past jury verdicts as predictors of current malpractice payments. Both the
payments and verdicts variables are calculated on a per capita basis.17
The results of this regression appear in Table 4, which reports models using 5 different
specifications, differing in the included lags. Column 1 reports a regression of MedMalst on
1 ,t− s
V through Vs,t−6, and the corresponding regression of MedMalst on the moving average of
1 ,t− s
V through Vs,t−6. Similarly, column 2 repeats this for lags Vs,t−1 through Vs,t−3, and so forth.
On their own, past malpractice verdicts explain a significant amount of the variation in
current malpractice payments. Six lags explain 74% of variation in payments, while the first
three lags alone explain 72%. Even historical lags have good explanatory power: lags 4 through
6 explain about 66% of the variation in current malpractice payments. This suggests that
malpractice verdicts are defensible, if imperfect, proxies of payments.
Second, for all models, we cannot reject the possibility that the coefficients on all the lags
are equal. As a result, we cannot reject the simplest measurement strategy of using moving
17
averages of jury verdicts as proxies for total malpractice costs. The regressions at the bottom of
the table explicitly test the relationship between moving averages of verdicts, and current
malpractice payments. In terms of R-squared, almost nothing is lost by moving from the
specification with individual lags to one with a combined, equal-weighted moving average.
D.2 Instrument Validity
As an instrument for expected malpractice costs, we use mean noneconomic damages awarded
by juries in plaintiff victories. The identifying assumption is the local trends in noneconomic
damages are not caused by local trends in medical costs and outcomes, or their determinants.
We provide evidence for this assumption, along with evidence that variation in noneconomic
damages is relevant, in the sense that agents throughout the medical and legal systems update
their beliefs and behavior in response to changing noneconomic damage awards.
D.2.1 Temporal Tests of Validity
We find that past medical costs do not affect contemporaneous or current noneconomic
damage awards, but past noneconomic damages do affect current medical spending. This
suggests that causality runs from the instrument to medical spending, and not in the opposite
(and invalid) direction.
To implement this test, we ran reduced-form versions of the instrumental variables model
in equations 7, where health expenditures are regressed on the (lagged values of the) instrument,
state and year fixed-effects, and all the exogenous covariates X. In addition to the
reduced-forms, we ran analogous models regressing current health expenditures on future values of the
instrument, as a falsification test. If health costs cause verdicts, we should see a relationship
between current costs and future noneconomic awards. Table 5 presents the results for four
inpatient utilization. There are 16 regressions testing the causal link from lagged noneconomic
damages to current medical spending (i.e., the 4 right-most columns); 11 yield significant effects
at the 10% level. On the other hand, only one of the 20 regressions testing the opposite effect —
of current health care spending on the current year or leads of noneconomic damages —are
significant. This result is not an artifact of differences in power, since the regressions have
narrower confidence intervals when we test for the reverse causality running from medical
spending to noneconomic damages. Also note that the current year regressions have the most
power, but fail to find any significant relationship. This is an important argument against the
possibility that juries use current growth in medical spending as a reason to raise awards, or that
an unobserved third factor simultaneously drives verdicts and medical spending.18
For utilization, we find little evidence of reverse causality, but also no reduced-form
effects. This is consistent with our later findings that malpractice has little estimated impact on
inpatient utilization.
D.2.2 Tests of Jury Behavior
Second, we conduct a direct test of whether juries link medical costs to noneconomic
damage awards. According to this hypothesis, juries award noneconomic damages as a simple
function of medical losses. If true, high growth in medical costs would cause higher
noneconomic damage awards. However, we find that plaintiffs’ claimed medical losses are
highly correlated with economic damage awards, but entirely uncorrelated with noneconomic
damage awards. Table 5 presents the results of this test for the 2,328 malpractice cases that
involved a plaintiff win in our sample.19 The first two columns of the table illustrate the
18
In addition, it demonstrates that serial correlation in the instrument likely does not cause bias by introducing a relationship from health care spending to future noneconomic damages.
19
estimated impact of claimed economic losses on the compensatory economic award granted by
the jury, with and without non-medical losses, respectively. The second two columns provide
similar estimates for the noneconomic award.
As we would expect, claimed medical losses affect the size of the economic award. An
additional dollar of claimed medical and non-medical losses is associated with about a $0.34 and
$0.22 higher award, respectively (medical and non-medical damages are jointly significant, but
only medical losses are statistically significant on their own). However, there is virtually no
impact of claimed economic losses on noneconomic awards. The point estimates are smaller by
at least an order of magnitude, and they are not statistically significant (individually or jointly).
D.2.3 Impact of Tort Reform
The occurrence of tort reform generates a final potential validity issue to address. If in
fact tort reform is driven by overall medical expenditures, and if tort reform affects noneconomic
damages in our data, the instrument could be compromised. However, there are relatively few
reforms adopted in our sampled states during the time period of study. California has the
strictest reforms in our sample, and perhaps in the country, but these were adopted in 1979.20 Missouri adopted a damage cap at the very beginning of our sample (1986), but excluding the
initial year has no impact on our results. Illinois adopted reform in 1987, but it was ruled
unconstitutional that same year. Other observed reforms likely had little effect on damage
awards. For example, Texas adopted a cap on punitive damages in 1995, but punitive damages
are rare in medical malpractice cases, and should have little effect on expected payments
(Eisenberg et al., 1997).
20
Conceivably, one might still be concerned that California’s noneconomic damage growth is systematically different than that of other states, in a way that is related to health spending. However, we get substantially similar results when we estimate the effects excluding all counties in California, a finding discussed further in Section E.3, and Appendix G.
D.3 Power and Relevance of the Instrument
We begin by demonstrating a first-stage relationship between noneconomic damages and jury
verdicts in malpractice cases. We then provide evidence that noneconomic damages also
influence expectations about malpractice costs, and thus provide meaningful first-stage variation.
Table 7 displays the first-stage relationship between local trends in noneconomic
damages, and expected malpractice costs. The instrument is the average noneconomic damage
award, per plaintiff win, granted by juries in the county. The included endogenous variable is
the total value of malpractice awards, per county resident. The first-stage model is always run at
the county-level. For all the models with lagged noneconomic damages as the instrument,
first-stage power meets the “rule of thumb” suggesting a Wald statistic of 10.0 or better.
Our first stage treatment effect is meaningful only if noneconomic awards influence
expected malpractice costs for health care providers, insurers and patients. First, Section D.2.1
showed that past noneconomic damage awards predict current medical costs, but that the reverse
is not true, consistent with the theory that provider behavior is influenced by noneconomic
awards. Second, to verify that noneconomic awards influence the costs expected by insurers, we
show in Appendix D that higher past trends in county noneconomic damages raise county
malpractice premia currently charged by insurers. Finally, we show that noneconomic awards
influence the behavior of patients. Theoretically, higher noneconomic damage awards raise the
payoff to suing a provider,21 but only if patients believe that trends in noneconomic damages meaningfully predict the size of expected malpractice payments. Appendix E uses closed-claims
data from a California malpractice insurer to verify that local growth in noneconomic damages
21
For a summary of the literature on tort reform and lawsuit frequency, see Studdert, Brennan and Mello (2004).
increases the probability that physicians face malpractice claims, and the probability they will
face a claim with nonzero defense costs. Taken together, these findings suggest that agents use
past trends in noneconomic damages to update their expectations about malpractice cost.
E.
Results
E.1 Effects of Malpractice on Costs E.1.1 Hospital Costs
We estimate equation 6 at the hospital level. Since our first-stage equation for
malpractice costs is estimated at the county-level, this requires a two-sample IV approach
(Angrist and Krueger, 1992). We estimate the first-stage equation, use the predicted values for
malpractice in the second-stage, and calculate the standard errors via a bootstrap procedure. 22 The resulting instrumental variables estimates are given in Table 8. We model costs per
bed, costs per bed-day, and days per bed (in the bottom panel).23 We think of the first as an overall expenditures measure, the second as a price measure, and the third as a quantity.
Separate estimates are provided for the current measure of malpractice as well as each set of
moving averages.
Hospital costs account for the majority — approximately 60% — of total spending on
hospitals, physicians, and clinical services, which represent the segment of the health care market
22
Specifically, we use a cluster (or “block”) bootstrap that sampled all hospitals in a given county for each bootstrap replication. This embeds the underlying empirical assumptions that observations from different counties are statistically independent, but observations within a particular county exhibit dependence. In each of 500 bootstrap replications, we run IV models using county population as weights: if smaller counties have smaller hospitals with more
variance, weighting by population mitigates the effect of heteroskedasticity on the distribution of the bootstrap estimator.
23
We define bed-days as inpatient bed-days plus outpatient procedures. Implicitly, we regard an outpatient procedure as filling a hospital bed for one day.
exposed to malpractice risk. While the OLS models showed little relationship between
malpractice and hospital costs, the IV models suggest that malpractice risk raises “price” and
overall spending. There is no significant effect on total hospital quantity, although separate
specifications revealed that malpractice significantly reduces total inpatient days and admissions.
The overall elasticity of the hospital cost measures with respect to lagged malpractice cost ranges
from approximately 0.02 to 0.08. While the elasticity for hospital costs never exceeds 0.1, it is
considerably higher than the 0.01 or 0.02 that we would expect if we focused only on the direct
costs of malpractice. This indicates that there is a clear behavioral response of health care
providers to expected malpractice risk.
E.1.2 Medicare Costs
Medicare costs account for 30% of hospital costs and 20% of spending on physicians and
clinical services (2000 National Health Expenditures data). The lower panel of Table 8 studies
the relationship between malpractice costs and Medicare costs per enrollee. The IV estimates
suggest that malpractice risk raises Medicare Part A expenditures per enrollee, but has a
somewhat smaller impact on Part B spending, which consists of outpatient and physician
services spending. The elasticity for Part A spending ranges from 0.08 to 0.12. The elasticity
for Part B is around 0.03 to 0.06. The evidence suggests a substantial indirect effect of
malpractice — approximately 5-8% — on Part A spending.
The modest size of the Part B elasticities is consistent with earlier research finding small
overall effects of malpractice on Medicare Part B, in spite of considerable impacts on specific
diagnostic and imaging procedures (Baicker and Chandra, 2007). The modest size is also robust
E.1.3 Overall Effect on Costs
By analyzing total Medicare spending and total hospital spending, we cover
approximately 66% of total US health care spending on hospitals, physicians, and clinical
services, which is the segment of health care spending exposed to malpractice risk.24 Moreover, the uncovered portion is physician spending paid for outside Medicare. Our analysis suggests
that physician costs are less responsive to malpractice risk, as confirmed by other research
(Baicker and Chandra, 2007). Therefore, it seems plausible to assume that the effects of
malpractice on physician costs are no higher than our estimates for hospital costs.
Most of our estimated elasticities are quite close. For this calculation, we focus on the
3 −
t through t−5 moving average models, since those displayed the highest first-stage Wald statistic and are likely to display the best coverage rates as a result. The estimated elasticity of
malpractice on daily hospital expenditures is 0.078. Between 1991 and 2002, medical
expenditures grew by 34%, while malpractice payments grew by 65%. Our point estimate would
imply that, over this period, the growth in malpractice payments added 5.1% to the growth in
medical expenditures, or about 15% of the total growth.
In absolute terms, this is rather a modest effect, but disproportionate to the very small
share of malpractice in total medical spending. Doubling malpractice risk has a direct 2% impact
on spending at most, but the total effect could be as high as 8%. Therefore, doctors do change
their behavior in response to malpractice risk, even though the latter is not a major driver of cost.
24
According to 2000 National Health Care Accounts data, total hospital spending was $417bn, and total physician and clinical services spending was $289bn. Of the latter, $58bn was paid by Medicare. Finally, according to our CMS county-level data, fee-for-service spending on the aged was approximately 84% of the Medicare program, in the year 2000. Applying this ratio would suggest that we cover $49bn of Medicare physician spending.
E.2 Malpractice Growth and Changes in Mortality
Faced with the threat of malpractice liability, physicians may undertake actions that limit
risk to patients. As such, part or all of their behavioral response may improve outcomes for
patients. We use our identification strategy to estimate the impact of malpractice on total
county-level mortality rates, taken from the Multiple Cause-of-Death Mortality Data.25 Above, we argued empirically that our instrument is exogenous with respect to local
trends in health care costs, which did not appear to cause variation in noneconomic damages.
This empirical test also makes it unlikely that health-related trends in mortality cause variation in
the instrument. Appendix F provides further evidence on this point: past or current mortality
rates do not predict current noneconomic damages, but higher noneconomic damages in the past
are significantly related to lower mortality today.
An additional concern is the possibility that noneconomic damages influence mortality
through channels other than malpractice. For example, lower payoffs to litigation may
encourage people to avoid taking risks, when adverse outcomes are less well compensated. 26 To test this, Appendix F provides evidence that noneconomic damages significantly reduce
25
These are taken from the National Vital Statistics System of the National Center for Health Statistics (NCHS). The NCHS data provide detailed cause-of-death information on all deaths that occur in the United States. We aggregate to the county level, for every year between 1982 and 2003. Separate death rates are calculated for: total population, 20-64 year-olds, and 65+ year-olds. To protect individual privacy, county identifiers are provided only for counties with 100,000 people or more. Rather than exclude these deaths, we construct an aggregate “small California county” and “small New York county” by using weighted means for the other variables.
26
Rubin and Shepherd (2007) find that tort reform appears to reduce the number of non-automobile accidental deaths, an effect they attribute to behavioral responses — for example, individuals who are less protected by the tort system may take more care. However, they find no effect on auto accidents, which represent the bulk of individuals’ exposure to accident risk.
accidental deaths, but have little to no impact on accidental deaths. There and elsewhere,
limiting our analysis to non-accidental deaths has no quantitative impact on our results.
We estimate the effect of malpractice risk on the total mortality rate, and deaths among
individuals 20 to 64 or 65 and older. We did not disaggregate by specific causes of death
because these data fields are generally considered unreliable. The death rate is calculated as the
number of deaths per 1,000 members of the county population.
The results appear in Table 9. The elasticities for total death rates with respect to
malpractice costs are approximately 0.02. This implies that doubling malpractice costs lowers
the total death rate by 2 percent. The age-specific breakdowns suggest these effects are stronger
for the non-elderly, although this could be due to greater statistical noise in the estimates for the
elderly.
Overall, the results of Table 9 provide some evidence that exposure to malpractice costs
leads to modest reductions in mortality. The estimates are not uniformly precise, but consistently
negative and significant, at least for total deaths. Still, it is hard to draw policy inferences from
these results alone, because the confidence intervals often span ranges with inconsistent
implications for net social benefit.
E.3 The Welfare Consequences of Changes in Malpractice Cost
As we argued earlier, the policy-relevant output is the number of dollars saved per life lost by
exogenous changes in malpractice cost, or the left-hand side of expression 5. Moreover, the
statistical uncertainty around our estimates implies that we ought to examine the distribution of
this parameter, not just its point-estimate. Comparing this distribution to the value of a statistical
Our approach resembles the method of “cost-effectiveness acceptability curves” (cf,
Lothgren and Zethraeus, 2000; Fenwick et al., 2004), which calculates the empirical distribution
of the “dollars per life lost” parameter via a bootstrap methodology (whose technical
underpinnings are discussed in Appendix G). This distribution then implies a probability for
whether or not malpractice cost-reduction is cost-effective, conditional on a value of life.27 For example, suppose we adopt the view that the value of a statistical life is $6m. Suppose further
that the “dollars saved per life lost” parameter exceeds $6m about 40% of the time. In this case,
lowering malpractice costs at the margin has a 40% probability of improving net social welfare.28 To estimate the distribution of “dollars per life lost,” we use a bootstrap approach that
jointly estimates the variance in the estimates of costs and mortality. We use the same bootstrap
technique described earlier (see footnote 22), except here we use 1,000 replications, in order to
gain more precision for the estimation of probabilities. We separately calculate distributions for
the total population, and for the Medicare population.
To illustrate, we explicitly lay out the bootstrap algorithm for the Medicare analysis:
1. Randomly draw a county, and include all observations (years) from that county;
2. Repeat step 1, sampling with replacement, until the bootstrap sample of counties is
complete;
27
Conceptually, this is defined over the probability space containing our estimator of dollars per life saved.
28
Conceptually, we are calculating how many dollars of cost-saving per life lost are generated by a local average reduction in malpractice cost, due to lower noneconomic damage awards. At a minimum, this evaluates noneconomic damage caps, which are one of the most frequent malpractice reforms mentioned. If the local average treatment effects generalize, this provides insight into a broader class of reforms that limit malpractice cost.
3. Using the bootstrap sample constructed in steps 1 and 2, estimate the model in
equations 7 using total Medicare spending per elderly beneficiary as the outcome
it
Y . This yields an elasticity of malpractice on Medicare costs, defined as εCM . 4. With the same bootstrap sample used in step 3, estimate the model in 7 separately
using county-level death rates for the over 65 population as the outcome Yit. This
provides the elasticity of malpractice costs on Medicare mortality, defined as εMM
.
5. Using estimates of total nationwide deaths and costs in the year 2000,29 dollars saved per life lost in the Medicare population is given by:
65 Age Over Deaths Total * Costs Medicare Total * MM CM M DPL ε ε ≡ (10)
A similar procedure is used to estimate dollars per life in the overall population. We first
estimate the model in equations 7 using total hospital costs per bed-day30 aggregated to the county level31 as the outcome Yit to derive the impact of malpractice costs on hospital costs,
denoted by εCT. Estimating the model using total county-level mortality as the outcome Yit then
yields its impact on deaths, called εMT. (We must assume that our hospital cost elasticity is not substantially different from the elasticity for other medical costs.32) These are then combined
29
The total number of deaths in the over 65 population was approximately 1.8m. Total Medicare spending was approximately $224.3bn.
30
Using hospital costs per bed or per capita would potentially understate the costs of malpractice, which seems to have at least small negative effects on hospital quantity.
31
We aggregated by taking the mean of hospital expenditures in the county, weighted by the number of hospital beds. We obtain qualitatively identical results if we fail to aggregate, but it is computationally faster to do so.
32
Our findings using Medicare Part B spending, which are corroborated by Baicker and Chandra (2007), suggest that non-hospital spending (other than non-specialty pharmaceuticals) responds at less than or equal to the rate of hospital spending. Moreover, our cost measures account for approximately two-thirds of all health care spending exposed to malpractice risk. In
with year 2000 data on total nationwide medical spending and total deaths, to estimate the
aggregate impacts.33 The estimate of dollars per life overall is:
Deaths Total * Costs Medical Total * MT CT T DPL ε ε ≡ (11)
We conducted 1,000 bootstrap replications. For completeness, we repeated this procedure for all
the various lag specifications reported in Table 8 and Table 9. Here, we present results using the
3 −
t through t−5` moving average specification, as this yielded the most powerful first-stage. Appendix G demonstrates that the results are qualitatively similar for the other specifications,
and across states with and without noneconomic damage caps.34 This appendix also shows that the bootstrapped model yields hypothesis test results that are quite similar to the asymptotic IV
results.
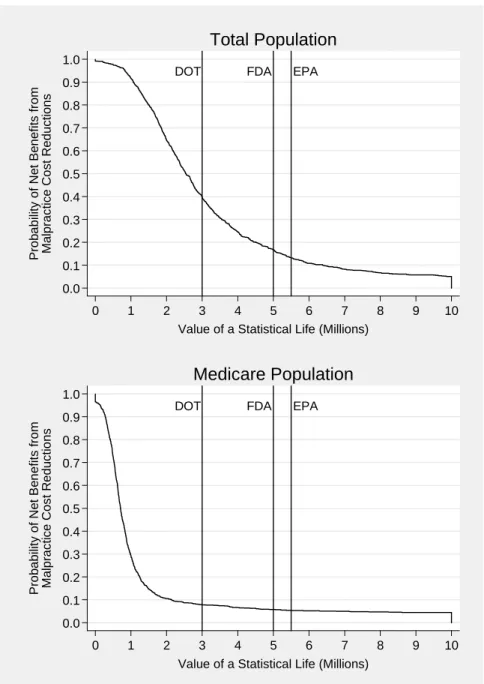
Figure 3 depicts the empirical cumulative distribution function for the estimated dollars
per life saved.35 For each dollar value, the Figure reveals the probability that dollars per life saved lies above that value, and thus the probability that malpractice reduction is
effective. The figure can be interpreted as a “menu” of policy implications for malpractice
cost-reduction, conditional on choices for the value of a statistical life.
2000, for example, hospital spending was $417bn; spending on physicians and clinical services was $289bn, of which Medicare paid $58bn.
33
The total number of deaths in 2000 was approximately 2.4m. Total medical spending in that year was approximately $1.4tr. One might argue that we should use total hospital
expenditures, but we use all expenditures to better proxy for the total impact of malpractice. Using only hospital expenditures would severely weaken the case for tort reform.
34
Appendix G demonstrates that these results are robust across the states in our sample with (California) and without (New York) noneconomic damage caps. This supports the anecdotal claim that California suffers from more litigiousness, which magnifies the cost impacts of malpractice and may offset the effects of its damage caps.
35
Technically, the figure, which is truncated above at $10m, illustrates one minus the empirical cumulative distribution function.
In the Medicare population, tort reform is more likely than not to be cost-effective for
values of a statistical life lower than $900,000. There is a stronger case for tort reform in the
overall population, but it is much shakier than reliance on the borderline significance of the point
estimates would suggest. Reductions in malpractice costs are more likely to be cost-ineffective
for values at or above $2.5m.
Using the figure to assess the desirability of reducing malpractice costs requires clarity on
the exact value of a statistical life. In a prominent literature review, Viscusi and Aldy locate the
value of a statistical life within the range of $5.5m to $7.5m (Viscusi and Aldy, 2003). In their
study on the social value of life-extension, Murphy and Topel (2006) advocate $6.3m as a
weighted average applicable to those aged 25 and 55. Others have dissented markedly.
Ashenfelter and Greenstone (2004) use the impact of speed limit increases on mortality to
conclude that the value of a statistical life is bounded above by $1.5m. Malpractice cost
reduction has a better than even chance of being cost-effective for values lower than $2m, but is
a poor bet for the values cited by Viscusi and Aldy, or used by Murphy and Topel. In general, a
nearly five-fold difference in this value makes it hard to draw unambiguous policy conclusions.
One way through the controversy is to follow the actual thresholds employed by US
regulators. The US Environmental Protection Agency typically makes decisions based on a
value of at least $5.2m (U.S. Environmental Protection Agency, 2002), while the Department of
Transportation (along with the Federal Aviation Administration) most often uses $3m (U.S.
Department of Transportation, 2002). Perhaps most directly relevant is the $5m number often
used by the Food and Drug Administration (FDA) to assess health risks.36 All these thresholds
36
If Medicare used such a number, that would be most relevant of all for our purposes, but they are discouraged from incorporating cost-effectiveness into their approval criteria.
would imply that, on the margin, malpractice reform is more likely to be cost-ineffective.
Therefore, any policymaker wishing to defend tort reform would need to depart from these
accepted US regulatory practices, and advocate a lower value of statistical life than
conventionally used, in order to justify their case.37
F.
Conclusions
The impact of liability for medical malpractice on the cost of medical care has been one
of the highest profile issues in debates over the U.S. health care system for many years.
Malpractice payments have grown enormously over the past 15 years, but this has likely had a
modest impact on the cost of health care in the US. It may have other significant effects, such as
decreasing the supply of physicians or changing the nature of treatment. Our findings, however,
suggest that limiting malpractice liability is no panacea for rising health care costs.
Moreover, while the mortality benefits of malpractice may be quite modest, these seem
more likely than not to justify its direct and indirect health care costs. Therefore, we conclude
that — for values of statistical life traditionally employed by US regulators —reducing
malpractice costs is not likely to be a worthwhile policy goal in itself. As emphasized by Currie
and MacLeod (2008), however, specific policies must be evaluated on a case-by-case basis, as
they can have unexpected effects on physicians’ expected liability and incentives. In addition,
there may be policies that reduce malpractice costs but have other social benefits; we do not rule
those out, but note that the case for their adoption rests on their auxiliary effects.
At a minimum, our analysis reveals the tenuousness of the case for tort reform, but it is
important to note its limitations. First, we account only for impacts of tort reform on medical
37
Agencies often take complex views that incorporate a range of values. The numbers given are “central tendencies” for each regulatory branch (Robinson, 2007).
costs and mortality, excluding its impacts (if any) on morbidity, physician utility, and patient
satisfaction. These quantities are extremely difficult to measure objectively. In addition, we do
not account for the adjustment costs (e.g., on the utilization of the health care system) that would
be induced by any large-scale reform project. The size and even direction of these excluded
effects is not clear. Finally, even if we ignore these limitations and accept the estimates at face
value, the probabilistic nature of our analysis means we cannot rule with (even approximate)
certainty for or against tort reform over conventionally accepted values of life.
Putting our results together with earlier work suggests that malpractice may have
substantial impacts on the care and costs of specific patient subgroups — like heart attack
patients — but much more modest impacts on the average patient, and on health care spending as
a whole. Future research should endeavor to determine whether tort reform can be targeted
toward these subgroups in a cost-effective manner.
Another important avenue for future work is to evaluate whether malpractice has effects
on more fine-grained outcomes in the health care system, such as morbidity, disability, or the
nature of care delivery. Medical costs and mortality are likely to be the first-order costs and
benefits of changes to the malpractice system, but the auxiliary effects may be quite significant.
If, for example, malpractice risk has had limited impacts on costs but appreciable positive
impacts on average outcomes other than mortality, the malpractice “crisis” may be anything but.
If, on the other hand, it has negative impacts on outcomes, the major costs of malpractice may be
References
Abadie, A. and G. W. Imbens (2006). "On the Failure of the Bootstrap for Matching Estimators." National Bureau of Economic Research Technical Working Paper 325. Cambridge, MA. Angrist, J. D. and A. B. Krueger (1992). "The Effect of Age at School Entry on Educational Attainment:
An Application of Instrumental Variables with Moments from Two Samples." Journal of the American Statistical Association 87(418): 328-336.
Arlen, J. and W. B. MacLeod (2005). "Torts, Expertise, and Authority: Liability of Physicians and Managed Care Organizations." RAND Journal of Economics 36(3): 494-519.
Ashenfelter, O. and M. Greenstone (2004). "Using Mandated Speed Limits to Measure the Value of a Statistical Life." Journal of Political Economy 112(1): S226-67.
Baicker, K. and A. Chandra (2006). "The Effect of Malpractice Liability on the Delivery of Health Care." B.E. Press Forum for Health Economics and Policy 8(4).
Baicker, K. and A. Chandra (2007). "Malpractice Liability and the Practice of Medicine in the Medicare Program." Health Affairs 26(3).
Baker, L. C. (2000). "Managed Care and Technology Adoption in Health Care: Evidence from Magnetic Imaging." NBER Working Paper 8020. Cambridge, MA.
Berndt, E. R., D. M. Cutler, R. G. Frank, et al. (1998). "Price Indexes for Medical Care Goods and Services: An Overview of Measurement Issues." National Bureau of Economic Research Working Paper 6817. Cambridge, MA.
Blendon, R. J., C. M. DesRoches, M. Brodie, et al. (2002). "Views of practicing physicians and the public on medical errors." N Engl J Med 347(24): 1933-40.
Boskin, M. J., E. R. Dulberger, R. J. Gordon, et al. (1997). "The CPI Commission: Findings and Recommendations." American Economic Review 87(2): 78-83.
Bovbjerg, R. R., L. C. Dubay, G. M. Kenney, et al. (1996). "Defensive medicine and tort reform: new evidence in an old bottle." Journal of health politics, policy and law. 21(2): 267-88.
Bureau of the Census (2007). Statistical Abstract of the United States: 2007. Washington, DC, US Government Printing Office.
Clinton, H. R. and B. Obama (2006). "Making Patient Safety the Centerpiece of Medical Liability Reform." New England Journal of Medicine 354(21): 2205-2208.
Congressional Budget Office (2006). Medical Malpractice Tort Limits and Health Care Spending. Washington, DC, Government Printing Office.
Corrigan, J., J. Wagner, L. Wolfe, et al. (1996). "Medical malpractice reform and defensive medicine." Cancer investigation. 14(3).
Currie, J. and W. B. MacLeod (2008). "First Do No Harm? Tort Reform and Birth Outcomes." Quarterly Journal of Economics 123(2): 795-830.
Danzon, P. (2000). Liability for Medical Malpractice. Handbook of Health Economics. A. J. C. a. J. P. Newhouse, Ed. New York, NY, Elsevier Science. 1.
Dubay, L., R. Kaestner, T. Waidmann, et al. (1999). "The impact of malpractice fears on cesarean section rates." Journal of health economics. 18(4): 491-522.
Dubay, L., R. Kaestner, T. Waidmann, et al. (2001). "Medical malpractice liability and its effect on prenatal care utilization and infant health." Journal of health economics. 20(4): 591-611.
Eisenberg, T. (2001). "Damage Awards in Perspective: Behind the Headline-Grabbing Awards in Exxon Valdez and Engle." Wake Forest Law Review 36.
Eisenberg, T., J. Goerdt, B. Ostrom, et al. (1997). "The Predictability of Punitive Damages." Journal of Legal Studies 26: 623-661.
Encinosa, W. E. and F. J. Hellinger (2005). "Have state caps on malpractice awards increased the supply of physicians?" Health Aff (Millwood) Suppl Web Exclusives: W5-250-W5-258.
Fenwick, E., B. J. O'Brien and A. Briggs (2004). "Cost-effectiveness acceptability curves--facts, fallacies and frequently asked questions." Health Econ 13(5): 405-15.