1
Effects of Monetary Reward and Punishment on Information Checking Behaviour Simon Y. W. Li a, Anna Cox b, Calvin Or c & Ann Blandford b
a
Department of Applied Psychology, Lingnan University, WYL Building, 8 Castel Peak Road, Tuen Mun, Hong Kong SAR
b
UCLIC, University College London, 2nd floor, 66 – 72 Gower Street, London, WC1E 6EA, UK ([email protected]; [email protected])
c
Department of Industrial & Manufacturing Systems Engineering, University of Hong Kong, Haking Wong Building, Pokfulam Rd., Hong Kong SAR ([email protected])
Corresponding author: Simon Y. W. Li
Email: [email protected]
Postal address: WYL-306, WYL Building, Lingnan University, 8 Castle Peak Road, Tuen Mun, Hong Kong SAR
Preprint accepted for publication in Applied Ergonomics DOI: http://dx.doi.org/10.1016/j.apergo.2015.10.012
Available online 6 Nov 2015
© 2015. This manuscript version is made available under the CC-BY-NC-ND 4.0 license http://creativecommons.org/licenses/by-nc-nd/4.0/
2 Abstract
Two experiments were conducted to examine whether checking one’s own work can be motivated by monetary reward and punishment. Participants were randomly assigned to one of three conditions: a flat-rate payment for completing the task (Control); payment increased for error-free performance (Reward); payment decreased for error performance (Punishment). Experiment 1 (N = 90) was conducted with liberal arts students, using a general data-entry task. Experiment 2 (N = 90) replicated Experiment 1 with clinical students and a safety-critical ‘cover story’ for the task. In both studies, Reward and Punishment resulted in significantly fewer errors, more frequent and longer checking, than Control. No such differences were obtained between the Reward and Punishment conditions. It is concluded that error consequences in terms of monetary reward and punishment can result in more accurate task performance and more rigorous checking behaviour than errors without consequences. However, whether punishment is more effective than reward, or vice versa, remains inconclusive.
(Word count for Abstract: 154)
Keywords
3 1. Introduction
Instead of focusing on how to prevent errors, error management considers how errors can be detected and recovered (Zapf & Reason, 1994). Error detection becomes important in mission-critical situations; for example, the NASA Mars Climate Orbiter, which costs about US$190 million, approached Mars at an erroneously low altitude and disintegrated. A contributing factor was that the wrong navigation information was sent due to an undetected incorrect unit conversion. Error detection is essential in safety-critical procedures such as medication administration: e.g., can a nurse easily detect any errors when programming an infusion pump? Can a doctor readily detect errors when prescribing medications using a computerized provider order entry (CPOE) system?
Despite the importance of error detection, there are only a handful of studies devoted to the topic: they range from experiments using statistical problem-solving tasks (Allwood, 1984) to computer application usage (Rizzo, Bagnara, & Visciola, 1987); and from diary studies (Sellen, 1994) to quasi-experimental field studies (Zapf, Maier, Rappensperger, & Irmer, 1994). These studies are primarily concerned with whether errors are detected and whether certain types of error (e.g. slips or mistakes) are detected more easily than others. In this paper, we add to the understanding of error detection by treating checking behaviour as an essential part of the detection process and ask the questions: can people be encouraged to check their own performance when it is discretionary? Can checking behaviour be motivated by reward and punishment?
A number of theoretical models of error detection have been proposed offering ways to describe detection processes. Reason (1990) proposes three main ways in which error detection can occur: (1) self-monitoring – detection happens through monitoring one’s own performance; (2) environmental cueing – errors detected via cues/feedback in the
4
environment; and (3) detection by others – errors detected by other people. Based on action control theories (e.g. Norman, 1981), Sellen (1994) proposes a similar taxonomy of error detection processes that includes action-based detection, outcome-based detection, detection by limiting function, and detection by other people. Action-based detection involves discovering errors by erroneous actions, outcome-based detection relies on the consequences of actions, and detection by limiting function is achieved via feedback from external constraints in the environment. More recently, Blavier, Rouy, Nyssen, and De Keyser (2005) developed a model of error detection based on prospective memory (Ellis, 1996) and highlights the importance of intention formation and retention in detecting errors.
A common theme that emerges from the above theoretical models is that regular monitoring or checking of one’s own performance forms an essential component in error detection processes. This is supported by empirical studies, for example, Allwood (1984) found that when his participants were asked to solve statistical problems, standard check, which involves checking of a solution for scrutiny purposes rather than correctness, was one of the main error detection processes. Nyssen and Blavier (2006) studied error detection behaviour in anaesthetists and obtained similar findings suggesting that anaesthetists detect their own errors largely by routine monitoring of the environment (standard check). Furthermore, standard check was adopted more among young anaesthetists whereas a wider range of detection processes was adopted by experienced anaesthetists. Taking together the findings on standard check, they suggest that it is a frequently adopted detection process with reasonable effectiveness; however, it seems like a basic method and more sophisticated processes are employed by experts with more domain experience.
Research in human-computer interaction (HCI) has shown that people are sensitive to information access cost, i.e. how easy or difficult to see or obtain a piece of information, when checking information. In a simulated video programming task, it was found that when
5
information about the to-be-recorded programme was made slightly difficult to access (in this case, the participants had to click on a grey box to reveal the information), the participants were less likely to check for the programme information that was even only one mouse-click away (Gray & Fu, 2004). More recent HCI studies have examined the effectiveness of different checking methods on catching data-entry errors (Barchard & Pace, 2011; Barchard & Verenikina, 2013). Double entry (data were re-entered a second time), read aloud (data entries were checked while they were read aloud by another person) and visual checking (verify by sight if there were any mismatched entries) were compared and both studies found that double entry was the most effective in catching data-entry errors. Moreover, the superior effectiveness of double entry was found in participants with and without data-entry experience. However, the question remains: what motivates checking in the first place?
Motivation has been highlighted in a theoretical discussion of human error analysis (e.g. Lourens, 1990) and it was suggested that if any model is to explain human error, it has to make explicit motivational as well as cognitive factors. The effect of motivation was examined by Skitka, Mosier, and Burdick (2000) in which participants were made to believe they were either accountable for their performance or not in flight-simulation tasks consisting of monitoring and tracking. Accountable participants were told that their performances were recorded and they would be required to explain and justify their actions. Non-accountable participants were told their performance data were not recorded and were not told anything about a post-experimental interview. The main finding suggests that accountable participants made fewer errors than non-accountable ones; and it was suggested that accountability made participants more attentive to their actions and more rigorous in their information seeking behaviour. Accountability can also have implications for an organisation’s safety culture and its employers’ attitudes towards errors (Dekker, 2009; Woods, Dekker, Cook, Johannesen, & Sarter, 2010). If accountability involves blame and punishment, then people will
6
consequently become defensive and unwilling to report their mistakes on the job. As a result, the organisation will not be able to learn from its mistakes.
Other forms of motivation have also been examined in a number of studies which looked at routine procedural errors. Instructional motivation has been found to have some effect in reducing certain procedural error but unable to completely eliminate it (Byrne & Davis, 2006). For example, Back, Cheng, Dann, Curzon, and Blandford (2007) tested a punishment manipulation, which reset participants’ scores in a computer game, and found that it was not effective in reducing a procedural error. The null effects of the punishment manipulations in these studies could be because of the impersonal nature of the manipulation. In other words, the punishment does not bear sufficient relevant (or personal) consequences to make it matter. In studying the effect of task interruption, Brumby, Cox, Back, and Gould (2013) manipulated a time cost associated with errors in a routine procedural task: participants would be locked out and not be able to resume a primary task for a period of time (e.g. 20 s). It was found that participants made fewer errors as a result of the increased cost of making an error. This suggests that when errors have consequences that matter, participants respond to them.
Another way to impose consequences on task performance is to use a monetary incentive. For example, to test how well alternative fuselage designs facilitated evacuation in an emergency, Muir, Bottomley, and Marrison (1996) offered a financial reward to the participants who managed to leave an aeroplane most quickly in a mock emergency situation. In basic psychological research, there is evidence that performance on a perceptual decision-making task is more affected by monetary incentives (earned points were converted into money) than symbolic incentives (earned points as indicative of performance) (Dambacher, Hübner, & Schlösser, 2011). Findings from EEG studies suggest that error-related negativity
7
(ERN), a neural signal associated with error behaviour, was affected by monetary losses (Potts, 2011) and gains (Stürmer, Nigbur, Schacht, & Sommer, 2011).
The effect of monetary reward was also tested in a computer based reaction time task (Wærsted, Bjørklund, & Westgaard, 1994), in which participants in a reward condition were told that good performance would earn them extra money; participants in a control condition did not receive such information. It was found that the reward condition led to improved performance in terms of faster reactions although the error rate did not differ from the control condition. In a recent study, the effect of monetary reward and time limit were tested in an auditory transcribing (hear-and-type) task (Lin & Wu, 2011). In the urgent condition, participants were instructed that they would be rewarded with extra payment for correct responses that were made within 600 ms. In the non-urgent condition, participants were paid a flat-rate regardless of task performance. It was found that although urgency led to improved typing speed, accuracy was compromised when compared to the non-urgent condition. This suggests that reward had a partial role in motivating fast task performance and the 600-ms time limit might have contributed to sacrificing accuracy. However, the design of the study does not allow one to draw definite conclusions regarding the effect of reward as it was compounded with time limit.
The objective of the work reported here was to examine the effects of reward and punishment under a single study because the two manipulations have not previously been concurrently tested. Specifically, the effects of monetary reward and punishment on checking behaviours will be compared in two experiments using a data-entry (or transcribing) task. 1 We focus our investigation on checking behaviour on a data-entry task because this type of task is common in many contexts: entering information into a library system, entering student marks from exam scripts into university system, entering items into an accounting system,
8
entering data into a contacts database, entering prescription information into a computerised physician order entry (CPOE), etc.
1.1 Overview of the experiments
Two experiments were carried out to examine the effects of three types of error consequence: reward, punishment and no consequence (control condition), in monetary terms, on checking behaviour in a simple computer-based data-entry task that involved transcribing data from one screen space to another. The idea of using monetary reward and punishment was to make consequences of errors actually matter to the participants rather than being purely symbolic as in previous research (Back et al., 2007; Byrne & Davis, 2006).
Experiment 1 was carried out with university students of liberal arts background and the data-entry task was framed as a library-loan task. Experiment 2 was run with university students studying medically related majors (e.g. medicine, pharmacy and nursing) and the task was framed as a medication task. The objective of the second experiment was to replicate the findings from Experiment 1 using a population sample with different academic training.
In the attention literature, motivation (in the form of reward and punishment) has been found to interact with visual attention leading to enhanced visual detection sensitivity (e.g. Engelmann, Damaraju, Padmala, & Pessoa, 2009). The measured behaviour that we were interested in is checking behaviour, which consists of voluntary actions and is largely a top-down control process. This is different from typical behaviour studied in visual attention experiments, which is visual selective attention and is mostly a bottom-up cognitive process (Chelazzi, Perlato, Santandrea, & Della Libera, 2013). Therefore, we partly motivate one of our hypotheses by the attention literature findings and make a directional prediction: error consequences which involve monetary reward (Reward condition) or punishment
9
(Punishment condition) will result in more rigorous checking behaviour than errors that do not have any associated consequences (Control condition). A corollary prediction follows that Reward and Punishment conditions will also lead to lower error rates than Control condition as a result of more rigorous checking. Although some studies suggest that monetary reward resulted in faster task performance when compared to a no-reward condition (Lin & Wu, 2011; Wærsted et al., 1994), these studies did not compare their reward condition to a punishment condition. This makes it difficult to assess any differential effect between reward and punishment. Moreover, existing studies examining the effect of monetary losses and gains did not test the two conditions in a single study (Dambacher et al., 2011; Potts, 2011; Stürmer et al., 2011), which makes contrasting the effect of reward and punishment inconclusive. Therefore, we tested the null hypothesis that there will be no difference between Reward and Punishment conditions.
2. Experiment 1
2.1 Method
2.1.1 Participants
Ninety students (age range: 18 – 27; mean age: 20.6) from Lingnan University took part in the experiment. There were 67 female and 22 male participants 2. One participant did not specify his/her gender. The participants’ academic background was liberal arts and their majors included social sciences, arts, philosophy, history, translation, languages, cultural studies and visual studies. Participants were paid HK$60 – HK$100 for their participation depending on their performance and which experimental condition they were assigned to.
10
The experiment was conducted in the Psychology Laboratory at Lingnan University. The experimental task was programmed in Visual Basic .Net. Each participant performed the task on a desktop computer with a 21.5-inch screen and wore headphones throughout the experiment to minimise potential distractions.
2.1.3 Task
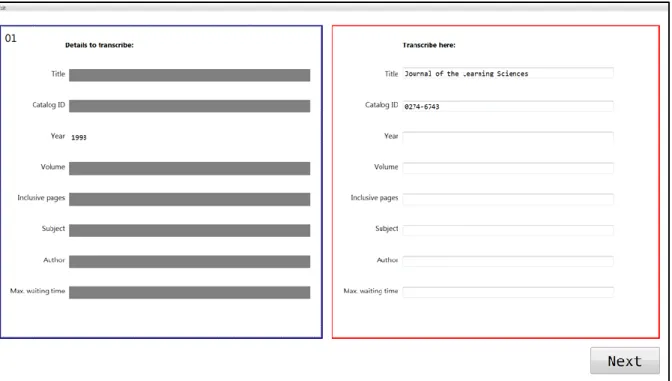
The experimental task was a routine data-entry task. The objective was to transcribe information in the grey boxes on the left panel to the corresponding text boxes on the right panel (Figure 1). In order to see the information in one of the grey boxes, the participant had to “uncover” it by placing the mouse cursor over it. Each grey box remained “uncovered” as long as the mouse cursor remained over it. However, the grey box appeared again when the mouse cursor was no longer within the box area. Only one grey box could be uncovered at any one time, and while it was uncovered control in the text fields on the right panel was deactivated, i.e. the participant was not able to enter any text. Also, when a grey box was uncovered, the displaying text could not be selected and highlighted by the mouse cursor and the right-click button was disabled. These two features helped to prevent participants copying and pasting information from the left to the right panel.
11
Figure 1: Screen shot of the Library task showing the field “Year” (left panel) being uncovered.
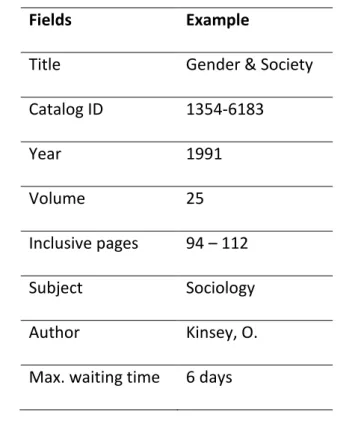
The task was framed as a Library task, in which participants were asked to find references by transcribing information (see Table 1). The information fields were chosen based on the inter-library loan system at Lingnan University. The information content in each of the fields, apart from the field “Title”, was all fictional. The rationale for framing this data-entry task as a Library task was to have a task with information forms that was familiar to the participant population, namely university students.
12
Fields Example
Title Gender & Society Catalog ID 1354-6183 Year 1991 Volume 25 Inclusive pages 94 – 112 Subject Sociology Author Kinsey, O. Max. waiting time 6 days
Table 1: Example of information content in the fields of the Library task
All actions performed by each participant and timing data were recorded for every task in an action log. Data were extracted from the action logs to give the dependent variables of interest: number of errors, number of checks, duration of checks and trial completion time.
2.1.4 Experimental design
The experiment had one between-subject independent variable, error consequence, with three conditions: Control, Reward and Punishment. In the Control condition, participants were told that they would be paid HK$100 for completing the task (“When you finish transcribing all
the trials, we will pay you $100 for your time.”). Participants in the Reward condition were told that they would be paid HK$60 for completing the task but gain an extra HK$40.00 if no errors were made (“When you finish transcribing all the trials, we will pay you $60 for your
time. However, if you make no mistakes in all of the trials, we will pay you an extra $40. And you will end up with $100.”). In the Punishment condition, participants were told that they would be paid HK$100 for completing the task but lose HK$40.00 if any errors were made.
13
(“When you finish transcribing all the trials, we will pay you $100 for your time. However, if
you make just one mistake in any of the trials, we will take $40 off your payment. And you will end up with $60 only.”)
However, when recruiting participants for the experiment, the recruitment advertisement (printed as posters posted around university campus) only mentioned that participants would be paid HK$60–100 depending on task performance. Specific information about reward or punishment was not mentioned in the advertisement.
The dependent variables are operationliased as follow:
Number of errors. An error was defined as any transcribed information that did not match the presented information. There were 8 information fields to be transcribed in each trial and each participant completed 40 trials; therefore, there were 320 error opportunities for each participant. Error rates were calculated as the number of errors divided by the number of error opportunities.
Number of checks. Two criteria were used to classify whether a checking behaviour had been exhibited on a particular information field: 1) a grey box is uncovered after the last keystroke made in its corresponding text box; and 2) each subsequent uncovering of the same grey box has to last for at least 500 ms. The second criterion is based on research on eye movements in reading, which suggest that eye fixation durations can range from 100 ms to over 500 ms, even for simple text (Rayner, 1978; Rayner and Duffy, 1986). A number of studies have shown that words that are frequently used (Just and Carpenter, 1980; Rayner, 1977) and that are predictable from the context (Ehrlich and Rayner, 1981; Zola, 1984) receive shorter eye fixations than infrequent words and contextually independent ones. Given that the stimuli that were used in the task were infrequent by nature and contextually independent, we have
14
chosen a minimum criterion of 500 ms (from a range of 100 ms – 500 ms) to indicate a fixation that should be long enough to suggest a check has been carried out.
Duration of checks. For each check, its duration (in ms) was also recorded, i.e. how long each uncovering lasted for.
Trial completion time. Mean task completion time (in s) was obtained for each condition by averaging the time it took each participant to complete all 40 trials.
2.1.5 Procedure
Participants were briefed by the experimenter that they were going to take part in a simple data-entry task in order to study how people use computers to transcribe simple information. The experimenter first demonstrated how the task was performed to the participants. The method for uncovering the grey boxes in order to see the information to be transcribed was explained. The experimenter also emphasised that the transcribed information has to be
exactly the same as the presented information to be counted as a successful transcription. Participants were also shown, on printed laminated slides, examples of incorrect transcriptions due to errors in upper/lower cases, spaces, and punctuation (Figure 2).
15
Figure 2: An example slide showing the participants the mistype of spacing can result in an error
Participants then received two practice trials in which they had to perform the transcription. Participants were given feedback on their performance at the end of the trials. Errors were pointed out and explained to the participants by the experimenter. The laminated slides with incorrect transcription examples were shown to the participants again to emphasize the sources of errors.
Participants moved on to the test trials and the experimenter read instructions out loud according to which condition the participant was assigned to. The instructions were also printed and placed next to the computer monitors as reminders throughout the experiment.
Participants were randomly assigned to one of the three experimental conditions. Each participant was required to perform a total of 40 trials, which were divided into 4 blocks. Participants were allowed to take a short break in-between block of trials. The entire
16
experiment lasted about an hour. Participants did not receive feedback during the trials to highlight any errors.
2.2 Results
Table 2 summarises the results of all three conditions in terms of four dependent measures: error rates, number of checks, duration of checks and trial completion time. Data from all 90 participants were analysed using a one-way independent ANOVA with condition as the independent factor on the four dependent measures.
Condition a No. of errors b Error rate c M (SD) No. of checks M (SD) Duration of checks (ms) M (SD) Trial completion time (s) M (SD) Control 173 1.8 (1.9) 4.2 (2.6) 1486.3 (512.0) 70.1 (15.4) Reward 94 .92 (1.2) 7.1 (3.6) 2108.7 (831.4) 79.9 (21.4) Punishment 88 .98 (1.1) 8.2 (4.0) 2140.7 (978.2) 86.0 (19.2) a
For each condition, n = 30. b No. of error opportunities = 9600.
c
Error rate is a percentage calculated as a ratio of no. of errors to the no. of error opportunities.
Table 2: Results of all dependent measures for each condition in Experiment 1.
2.2.1 Errors
Across all participants and conditions, the overall mean error rate was 1.2% (SD = 1.5) (355 errors out of 28,800 error opportunities). The one-way independent ANOVA showed a significant effect of error consequence on error rates, F(2, 87) = 3.561, p = .033, 2 = .05 3. Planned comparisons were performed and found a significant difference between Control and the two experimental conditions combined, t(87) = 2.663, or p = .009 (two-tailed), r = .28 4, suggesting that Reward and Punishment resulted in lower error rates than no error
17
consequence. Post hoc comparison, using Bonferroni correction, between the Reward and Punishment conditions was non-significant, p > .05.
An alternative error rate, referred to as post-first-error, was calculated based on the number of errors occurring after the first error trial. This was carried out in order to address a potential confound: despite the absence of performance feedback, if a participant somehow realised that he had made an error, there was no on-going motivation for him to maintain good performance for the rest of the experimental session. This is because the penalty consequence was manipulated such that a single error could lead to an overall reduction of payment. In other words, once an error is made, the participant would lose $40 regardless of subsequent performance. The overall post-first-error rate was 2% (Table 5 shows the rates for each condition). There was no statistical difference between the post-first-error rate and the error rate, F(1, 57) = 2.201, p > .05. This comparison was carried out to check whether participants had given up on the task (which would be indicated by an increased error rate) or not after an error was made. The non-significant difference between the two kinds of error rates suggested that the participants had maintained good performance throughout the experiment.
2.2.2 Number of checks
The one-way independent ANOVA showed that the number of checks did not conform to the assumption of homogeneity. Therefore, Brown-Forsythe F was used and a significant effect of error consequence on number of checks was obtained, Brown-Forsythe
F(2, 79.018) = 10.754, p < .001. Planned comparisons showed a significant difference between the Control and the two experimental conditions combined, t(77.779) = -5.02, p
< .001 (two-tailed), r = .49, suggesting that having reward or punishment as error consequences increased number of checks compared to no consequences. Post hoc
18
comparison using Bonferroni correction revealed no significant difference between the Reward and Punishment conditions, p > .05.
2.2.3 Duration of checks
The one-way ANOVA yielded a significant effect of error consequence on duration of checks
F(2, 87) = 6.413, p = .003, 2 = .11. Planned comparisons found significant difference between Control and the two experimental conditions combined, t(87) = -3.578, p = .001 (two-tailed), r = .36, indicating Reward and Punishment resulted in longer check durations than Control. Post hoc comparison with Bonferroi correction found no significant difference between Reward and Punishment conditions, p > .05.
2.2.4 Task completion time
The one-way ANOVA showed a significant effect of error consequence on task completion time F(2, 87) = 5.479, p = .006, 2 = .09. Planned comparisons revealed a significant difference between Control and the two experimental conditions combined, t(87) = -3.059, p
= .003 (two-tailed), r = .31, confirming that Reward and Punishment result in longer completion time than Control. But post hoc comparison with Bonferroni correction found no significant difference between Reward and Punishment, p > .05.
2.3 Discussion
The overall mean error rate obtained was low (1.2%), indicating that participants were properly following the instructions of the experiment, resulting in largely accurate task performance. When compared across the error consequence conditions, the Reward and Punishment conditions yielded significantly lower error rates than the Control condition (about half). The same difference was found in terms of number of checks, duration of checks suggesting that monetary reward and punishment as error consequences led to more frequent
19
(about 3 to 4 more checks) and longer checks (about 640 ms longer) than errors without consequences. These findings support our hypothesis that reward and punishment decrease transcribing errors via more rigorous checking behaviour. Trial completion times in the error consequence conditions were also longer (about 13 s) than the Control condition. The difference is likely to be a product of the more frequent and longer checks in the Reward and Punishment conditions.
Post hoc tests were used to compare the differences of the different measures between the Reward and Punishment conditions because no prior directional prediction was made. The results indicate that Reward and Punishment conditions did not lead to different error rates, checking behaviours or trial completion time. Therefore, the null hypothesis cannot be rejected, which provides inconclusive evidence about the relative effectiveness between reward and punishment in motivating checking behaviour and task performance.
3. Experiment 2
The second experiment had two aims: firstly, to replicate the findings of Experiment 1 in order to confirm the results’ reliability; secondly, to achieve clinical plausibility by using a medication transcribing task and involving university students studying medically related subjects. The experimental task in Experiment 1 did not have any safety-critical element and, as such, it lacked representativeness of the error consequences involved in safety-critical settings such as healthcare.
Data-entry tasks in healthcare are abundant as it was observed that in some hospitals the use of electronic systems like CPOEs by junior doctors mainly involved transcribing medications orders, that were already prescribed by senior doctors, from paper charts into the system (Baysari, Westbrook, Richardson, & Day, 2011; Jaensch, Baysari, Day, & Westbrook,
20
2013). And this transcribing process is largely routine and procedural like the experimental task in Experiment 1.
3.1 Method
3.1.1 Participants
Ninety students (age range: 18 – 28; mean age 21.3) from the University of Hong Kong took part in the experiment. There were 73 female and 16 male participants 5. One participant did not specify his/her gender. All participants were selected on the basis of studying a medically related major; their majors include medicine, pharmacy, nursing, dental surgery and medical engineering. Participants were paid HK$60 – HK$100 for their participation depending on their performance and the experimental condition they were assigned to.
3.1.2 Equipment
The experiment was conducted in the Ergonomics Laboratory at the University of Hong Kong. Similar to Experiment 1, each participant performed the experimental task on a desktop computer with a 21.5-inch screen and wore earmuffs to minimise potential distractions.
3.1.3 Task
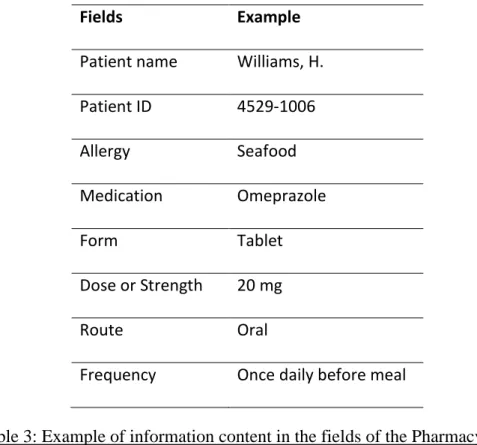
The task was adapted from that in Experiment 1, with a different cover story: it was a Pharmacy task in which participants were asked to transcribe medication information for fictional patients. The information fields and examples of content are shown in Table 4.
21
Fields Example
Patient name Williams, H. Patient ID 4529-1006 Allergy Seafood Medication Omeprazole Form Tablet Dose or Strength 20 mg Route Oral
Frequency Once daily before meal
Table 3: Example of information content in the fields of the Pharmacy task
The information fields were chosen to represent the most typical information present in electronic prescribing systems (Magrabi, Li, Day, & Coiera, 2010). Information content in the fields “Patient name”, “Patient ID” and “Allergy” were all fictional. All other medication related information was based on information found on the website drugs.com. All participants who took part in this experiment had medically related background, so they should have knowledge of the medication information used in the task.
3.1.4 Experimental design and procedure
The experimental design and procedure were identical to those in Experiment 1.
3.2 Results
Table 4 summarises the results for all four dependent measures across all three conditions. Data from all 90 participants were analysed using a one-way independent ANOVA.
22 Condition a No. of errors b Error rate c M (SD) No. of checks M (SD) Duration of checks (ms) M (SD) Trial completion time (s) M (SD) Control 57 .6 (.6) 7.2 (4.3) 1368.9 (409.5) 66.4 (14.1) Reward 30 .3 (.5) 10.4 (3.8) 1847.5 (678.0) 78.8 (15.1) Punishment 27 .3 (.3) 11.5 (5.0) 1970.2 (799.6) 80.1 (20.5) a
For each condition, n = 30. b No. of error opportunities = 9600.
c
Error rate is a percentage calculated as a ratio of no. of errors to the no. of error opportunities.
Table 4: Results of all dependent measures for each condition in Experiment 2.
3.2.1 Error rate
The overall error rate was 0.4% (114 errors / 28,800 error opportunities). The main effect of error consequence on error rate was significant, F(2, 87) = 4.094, p = .02, 2 = .06. Control differed from the two experimental conditions significantly, t(87) = 2.85, p = .005 (two-tailed), r = .3. But there was no significant difference between Reward and Punishment, p
> .05.
Comparison between the overall error rate (0.4%) and the mean alternative post-first-error rate (0.6%) (see E2 in Table 5) found no significant difference, F(1, 46) = 1.166, p > .05. This suggests that the participants had maintained performance throughout the experiment.
E1 E2
Condition n Post-first-error rate
M (SD) n Post-first-error rate M (SD) Control 25 2.30 (2.17) 20 0.77 (0.76) Reward 19 1.7 (1.62) 13 0.76 (0.89) Punishment 16 1.67 (1.09) 16 0.36 (0.57)
23
3.2.2 Number of checks
Number of checks was significant, F(2, 87) = 7.965, p = .001, 2 =.13. A significant difference was found between Control and the two experimental conditions, t(87) = -3.854, p
< .001 (two-tailed), r = .40. Reward and Punishment conditions did not differ, p > .05.
3.2.3 Duration of checks
Duration of checks was significant (with Brown-Forsythe F), F(2, 71.79) = 7.173, p = .001. Control differed from the the two experimental conditions, t(84.891) = -4.446, p < .001 (two-tailed), r = .43. But there was no significant difference between Reward and Punishment conditions, p > .05.
3.2.4 Task completion time.
Task completion time was significant, F(2, 87) = 6.107, p = 003, 2 = .10. Control and the two experimental conditions differed significantly, t(87) = -3.481, p = .001 (two-tailed), r
= .35. No difference was found between the Reward and the Punishment conditions, p > .05.
3.3 Discussion
The results of the current experiment successfully replicate the ones in Experiment 1, namely, the two error consequences conditions led to lower error rates (about half), more frequent checks (about 3 to 4 more checks), longer checks (about 540 ms longer) and longer trial completion times (about 13 s longer) than the Control condition. This replication provides confirmatory evidence supporting the hypothesis that monetary reward and punishment as error consequences led to more accurate transcribing performance because of more rigorous checking behaviours. The results also fail to reject the null hypothesis, which stated that Reward and Punishment conditions do not result in different checking behaviour and
24
transcribing performance. Therefore, no definite conclusion can be drawn about the relative effectiveness of reward and punishment as error consequences.
There is a decrease in the overall error rate: the current error rate is 0.4%, which is lower than the 1.2% obtained in Experiment 1. An independent sample t-test yielded a significant difference between the two experiments’ error rates, t(107.78) = 5.12, p < .001 (two-tailed). However, caution should be taken when interpreting the difference because cross-experiment comparison has low validity due to added confounds. Nevertheless, there were two main differences between the experiments: the sample population tested and the task context (in terms of information content and cover story). The participant sample in Experiment 1 was studying liberal arts subjects, whereas those in Experiment 2 were studying medically related subjects. Students with a medically related background might have received more emphasis on safety in their training than students with a liberal arts background and, hence, may achieve a lower error rate in overall performance. Another potential contributing factor to the lower error rate in Experiment 2 is the difference in the task context. The information content and cover story in Experiment 2 were designed to mimic a clinical setting, and this might have carried with it a more safety-critical signal than the library cover story and information content in Experiment 1. As a result, the safety-critical task context in Experiment 2 might have an effect in promoting more accurate performance than in Experiment 1. It is worth pointing out that even though the control error rate was lower in Experiment 2, there was still a significant effect of reward and punishment in reducing errors.
4. General discussion
The main finding from the two experiments suggests that error consequence consisting of reward or punishment led to a reduction of overall error rate (about half). And motivated checking behaviour resulting in more frequent (~3‒4 extra) and longer checks (~540‒640 ms
25
longer) than errors with no associated consequences. The finding lends itself to the conclusion that reward and punishment can both motivate more rigorous checking behaviour.
Although the overall error rates of both experiments are very low (< 2% in Experiment 1 and < 1% in Experiment 2), they are not to be underestimated in terms of consequences and quantity. In applied settings, such as health care, a mistyped prescription can result in severe consequences. Moreover, a busy hospital might have thousands of prescriptions to be processed and thousands of transcriptions to be carried out every day; therefore, an error rate as low as 1% could amount to a large number in terms of absolute value. This further highlights the small but significant reductions in overall error rates (~0.3‒ 0.9% decrease) across both experiments.
The reward and punishment manipulations of the current experiments are dependent on the accuracy of the participants’ performance, and one might doubt the practical implications of the current findings in situations where it is not possible to verify the accuracy of the data-entry performance. However, in many data-entry situations it is possible to verify one’s performance accuracy against the original data source. For example, when entering student marks from exam scripts into university system, it is possible to check the accuracy of the marks entered; when transcribing medication information into a CPOE, it is possible to verify the entered information against the original paper chart. Indeed when time and human resources are available, data-checking methods such as double-entry (entering the same data set twice) may be used to assess one’s performance accuracy (Barchard & Verenikina, 2013). However, if data-entry performance is to be verified in an actual work environment, it is likely to involve a data-entry system to couple with a separate verification mechanism. For example, a CPOE system can implement a mechanism to store any entered data as a log file in spreadsheet format, and when the data is entered a second time there will
26
be two spreadsheets to allow checking for inconsistent entries. Such a verification mechanism is, of course, only possible when double entry is adopted as a data checking method.
The current study furthers the understanding of error detection by showing that checking is an important component. Current results complement previous empirical findings (Allwood, 1984; Nyssen & Blavier, 2006) and theoretical formulations (Reason, 1990; Sellen, 1994) of error detection by offering a fine-grain look at checking behaviours in terms of check frequency and duration. Moreover, the current experimental paradigm and results not only allow one to examine the effect of error penalty (Back et al., 2007; Brumby et al., 2013; Byrne & Davis, 2006) but also reward (Lin & Wu, 2011; Wærsted et al., 1994) in the same study. It is also possible to look at the effect of error penalty in terms of checking behaviour and not just error reduction. To put the current study in the context of Reason’s (1990) categorization of error detection into self-monitoring, environmental cueing and detection by others: the current findings contribute to understanding self-monitoring in terms of how checking behaviour can be motivated.
Previous work shows that accountability for one’s action can improve task performance (Skitka et al., 2000); when this finding is viewed in conjunction with the current findings, they provide insights into error management from an organizational or system perspective suggesting more of a reason to move away from a blame culture that encourages punishing individuals for committing errors. Some human error researchers make a distinction between blame-free and accountability-free cultures (Woods et al., 2010) suggesting that if an error is seen as a crime, then “accountability means blaming and punishing somebody for it” (p. 233). This type of accountability is not advocated because it is retributive and does not encourage people to be open about their mistakes in order to learn from them. Instead, accountability should be enforced, but not by blaming or punishing the individual. This is expressed in the notion of a ‘just culture’ (Dekker, 2009), which
27
recognizes that no-one is infallible, but that there is a continuum from no-blame to blame, and that the challenge is to find an appropriate point on that continuum where errors are sources of learning but negligent behaviour is not accepted. In relation to the current findings, although no difference was found between the Reward and Punishment manipulations in promoting checking behaviours and transcribing performance, the evidence does not allow one to conclude that the two conditions result in no differences; nor is one condition more effective than the other in terms of error consequence. This is because failing to reject a null hypothesis does not mean it is true (Lane, 1993). Therefore, if the relative effectiveness of reward and punishment is inconclusive, as it is at this stage, then the long-term benefits of rewarding desired behaviour are likely to exceed those of punishing undesired behaviour, which may encourage people to cover up errors so that they are not available for learning.
4.1 Limitation and future direction
The current study has its limitations. Firstly, despite the post-first-error and error rate data in both experiments did not differ, which supported the notion that the participants either did not know they had made any errors or, even if they did, they did not just give up trying and performed badly. For future methodological improvement, a refinement to the manipulation could be made so that each error is associated with a reward or punishment, and feedback could also be provided for each trial. These changes would provide new conditions to further examine whether reward and punishment would result in different checking behaviour.
Secondly, the method of measuring checking behaviour involved counting the number of occasions in which participants clicked the grey box to uncover the information. Previous research (Gray & Boehm-Davis, 2000; Gray & Fu, 2004) had shown that “milliseconds matter” in so far as participants were less likely to look at a data source if they had to click to reveal it than if they just had to move their eyes to an always-available data source. Future
28
studies could use an eye tracker to measure checking behaviour using eye fixations. We would predict an increase in the number of checks made by participants.
Thirdly, although we have created a clinically plausible task context by creating a medication task and recruited students trained in medically related disciplines, future research should adopt field studies with an actual medication task and test the error consequence manipulation on practicing clinicians. However, obtaining clinical access and ethical clearance are by no means trivial tasks especially if one is to test an intervention in a clinical trial. Therefore, a plausible next step is to test the error consequence manipulation using existing medication tasks and clinicians in a controlled simulation study similar to those that have evaluated the effectiveness of checklists (White et al., 2010).
5. Conclusion
The two studies reported here contribute to our understanding of how error checking by individuals can be motivated. By making the participants more explicitly and personally aware that errors matter, monetary reward and punishment can both motivate checking behaviours. However, even with a significant financial motivation, errors still occurred, highlighting the impossibility of totally eliminating slip errors. These errors could have potentially serious consequences in contexts such as healthcare. In addition to using reward and punishment, a double entry system could make evaluating data-entry accuracy possible, and consequently safeguard against errors that are not caught just by visual checking.
29 6. Footnote
1. We will use the term data-entry and transcribing interchangeably as both terms refer to the same basic activity of copying information from one place to another.
2 The current overall female:male ratio at Lingnan University is about 70%:30%. This probably explains the high number of female participants in the experiment.
3. For 2, effect sizes of .01, .06 and .14 are suggested as small, medium and large respectively (Kirk, 1996).
4. For r, effect sizes of .1, .3 and .5 are suggested as small, medium and large respectively (Cohen, 1988).
5.The current overall female:male ratio at University of Hong Kong is about 60%:40%. However, we do not have the figures for students with medically related majors only.
30 7. Acknowledgements
We would like to thank Sze-yuen Yau and Jingya Guo for conducting the experiments, and Anthony Lam for programming the experimental task.
This work was supported by the Hong Kong Research Grants Council under Early Career Scheme (LU342912).
31 8. References
Allwood, C. M. (1984). Error detection processes in statistical problem solving. Cognitive science, 8(4), 413-437.
Back, J., Cheng, W. L., Dann, R., Curzon, P., & Blandford, A. (2007). Does being motivated to avoid procedural errors influence their systematicity? People and Computers XX—Engage
(pp. 151-157): Springer.
Barchard, K. A., & Pace, L. A. (2011). Preventing human error: The impact of data entry methods on data accuracy and statistical results. Computers in Human Behavior, 27(5), 1834-1839. doi:http://dx.doi.org/10.1016/j.chb.2011.04.004
Barchard, K. A., & Verenikina, Y. (2013). Improving data accuracy: Selecting the best data checking technique. Computers in Human Behavior, 29(5), 1917-1922. doi:http://dx.doi.org/10.1016/j.chb.2013.02.021
Baysari, M. T., Westbrook, J. I., Richardson, K. L., & Day, R. O. (2011). The influence of computerized decision support on prescribing during ward-rounds: are the decision-makers targeted? Journal of the American Medical Informatics Association, 18(6), 754-759.
Blavier, A., Rouy, E., Nyssen, A.-S., & De Keyser, V. (2005). Prospective issues for error detection. Ergonomics, 48(7), 758-781. doi:http://dx.doi.org/10.1080/00140130500123670 Brumby, D. P., Cox, A. L., Back, J., & Gould, S. J. (2013). Recovering from an interruption: Investigating speed− accuracy trade-offs in task resumption behavior. Journal of Experimental Psychology: Applied, 19(2), 95.
Byrne, M. D., & Davis, E. M. (2006). Task structure and postcompletion error in the execution of a routine procedure. Human Factors: The Journal of the Human Factors and Ergonomics Society, 48(4), 627-638.
Chelazzi, L., Perlato, A., Santandrea, E., & Della Libera, C. (2013). Rewards teach visual
selective attention. Vision Research, 85(0), 58-72.
doi:http://dx.doi.org/10.1016/j.visres.2012.12.005
Dambacher, M., Hübner, R., & Schlösser, J. (2011). Monetary incentives in speeded perceptual decision: effects of penalizing errors versus slow responses. Frontiers in psychology, 2.
Dekker, S. W. (2009). Just culture: who gets to draw the line? Cognition, Technology & Work, 11(3), 177-185.
Ellis, J. (1996). Prospective memory or the realization of delayed intentions: A conceptual framework for research. Prospective memory: Theory and applications, 1-22.
Engelmann, J. B., Damaraju, E., Padmala, S., & Pessoa, L. (2009). Combined Effects of Attention and Motivation on Visual Task Performance: Transient and Sustained Motivational Effects. Frontiers in Human Neuroscience, 3, 4. doi:10.3389/neuro.09.004.2009
32
Gray, W. D., & Boehm-Davis, D. A. (2000). Milliseconds matter: An introduction to microstrategies and to their use in describing and predicting interactive behavior. Journal of
Experimental Psychology: Applied, 6(4), 322. Retrieved from
http://media.proquest.com/media/csa/psycarticles-set- c/XAP/6/xap_6_4_322.pdf.pdf?hl=&cit%3Aauth=Gray%2C+Wayne+D.%3BBoehm-Davis%2C+Deborah+A.&cit%3Atitle=Milliseconds+matter%3A+An+introduction+to+micr ostrategies+and+to+their+...&cit%3Apub=Journal+of+Experimental+Psychology%3A+Appl ied&cit%3Avol=6&cit%3Aiss=4&cit%3Apg=322&cit%3Adate=Dec+2000&ic=true&cit%3 Aprod=PsycARTICLES&_a=ChgyMDE1MDcwMzAzNDUzNDY0OTo4ODM4MDISBzE wMDQ0ODkaCk9ORV9TRUFSQ0giDjIwMi40MC4xOTUuMTk1KgU2MDkzODIJNjE0M zYxMDk5Og1Eb2N1bWVudEltYWdlQgEwUgZPbmxpbmVaAkZUYgNQRlRqCjIwMDAv MTIvMDFyAHoAggElUC0xMDA3NTY3LTEyMTA3LUNVU1RPTUVSLW51bGwtMTEz MTY5NpIBBk9ubGluZcoBB0VuZE5vdGXSARJTY2hvbGFybHkgSm91cm5hbHOaAgdQc mVQYWlkqgIoT1M6RU1TLVBkZkRvY1ZpZXdCYXNlLWdldE1lZGlhVXJsRm9ySXRlb coCGUFydGljbGV8RmVhdHVyZXxVbmRlZmluZWTSAgFZ4gIBTvICAA%3D%3D&_s= %2FlSSSbBvnaVntZqTrDT%2BjRtVoGE%3D
Gray, W. D., & Fu, W.-T. (2004). Soft constraints in interactive behavior: The case of ignoring perfect knowledge in-the-world for imperfect knowledge in-the-head. Cognitive
Science, 28(3), 359-382. Retrieved from
http://onlinelibrary.wiley.com/store/10.1207/s15516709cog2803_3/asset/s15516709cog2803 _3.pdf?v=1&t=ibn2w2fy&s=95b7d1e2b90a9926246c37601cf04f04a0e4a233
Jaensch, S. L., Baysari, M. T., Day, R. O., & Westbrook, J. I. (2013). Junior doctors’ prescribing work after-hours and the impact of computerized decision support. International journal of medical informatics, 82(10), 980-986.
Kirk, R. E. (1996). Practical Significance: A Concept Whose Time Has Come. Educational and Psychological Measurement, 56(5), 746-759. doi:10.1177/0013164496056005002
Lane, D. M. (1993, 2013). HyperStat Online Statistics Textbook. Retrieved from http://davidmlane.com/hyperstat/B33945.html
Lin, C.-J., & Wu, C. (2011). Factors affecting numerical typing performance of young adults in a hear-and-type task. Ergonomics, 54(12), 1159-1174. doi:http://dx.doi.org/10.1080/00140139.2011.622794
Lourens, P. F. (1990). Theoretical perspectives on error analysis and traffic behaviour.
Ergonomics, 33(10-11), 1251-1263. doi:http://dx.doi.org/10.1080/00140139008925330
Magrabi, F., Li, S. Y., Day, R. O., & Coiera, E. (2010). Errors and electronic prescribing: a controlled laboratory study to examine task complexity and interruption effects. Journal of the American Medical Informatics Association, 17(5), 575-583.
Muir, H. C., Bottomley, D. M., & Marrison, C. (1996). Effects of motivation and cabin configuration on emergency aircraft evacuation behavior and rates of egress. The International Journal of Aviation Psychology, 6(1), 57-77.
33
Nyssen, A. S., & Blavier, A. (2006). Error detection: A study in anaesthesia. Ergonomics, 49(5-6), 517-525. doi:http://dx.doi.org/10.1080/00140130600568766
Potts, G. F. (2011). Impact of reward and punishment motivation on behavior monitoring as indexed by the error-related negativity. International Journal of Psychophysiology, 81(3), 324-331.
Reason, J. (1990). Human error: Cambridge university press.
Rizzo, A., Bagnara, S., & Visciola, M. (1987). Human error detection processes.
International journal of man-machine studies, 27(5), 555-570.
Sellen, A. J. (1994). Detection of everyday errors. Applied Psychology, 43(4), 475-498. Skitka, L. J., Mosier, K., & Burdick, M. D. (2000). Accountability and automation bias.
International Journal of Human-Computer Studies, 52(4), 701-717. doi:http://dx.doi.org/10.1006/ijhc.1999.0349
Stürmer, B., Nigbur, R., Schacht, A., & Sommer, W. (2011). Reward and punishment effects on error processing and conflict control. Frontiers in psychology, 2.
Wærsted, M., Bjørklund, R. A., & Westgaard, R. H. (1994). The effect of motivation on shoulder-muscle tension in attention-demanding tasks. Ergonomics, 37(2), 363-376. doi:http://dx.doi.org/10.1080/00140139408963652
White, R. E., Trbovich, P. L., Easty, A. C., Savage, P., Trip, K., & Hyland, S. (2010). Checking it twice: an evaluation of checklists for detecting medication errors at the bedside using a chemotherapy model. Quality and Safety in Health Care, 19(6), 562-567.
Woods, D. D., Dekker, S., Cook, R., Johannesen, L., & Sarter, N. (2010). Behind human error: Ashgate Farnham.
Zapf, D., Maier, G. W., Rappensperger, G., & Irmer, C. (1994). Error detection, task characteristics, and some consequences for software design. Applied Psychology, 43(4), 499-520.
Zapf, D., & Reason, J. T. (1994). Introduction: Human errors and error handling. Applied Psychology, 43(4), 427-432.