POLITECNICO DI TORINO
Repository ISTITUZIONALE
Floating car data (fcd) for mobility applications / Ajmar, A.; Arco, E.; Boccardo, P.; Perez, F.. - In: INTERNATIONAL
ARCHIVES OF THE PHOTOGRAMMETRY, REMOTE SENSING AND SPATIAL INFORMATION SCIENCES. - ISSN
1682-1750. - 42:2(2019), pp. 1517-1523.
Original
Floating car data (fcd) for mobility applications
Publisher:
Published
DOI:10.5194/isprs-archives-XLII-2-W13-1517-2019
Terms of use:
openAccess
Publisher copyright
(Article begins on next page)
This article is made available under terms and conditions as specified in the corresponding bibliographic description in
the repository
Availability:
This version is available at: 11583/2761234 since: 2020-02-11T16:07:22Z
FLOATING CAR DATA (FCD) FOR MOBILITY APPLICATIONS
A. Ajmar 1, *, E. Arco 2, P. Boccardo2,F. Perez 1
1
ITHACA, Via Pier Carlo Boggio 61, 10138 Torino, Italy – (andrea.ajmar, francesca.perez)@ithaca.polito.it
2 Politecnico di Torino – DIST, Torino, Italy – (emere.arco, piero.boccardo)@polito.it
Commission IV, WG IV/4
KEY WORDS: Mobility services, Road network, Floating Car Data, Traffic sensors, Traffic paths, Travel behaviour, Vehicle density
ABSTRACT:
Floating car data (FCD) is becoming more and more relevant for mobility domain applications, overcoming issues derived by the use of physical sensors (e.g. inductive loops, video observation, infrared and laser vehicle detection etc.), such as limited geographical distribution, measure inhomogeneities, limited or null coverage of minor roads. An increasing number of vehicles are equipped with devices capable of acquiring GPS positions and other data, transmitted in almost real-time to traffic control centres. Based on FCD data, several traffic analysis in support to mobility services can be performed: vehicle density, speed, origin-destination matrices, different patterns in function of vehicle type. If currently the representativeness of FCD can be considered an issue, current growing trend in FCD penetration should naturally overcome this issue. FCD are also higher sensitive to traffic events (e.g. traffic jams) than model-based approaches.
* Corresponding author
1. INTRODUCTION
Population travel behaviour modelling is a fundamental process in transportation planning and in the management of urban transportation systems. It plays a pivotal role in developing strategies that help alleviate urban traffic congestion (Hu et al, 2009) and support traffic management during special events and emergencies (Arco et al., 2017). Floating car data (FCD) is based on the collection of georeferenced data, by mean of GNSS receiver, inertial platforms, accelerometers and odometers, regarding speed, direction of travel and time information from on board unit (OBU) in vehicles that are being driven.
This data collection technique is becoming more and more relevant for mobility domain applications (Altintasi et al., 2017), in order to overcome some specific issues:
road network fixed sensors (based on induction loops or aerial configuration) able to collect similar data are not always sufficiently distributed over a given area, and their installation and maintenance is rather costly;
road network fixed sensors acquire different type of data that, not always, are characterized by a given homogeneity, conveying to the impossibility to analyse, with standard procedures, this data over larger areas;
road network fixed sensors are usually installed over main roads, being not able to analyse data also in collector’s and local roads; that means, for example, the impossibility to route and/or to build up Origin/Destination (O/D) matrix for consistent areas and/or for whole cities.
Schäfer et al., 2002, described an experience of generating comprehensive traffic analysis by means of consistent numbers of FCD, highlighting as this solution provides higher coverage than point sensors (e.g. inductive loops, video observation, infrared and laser vehicle detection etc.) and at lower costs. Due to the fact that an increasing number of vehicles are equipped with a “black box” that contains a GPS receiver
(typically fleets such as courier and freight services and private cars where this system allows insurance policy consistent savings), acquired data can definitely help in trying to solve the previously mentioned issues. This is also possible mainly because collected data, being transmitted to a control centre by using mobile phone network and/or on-board radio unit, are available in almost real time for further processing, having a reduced latency time related to network downloading speed. Authors took into consideration a significant amount of FCD data acquired in the city of Torino (Figure 1): a sample composed by more than 375.000 records acquired by devices mounted on almost 10.000 vehicles (Figure 2) collected over 17 consecutive hours (from 05/02/2019 17:00 CET to 06/02/2019 10:00 CET), in order to:
discuss and document the FCD data model and acquisition mode;
conciliate GPS positions with available Open Source (OS) road networks. Due to the intrinsic positional accuracy of the code coordinates GPS acquisition, planimetric position could be affected by positional errors (ranging from few centimetres to some meters) and, due to GPS multipath or shadowing effects, the coordinates could be affected also by gross errors;
transfer mobility impedances, intended as the relationship between road traveling time and traffic load pressure, are then calculated. Taking into account the data model defined at point 2), data are updated, assigning to every single arc of the road network travelling times and traffic load derived from the aggregation of all journeys (subdivided into private cars and fleet vehicles) and their timestamps;
using the updated dataset, different travel behaviour characteristics are analysed: a) fluxes and velocity over every single arc, using the total number of vehicles associated to the road network; b) fluxes and velocity over every single arc) traffic profiles, in different period of the day , over road network arcs and nodes; d) O/D spatial interactive matrix generation and updating.
The International Archives of the Photogrammetry, Remote Sensing and Spatial Information Sciences, Volume XLII-2/W13, 2019 ISPRS Geospatial Week 2019, 10–14 June 2019, Enschede, The Netherlands
All the described procedures have been compared with already operational mobility services based on fixed sensors (induction loops and aerial sensors), in order to benchmark (in term of cost, timeliness and information content) and discuss possible improvement of the delivered services and/or the service delivery to areas with a lack of fixed mobility sensors.
Figure 1. The municipality of Torino (in blue) and its metropolitan area
Figure 2. Number of records and unique vehicles in each one hour interval for the available sample of FCD
2. FCD DATA DESCRIPTION
FCD Data are acquired by On-Board Unit (OBU) mounted on board of vehicles, typically private cars linked to insurance policies, and trucks/vans managed in a fleet environment. One of the main information acquired by OBU is the position, acquired by means of a GPS receiver, using both a temporal and speed sampling interval: if longer distances are driven, shorter is the temporal sampling time, and vice versa.
Every acquired record is composed by different fields: time stamps, latitude, longitude, speed, heading, Horizontal Dilution Of Precision (HDOP, Langley, 1999), engine status, vehicle type (private car/fleet). Every single record is then assigned to a unique ID representing a unique vehicle. The field ID-DEVICE
represents the identifier of the OBU from which the record is generated and can be used as a proxy for unique vehicle. Acquired data are then transmitted in almost real-time to a data centre via mobile network or radio connection.
3. FCD DATA PROCESSING
Open Transport Map1 (OTM) is an open dataset based on OpenStreetMap2 data and accessible in a scheme compatible to INSPIRE Transport Network (Figure 3). In the framework of the present research activity, OTM has been used to generate a reference road network dataset. Associate the FCD positions with digital maps of urban roads enables travel behaviour analysis, such as the estimation of speed and travel time of vehicles on different roads (He et al., 2014). FCD positions has been uniquely assigned to a single OTM network element by means of the identification of the nearest road element to the FCD position: the distance between the two elements has been calculated and stored (Figure 4).
3.1 Positional accuracy
Analysing the statistical distribution of the distance between each FCD position and the nearest road element (Table 1), standard deviation value (approx. 13 m) is considered accurate enough to consider the attribution to road element accurate enough for the specific purposes of the analysis, i.e. to generate analysis to support mobility services at municipality level by mainly transforming single points to travel paths (see chapter 4), minimising in this way the impact of outliers (e.g. an FCD points wrongly assigned to the incorrect travel direction is overcome by the possibility of generating correct path direction, exploiting FCD timestamps). Therefore, all FCD positions, including those with high positional errors, have been considered (Ravanelli et al, 2018; Pirotti et al., 2018).
Figure 3. OTM road network within the Torino municipality area, symbolised on functional classes (green = motorways, orange = first class, yellow = second/third classes, grey = other
classes)
The information about the GPS signal quality, included in the FCD data structure and expressed in HDOP, is clearly
1
http://opentransportmap.info/
2
https://www.openstreetmap.org
The International Archives of the Photogrammetry, Remote Sensing and Spatial Information Sciences, Volume XLII-2/W13, 2019 ISPRS Geospatial Week 2019, 10–14 June 2019, Enschede, The Netherlands
correlated with urban landscape, i.e. higher values are concentrated in the more densely populated areas, where urban canyons are more frequent (Figure 5).
Figure 4. Mean distance between each single FCD and the nearest OTM network element (green = 0-7 m, yellow = 7-13 m,
red > 13 m) Parameter m Minimum 0.00 Maximum 471.70 Mean 6.80 St. Dev. 13.21
Table 1. Statistical parameters characterising the distribution of the distance between each single FCD position and the nearest
road network element
Figure 5. Mean HDOP value registered for each available FCD position and assigned to OTM road network elements (green = lower values and higher GPS signal quality, yellow = mean values and mean GPS signal quality, red = higher values and
lower GPS signal quality)
3.2 Comparison with data coming from traffic sensors FCD data have been compared with on-site measurements acquired by different sensors (aerial and induction loops) operated by the company 5T, a public company having as main stakeholders City, Province and Regional authorities and responsible of developing and providing mobility services in Torino. In the framework of the Traffic Operations Centre (TOC), 5T manages the traffic infrastructures installed on the territory of the Torino municipality. Among the different data acquired continuously and 24/7, fixed sensors measurements allow to derive traffic hourly flows, based on which hourly traffic profile can be derived. 5T traffic light control system is supported by approximately. 3400 different sensors in the whole Turin metropolitan area, the urban agglomeration centred on the city of Turin (Figure 1). Within the Turin municipality area, 5T freely provides access to vehicle flow data measured by 124 sensors3.
The total number of OTM road network elements where at least one FCD position has been acquired is 22259, out of a total of 30278, i.e. the 73% of the road network elements has at least one FCD position, a significant amount considering that the available sample covers only 17 hours. The number of OTM road network elements covered drops to 9867 (32%) if we consider only those with at least 10 FCD positions; and to 1632 (5%) if we consider only those with at least 50 FCD positions. Even in this worst case, the number of road network elements with a significant amount of data for generating traffic profiles is significantly higher than the coverage provided bt 5T. Evaluating the representativeness of the available FCD sample, in terms of total numbers it correspond to the 1.1% of the total vehicle transit measured by fixed sensors (Table 2): the number of vehicles estimated by the loops in the considered time frame is 431879, while the number of unique vehicles coming from FCD data is 4736. This is in line with the percentage of cars with an FCD sensor mounted in respect to the total car population, provided by the FCD data provider. The percentage of the FCD sample is higher on peak hours, suggesting an higher penetration of FCD sensors mounted on vehicles used for commuting: this may be explained by the higher impact of insurance facilitations, normally linked with FCD installation, on people using a vehicle on a daily basis.
Time interval N. of vehicles Loop sensor FCD % 17:00-18:00 93841 1033 1.1 18-00-19:00 96121 1353 1.4 19:00-20:00 85507 1067 1.2 20:00-21:00 59688 506 0.8 21:00-22:00 36584 319 0.9 22:00-23:00 32866 242 0.7 23:00-24:00 27272 216 0.8 17:00-24:00 431879 4736 1.1 3 http://www.5t.torino.it/wp-content/uploads/2018/03/scheda_fdt.pdf
The International Archives of the Photogrammetry, Remote Sensing and Spatial Information Sciences, Volume XLII-2/W13, 2019 ISPRS Geospatial Week 2019, 10–14 June 2019, Enschede, The Netherlands
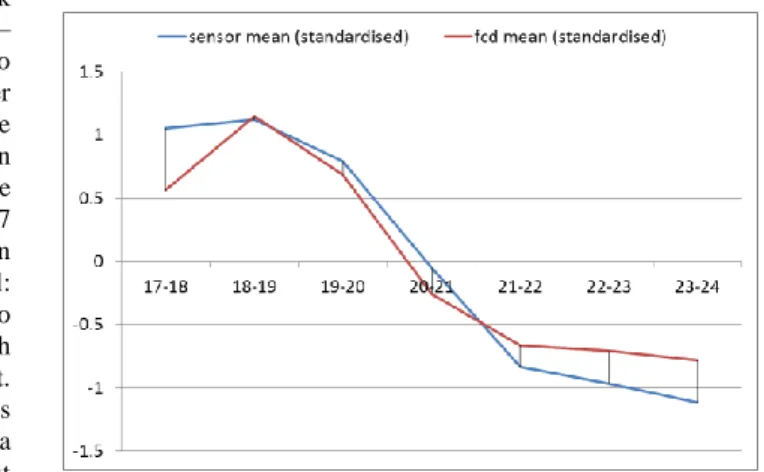
Table 2. Comparison, in terms of number of vehicles, between measures coming from loop sensors and FCD data Figure 6 displays the traffic profiles of the 124 road network elements equipped with fixed sensors in the period 17:00 – 24:00 of the 05/02/2019. From the FCD dataset it is possible to extract and count the number of unique vehicles passing over the same instrumented road network elements and in the same interval of time: this allows to create traffic profiles based on FCD data (Figure 7). Even if clearly affected by the difference in numerosity, the traffic profiles in Figure 6 and Figure 7 present similar trends. Figure 8 displays a comparison between mean standardised sensor and FCD data for each time interval: numbers related to transits has been standardised in order to take into account the difference in numerosity. From this graph a correlation between the two observations is evident. Comparing mean FCD transit values with total transits measured by means of traffic sensor and grouped in classes, a good overall correlation can be found: from this analysis it seems that an higher correlation between the two dataset can be obtained over road network elements with lower traffic volumes (Figure 9).
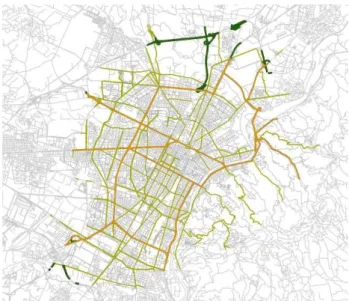
Figure 6. Traffic profiles derived from 5t fixed sensors
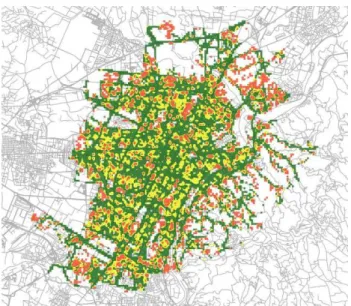
Figure 7. Traffic profiles derived from FCD
Figure 10 shows a comparison between transits measured with sensors and with FCD: an absolute difference of the number of passages at each sensor location has been calculated and displayed. From this elaboration seems to emerge a better correlation in the central part of the city.
One of the main outcomes of this comparison analysis is that, if considering FCD absolute values is critical, due to the limited representativeness of the sample and of the devices penetration
rate, analysis on relative and mean values can provide significant insights for analysing mobility patterns and develop mobility services.
Figure 8. Comparison between the mean of standardised values acquired by sensors (blue line) and by FCD devices (red line) Figure 10 shows a comparison between transits measured with sensors and with FCD: an absolute difference of the number of passages at each sensor location has been calculated and displayed. From this elaboration seems to emerge a better correlation in the central part of the city.
One of the main outcomes of this comparison analysis is that, if considering FCD absolute values is critical, due to the limited representativeness of the sample and of the devices penetration rate, analysis on relative and mean values can provide significant insights for analysing mobility patterns and develop mobility services.
Figure 9. Mean value of FCD data plotted against vehicle transit categories acquired by sensors.
The International Archives of the Photogrammetry, Remote Sensing and Spatial Information Sciences, Volume XLII-2/W13, 2019 ISPRS Geospatial Week 2019, 10–14 June 2019, Enschede, The Netherlands
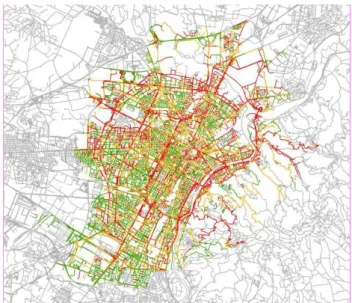
Figure 10. Comparison between sensor data and FCD (green = lower differences, red = higher differences)
4. TRAVEL BEHAVIOUR CHARACTERISTICS Once demonstrated that FCD has characteristics (information content and related accuracies) enabling their use in traffic analysis, the research activity focused on creating examples of travel behaviour characteristics analysis based on this type of data. Figure 11 displays a map of the Torino municipality where road network elements has been classified in function of the number of unique vehicles that travelled on each specific road element in the morning rush hour (from 07:30 to 09:30 CET) of the 06/02/2019.
FCD is in its nature trip based (Wang et al., 2010): extracting paths taken by the vehicles from such sparse data is an important step towards travel time estimation (Rahmani et al., 2013). Starting from FCD points, a procedure for identifying single travel paths has been developed. For each single vehicle, uniquely identified by the ID_DEVICE field, the procedure: selects and order in ascending mode, based on the
Timestamp field, all acquired positions;
loops on the positions and, every time 2 consecutive ones are further than a pre-defined distance (x meters) or differs from more than a pre-defined amount of time, set a new travel path;
all position attributed to a single ID_DEVICE and a single travel path are joined in sequence (based on the Timestamp filled) and mean values of speed, heading and HDOP, together with total length in meters, are calculated and associated to each single path.
The procedure, applied to the available sample, generates a total of 4854 paths transited by 2011 different vehicles.
Travel paths can be then associated to road network elements and different traffic related considerations can be made on the basis of travel path summarised data. Figure 12 displays the mean overall length (length divided by the number of travel paths) of travel paths per each single road network element. From this analysis, it is evident that traffic that travels along major roads (crossing the city NNE to SSW and WNW to ESE) normally travels longer distances: while traffic traveling local roads normally travels shorter distances.
Figure 11 Vehicle flow during morning rush hour estimated from FCD
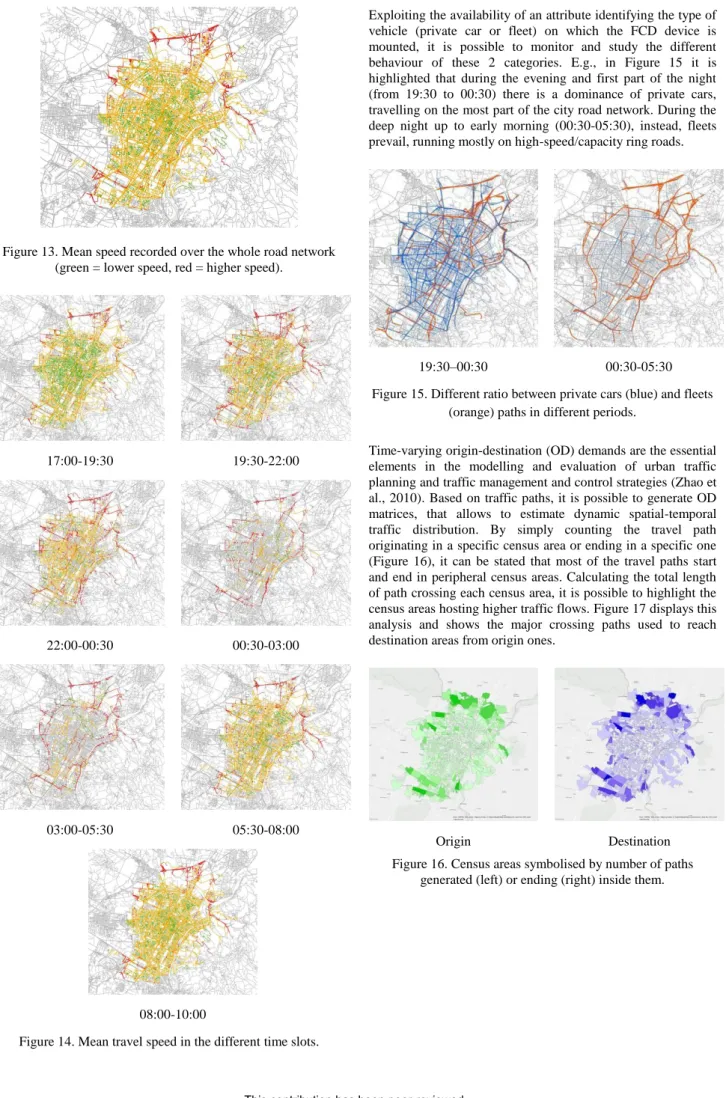
Figure 12. OTM road network classified based on normalised sum of path distances (green=shortest paths, red=longest paths) FCD based system is particularly able to detect jammed situations and the travel times calculated by the system deliver valuable data for mobility and traffic information systems (Brockfeld et al., 2007). Exploiting the recording by FCD of the speed value, it is possible to visualize the mean speed over the whole network: Figure 13 displays the mean speed value considering all records available in the FCD sample and clearly highlight main high speed roads and local roads. The use of the timestamp associated to FCD data allows to calculate mean speeds in the different moments of the day (Figure 14), useful for estimating dynamic travel times.
The International Archives of the Photogrammetry, Remote Sensing and Spatial Information Sciences, Volume XLII-2/W13, 2019 ISPRS Geospatial Week 2019, 10–14 June 2019, Enschede, The Netherlands
Figure 13. Mean speed recorded over the whole road network (green = lower speed, red = higher speed).
17:00-19:30 19:30-22:00
22:00-00:30 00:30-03:00
03:00-05:30 05:30-08:00
08:00-10:00
Figure 14. Mean travel speed in the different time slots.
Exploiting the availability of an attribute identifying the type of vehicle (private car or fleet) on which the FCD device is mounted, it is possible to monitor and study the different behaviour of these 2 categories. E.g., in Figure 15 it is highlighted that during the evening and first part of the night (from 19:30 to 00:30) there is a dominance of private cars, travelling on the most part of the city road network. During the deep night up to early morning (00:30-05:30), instead, fleets prevail, running mostly on high-speed/capacity ring roads.
19:30–00:30 00:30-05:30 Figure 15. Different ratio between private cars (blue) and fleets
(orange) paths in different periods.
Time-varying origin-destination (OD) demands are the essential elements in the modelling and evaluation of urban traffic planning and traffic management and control strategies (Zhao et al., 2010). Based on traffic paths, it is possible to generate OD matrices, that allows to estimate dynamic spatial-temporal traffic distribution. By simply counting the travel path originating in a specific census area or ending in a specific one (Figure 16), it can be stated that most of the travel paths start and end in peripheral census areas. Calculating the total length of path crossing each census area, it is possible to highlight the census areas hosting higher traffic flows. Figure 17 displays this analysis and shows the major crossing paths used to reach destination areas from origin ones.
Origin Destination
Figure 16. Census areas symbolised by number of paths generated (left) or ending (right) inside them. The International Archives of the Photogrammetry, Remote Sensing and Spatial Information Sciences, Volume XLII-2/W13, 2019
Figure 17. Census areas symbolised by total length of travel path crossing them (green colour = lower values, red colours =
higher values) 5. CONCLUSIONS
This article presents the possibility to setup mobility services based on FCD. The main drawback of this specific analysis is the representativeness of and FCD-based sample, considering the limited penetration of OBU mounted on vehicles (according to the data provider, around 2% in Italy). This limitation is particularly relevant in this specific case study, considering that the authors had access only to a very limited subset, covering only 17 consecutive hours (from 05/02/2019 17:00 CET to 06/02/2019 10:00 CET). Despite these intrinsic limitations, the statistical comparison with data coming from traffic sensors seems to show that, at least as relative figures, FCD can provide significant insights for analysing mobility patterns and develop mobility services. Furthermore, the results of traffic analysis seem very realistic and have the advantage of being more sensitive to specific events (e.g. incidents, mass events) than standard traffic models. An high spatial coverage (73% of the Turin road network elements has at least one FCD position) of the sample allowed to perform a comprehensive set of traffic analysis in support of mobility services, at a significant lower cost than one based on traffic sensors.
Further research activity foreseen by the pool of authors include a more accurate validation of FCD data using sensor data as reference set, once a more representative sample of FCD data will be available, and a validation of traffic analysis with similar products based on sensor and models.
ACKNOWLEDGEMENTS
This research has been performed in the framework of a Project of National Interest (PRIN) named URBAN-GEO BIG DATA (URBAN GEOmatics for Bulk Information Generation, Data Assessment and Technology Awareness) , funded by the Italian Ministry of Education, University and Research (MIUR) – id. 20159CNLW8.
The authors would thank VIASAT S.p.A. for providing the FCD sample used for the analysis.
REFERENCES
Altintasi, O., Tuydes-Yaman, H., Tuncay, K., 2017. Detection of urban traffic patterns from Floating Car Data (FCD). Transportation Research Procedia, Volume 22, Pages 382-391, ISSN 2352-1465, https://doi.org/10.1016/j.trpro.2017.03.057. Arco, E., Ajmar, A., Arneodo, F., Boccardo, P., 2017. An operational framework to integrate traffic message channel (TMC)in emergency mapping services (EMS), European Journal of Remote Sensing, 50:1, 478-495, DOI: 10.1080/22797254.2017.1361306
Brockfeld, E., Lorkowski, S., Mieth, P., Wagner, P., 2007. Benefits and limits of recent floating car data technology-an evaluation study. For presentation at the 11th WCTR Conference, Berkeley, USA, p. 24-28.
He, Z.C., She, X.W., Zhuang, L.J., Nie, P.L., 2013. On-line map-matching framework for floating car data with low sampling rate in urban road networks. Iet Intell Transp Sy, 7(4):404–14.
Hu, J., Cao, W., Luo, J., Yu, X., 2009. Dynamic modeling of urban population travel behavior based on data fusion of mobile phone positioning data and FCD. In 17th International Conference on Geoinformatics, Fairfax, VA, 2009, pp. 1-5. doi: 10.1109/GEOINFORMATICS.2009.5293222
Langley, R.B., 1999. Dilution of Precision. GPS World. http://gauss.gge.unb.ca/papers.pdf/gpsworld.may99.pdf. Retrieved 18/03/2019.
Pirotti, F., Ravanelli, R., Fissore, F., Masiero, A., 2018. Implementation and assessment of two density-based outlier detection methods over large spatial point clouds. Open Geospatial Data, Software and Standards. 3. 10.1186/s40965-018-0056-5.
Rahmani, M., Koutsopoulos, H.N., 2013. Path inference from sparse floating car data for urban networks. Transportation Research Part C: Emerging Technologies, Volume 30, Pages
41-54, ISSN 0968-090X,
https://doi.org/10.1016/j.trc.2013.02.002.
Ravanelli, R., Crespi, M., 2018. Analysis of the floating car data of Turin public transportation system: first results. ISPRS - International Archives of the Photogrammetry, Remote Sensing and Spatial Information Sciences. XLII-4. 515-521. 10.5194/isprs-archives-XLII-4-515-2018.
Schäfer, R.P., Thiessenhusen, K.U., Wagner, P., 2002. A Traffic Information System by Means of Real-Time Floating-Car Data. In: 9th World Congress on Intelligent Transport Systems.
Wang, T., Fang, T., Han, J., Wu, J., 2010. Traffic Monitoring Using Floating Car Data in Hefei. International Symposium on Intelligence Information Processing and Trusted Computing, Huanggang, pp. 122-124. doi: 10.1109/IPTC.2010.175
Zhao, H., Yu, L., Guo, J., Zhao, N:, Wen, H., Zhu, L., 2010. Estimation of Time-Varying OD Demands Incorporating FCD and RTMS Data. Journal of Transportation Systems Engineering and Information Technology, Volume 10, Issue 1, Pages 72-80, ISSN 1570-6672, https://doi.org/10.1016/S1570-6672(09)60024-6.
Revised March 2019
The International Archives of the Photogrammetry, Remote Sensing and Spatial Information Sciences, Volume XLII-2/W13, 2019 ISPRS Geospatial Week 2019, 10–14 June 2019, Enschede, The Netherlands