Contents list available at IJRED website
Int. Journal of Renewable Energy Development (IJRED)
Journal homepage: http://ejournal.undip.ac.id/index.php/ijred
A Novel Global MPP Tracking of Photovoltaic System based on Whale
Optimization Algorithm
C.H. Santhan Kumar
*and R. Srinivasa Rao
Department of Electrical and Electronics Engineering, JNT University Kakinada, Kakinada, Andhra Pradesh 533003, India
ABSTRACT. To harvest maximum amount of solar energy and to attain higher efficiency, photovoltaic generation (PVG) systems
are to be operated at their maximum power point (MPP) under both variable climatic and partial shaded condition (PSC). From literature most of conventional MPP tracking (MPPT) methods are able to guarantee MPP successfully under uniform shading condition but fails to get global MPP as they may trap at local MPP under PSC, which adversely deteriorates the efficiency of Photovoltaic Generation (PVG) system. In this paper, a novel MPPT based on Whale Optimization Algorithm (WOA) is proposed to analyze analytic modeling of PV system considering both series and shunt resistances for MPP tracking under PSC. The proposed algorithm is tested on 6S, 3S2P and 2S3P Photovoltaic array configurations for different shading patterns and results are presented. To compare the performance, GWO and PSO MPPT algorithms are also simulated and results are also presented. From the results, it is noticed that proposed MPPT method is superior to other MPPT methods with reference to accuracy and tracking speed.
Keywords: Maximum power point tracking, Partial shaded condition, Photovoltaic generation system, Single diode model, Whale optimization algorithm.
Article History: Received July 23rd 2016; Received in revised form September 15th 2016; Accepted October 1st 2016; Available online
How to Cite This Article: Kumar, C.H.S and Rao, R.S. (2016) A Novel Global MPP Tracking of Photovoltaic System based on Whale Optimization Algorithm. Int. Journal of Renewable Energy Development, 5(3), 225-232.
http://dx.doi.org/10.14710/ijred.5.3.225-232
*Corresponding Author: +919885554065; Fax : 08847772000
Email: [email protected]
1. Introduction
Due to dearth of fossil fuels and escalate load demand, renewable energy plays a crucial role in future power generation. Photovoltaic generation system is a popular renewable energy source which is inexhaustible and available in most regions of the world and proved to be a reasonably priced source of energy. To harvest maximum amount of solar energy, PVG systems are forced to operate at maximum power point (MPP) under both variable climatic and partial shaded condition (PSC) in conjunction with a power electronic converter. When PVG systems are subjected to uniform irradiation condition conventional MPPT controllers can efficiently track MPP (Kamarzaman et al. 2014, Reisi et al. 2013). But, when PVG system is subjected to PSC (due to passing clouds, tree branches, building
shadows, etc.), it’s current-voltage (I-V) and
power-voltage (P-V) characteristics exhibits many local maximum power points (LMPP) and only one global maximum power point (GMPP) due to bypass diode operation across the shaded modules (Silvestre et al.
2009). Many of the conventional MPPT algorithms cannot differentiate between LMPP and GMPP and thus they trap at one of the LMPP which adversely deteriorates the efficiency of PVG systems (Ishaque et al. 2013).
Several researchers proposed various soft computing based MPPT algorithms (Salam et al. 2013). Out of which meta-heuristic optimization algorithm based MPPT techniques like Particle Swarm Optimization (PSO) (Ishaque et al. 2012 – Liu et al.
2012), Artificial Bee Colony (ABC) (Benyoucef et al.
2015, Sundareswaran et al. 2015), Ant Colony Optimization (ACO) (Jiang et al. 2013), Differential Evolution (DE) (Tajuddin et al. 2013), Cuckoo Search
(CS) (Ahmed et al. 2014), Genetic Algorithms (GA) (Daraban et al. 2014), Flashing Firefly (FF) (Sundareswaran et al. 2014) and Grey Wolf Optimizer (GWO) (Satyajit et al. 2016) have growing interest due to their adaptability for system hardware implementation. These MPPT techniques alter noticeably in terms of accuracy, efficiency, tracking speed, cost, complexity and flexibility (Liu et al. 2015,
Ahmed et al. 2015). Decision variables like voltage, duty ratio and current are taken as population of particles (candidate solutions) to find the maximized solution of power subjected to PSC, where PV output power is taken as objective function to be maximized.
Among these techniques, most of the authors extensively used PSO method for GMPP tracking under PSC. But it has some drawbacks like larger settling time, power oscillations, local maximum trapping and larger regions of exploration. Therefore, it is vital to develop a new and ameliorate MPPT algorithm for faster convergence to GMPP of PVG system under PSC. Recently, Whale optimization algorithm (WOA) was developed by (Mirjalili et al. 2016). WOA is inspired from a special hunting behavior of humpback whales and it can be successfully applied for non-linear optimization problems. In this paper, WOA is applied for MPP tracking of PVG systems subjected to PSC.
The rest of the paper is organized as follows: Modeling of PVG system under PSC is discussed in section 2. Section 3 briefly introduces WOA and its application for MPPT problem followed by results and comparison between WOA, GWO and PSO MPPT algorithms in Section 4, followed by conclusion in Section 5.
2. Modeling of PV system under PSC 2.1 PV module
Several mathematical models of photovoltaic (PV) cell are proposed by researchers, out of which single diode model (SDM) is more predominantly used for PV cell modeling due to its simplicity and computational efficiency (Ma et al. 2014). The single diode model of PV module is presented in Fig. 1.
Fig. 1 Single diode model of module
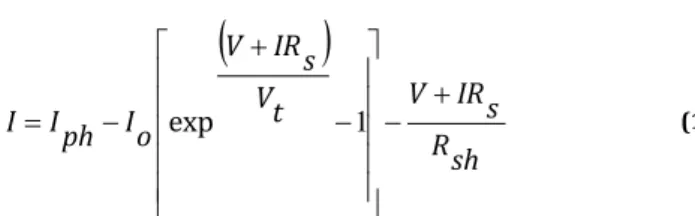
The PV output current for the circuit shown in Fig. 1 is defined as
sh R s IR V t V s IR V o I ph I I exp 1 (1)where I is PV output current, Iph is the Photo current
of module, Io is the Diode saturation current, V is PV
output voltage, Rs and Rsh are the series and shunt
resistances. q KTA s N t V (2) G T i k stc sc I ph I _ (3) where Vt is the thermal voltage of PV module, Ns is
Number of cells in series in a module, q is the Charge of an electron (1.6 × 10⁻¹⁹ C), A is the Diode ideality factor,
Kis the Boltzmann’s constant (1.38 × 10⁻²³ N-m/K), T is the Panel operating temperature (in Kelvin), Isc_stc is the
short circuit current at standard test conditions (STC),
ki is the current temperature coefficient, ∆T is the
temperature change (∆T=T-Tstc) in Kelvin and G is the
solar irradiation in kW/m2. T stc T AK g qE T stc T stc o I o I exp 1 1 3 _ (4) 1 exp _ stc AKT s N oc qV sc I stc o I (5)
where Egis the bandgap energy (eV), Voc is the open
circuit voltage and Isc is the short circuit current of PV
module.
Equation (1) in terms of voltage function can be represented as:
, exp( ) 1 I(Rs Rsh) t V IRs V sh R o I sh R ph I V I V f (6) Equation (6) is non-linear with two variables V, I canbe solved by Newton’s iterative method. The PV module parameters used for modeling the PV system are given in Table 1.
Tabel 1
Parameters of Kyocera KC-200GT module
Maximum power (Pmp) 200 W
Open circuit voltage (Voc) 32.9 V Short circuit current (Isc) 8.21 A
Maximum power Voltage (Vmp) 26.3 V
Maximum power current (Imp) 7.61 A
Voltage temperature coefficient (kv) -1.23 x 10⁻¹ V/ºC
Current temperature coefficient (ki) 3.18 x 10⁻³ A/ºC I Rs
+
Id Iph V-+
Rsh-
2.2 PSC Modeling
In this work a system with 6S (Six series), 3S2P (Three series two parallel) and 2S3P (Two series three parallel) PV configurations as shown in Fig. 2 are modeled using the following equations:
(a) (b)
(c)
Fig. 2 (a) 6S PV configuration (b) 3S2P PV configuration
Output voltage of nth module with both series and shunt resistance is obtained by comparing photo current of nth module with corresponding string current
Isk as follows: 0 ), ( 1 ) ( k s I kn I k s I kn I p R s R k s I t V s IR kn V e sh R o I sh R kn ph I V kn V (7)
where Vkn is voltage across the nth module of kth string by varying the current in the string, Isfrom zero
to photocurrent of the module with greater irradiation. The output voltage of kth string is obtained by
m n kn V k s V 1 (8) where m is the number of modules in a string, PV Output current of the array is given by
s k k s I I 1 (9)where s is number of parallel connected strings in an array. For detailed explanation refer (Alajmi et al.
2013).
3. WOA and its application for MPPT
3.1 Overview of WOA
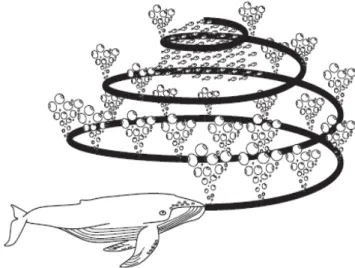
Whale optimization algorithm is inspired from bubble net hunting strategy of humpback whales proposed by (Mirjalili et al. 2016). Humpback whale is the biggest of all whales and it has special hunting mechanism of spiral bubble-net feeding. These whales hunt the school of fishes or krill's on the surface by creating distinctive bubbles in circular path as depicted in Fig. 3.
Fig. 3 Bubble-net feed hunting behavior of humpback whales
Humpback whales encircles the prey during hunt and encircling behavior can be mathematically modeled as
.X* k X k C D (10) D A k X k X( 1) *( ) . (11) where D, A and C are the coefficient vectors, k is the current iteration, X*is the best solution and it updatesfor each iteration if better solution obtained, X is the position vector of the whales. The A and C vectors can be calculated as a r a A2. (12) r C . 2 (13) where a linearly decreases from 2 to 0 over course of iterations and r is the random vector between [0,1]. Here we refer X*as the best solution with knowledge
about the prey location.
G1 G2 G3 + V G6 G4 G5 I - I G1 G2 G6 G4 G5 G3 +
-V I Is1 Is2 G1 G2 G3 G4 + -V Is1 Is2 G5 G6 Is33.2 Application of WOA for MPPT
Here MPPT is formulated as objective function and it is represented as follows:
Maximize P(d) (14) Subjected to
d
min
d
d
max (15) where P is PV output power, d is duty ratio, dmin isthe minimum and dmax is the maximum limits of duty
ratio i.e., 0.1 and 0.9, respectively. The block diagram for MPPT of PV system is depicted in Fig. 4.
Fig. 4Block diagram for MPPT of PV system
In this work WOA is implemented as a direct control MPPT technique i.e., duty cycle control by taking population of whales as duty ratios to reduce steady state oscillations. Direct control MPPT decreases power loss and therefore improves efficiency of the system. For each population of whales, i.e., duty ratios, the corresponding voltage and currents are sensed by the controller and compute output power.
For MPPT, (11) can be remodeled as
D A k d k di( 1) i( ) . (16)
The objective function of WOA MPPT is formulated as
) ( ) ( ik1 k i P d d P (17) where i is the population of whales
PV power is dependent on climatic conditions, for a change in solar irradiation of PV modules, the power output of PV array changes correspondingly and proposed MPPT algorithm is reinitialized by sensing the change in PV output power using (18).
1 . 0 1 k k k P P P (18)
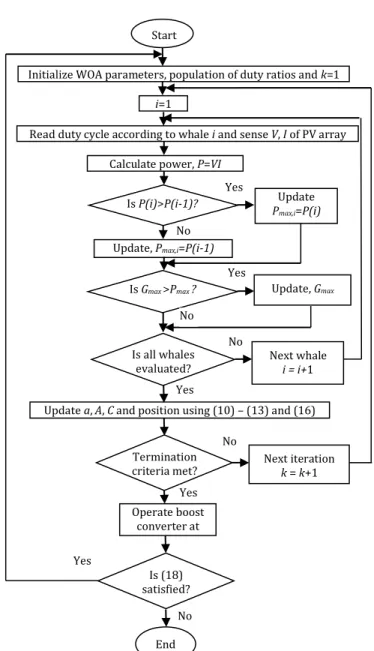
The detailed methodology of proposed WOA MPPT algorithm is presented in Fig. 5.
4. Results and discussions
To examine the performance of proposed WOA MPPT algorithm, it is implemented for different combinations of PV configurations of six PV modules.
The shading patterns (W/m2) of 6S PV configuration are as follows:
1) G1, G2=1000, G3,G4=600, G5,G6=200
2) G1=1000, G2=800, G3=600, G4=400, G5=200, G6=100 The shading patterns of 3S2P PV configuration are as follows:
3) G1=1000, G2=500, G3=200, G4=1000, G5=600, G6=200
4) G1=1000, G2=400, G3=200, G4=1000, G5=500, G6=300
Fig. 5 Flow chart for WOA MPPT Algorithm
MPPT Boost converter Gate Drive RL=100 Ω V I Dopt PV array Start
Initialize WOA parameters, population of duty ratios and k=1
i=1
Read duty cycle according to whale i and sense V, I of PV array Calculate power, P=VI
Is P(i)>P(i-1)?
Is Gmax >Pmax ?
Update, Pmax,i=P(i-1)
Update Pmax,i=P(i) Update, Gmax Is all whales evaluated? Termination criteria met? Next whale i = i+1 Next iteration k = k+1 End
Update a, A, C and position using (10) – (13) and (16) Yes No Yes No Yes No Yes No Operate boost converter at doptimal Is (18) satisfied? Yes No
The shading patterns of 2S3P PV configuration are as follows: 5) G1=1000, G2=600, G3=1000, G4=600, G5=1000, G6=600 6) G1=1000, G2=300, G3=1000, G4=200, G5=1000, G6=100 4.1 PV configuration 6S
The P-V characteristics of 6S PV configuration for shading patterns 1 and 2 are shown in Fig. 6. These characteristics exhibit multiple maxima due to bypass diode operation across shaded modules, out of which only one is GMPP. In order to attain maximum benefit, the PV system should be operated at GMPP. This can be achieved by using the proposed MPPT technique.
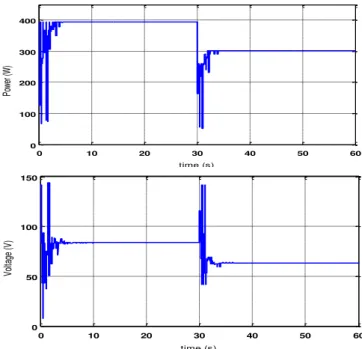
The dynamic performance of the proposed algorithm is observed by operating the PV system at different shading patterns. The 6S PV configuration is subjected to pattern 1 from 0 to 30s and pattern 2 from 30s onwards. The algorithm reinitializes the search for change in shading pattern by sensing the change in the PV power. The tracking curves of proposed WOA MPPT algorithm for shading patterns 1and 2 of 6S PV configuration are presented in Fig. 7.
From Fig. 7, it is clear that MPP tracking subjected to shading pattern 1 and 2 can be achieved by proposed MPPT algorithm. The maximum power extracted by proposed algorithm for pattern 1 is 394.52 W and the time for tracking the MPP is 5.4 s and at t=30 s algorithm reinitializes the search due to change in PV power, for pattern 2 the maximum power is 301.9 W and the time of tracking the MPP is 5.5 s. For comparative analysis, the proposed algorithm is compared with most recent GWO MPPT algorithm (Satyajit et al. 2016), and most implemented PSO MPPT algorithm (Ishaque et al. 2012) under similar conditions. The parameters of the three algorithms are given in Appendix. For fairness of comparison same number of population i is considered for all the algorithms. 0 50 100 150 0 100 200 300 400 Voltage (V) P ow er ( W ) P-V Characteristics of 6S PV Configuration Patte rn 1 Patte rn 2
Fig. 6P-V Characteristics of 6S PV configuration
0 10 20 30 40 50 60 0 100 200 300 400 time (s) Po we r ( W ) 0 10 20 30 40 50 60 0 50 100 150 time (s) Vo lta ge (V )
Fig. 7 Tracking Curves of Power and Voltage of 6S PV Configuration
4.2 PV configuration 3S2P
The P-V characteristics of 3S2P PV configuration for shading patterns 3 and 4 are shown in Fig. 8.
0 10 20 30 40 50 60 70 80 0 100 200 300 400 Voltage (V) P ow er ( W ) P-V Characteristics of 3S2P PV configuration Patte rn 3 Patte rn 4
Fig. 8P-V Characteristics of 3S2P PV configuration
The 3S2P PV configuration is subjected to pattern 3 from 0 to 30s and pattern 4 from 30s onwards. The proposed algorithm tracks the global MPP for both shading patterns. The tracking curves of proposed MPPT algorithm for shading patterns 3 and 4 of 3S2P PV configuration are presented in Fig. 9.
From Fig. 9 it is clear that MPP tracking subjected to shading pattern 3 and 4 can be achieved by proposed MPPT algorithm. The maximum power extracted by proposed algorithm for pattern 3 is 363.09 W and the time of tracking the MPP is 4.9 s and for pattern 4 is 301.05 W and the time of tracking the MPP is 4.6 s.
0 10 20 30 40 50 60 0 100 200 300 400 time (s) Po we r ( W ) 0 10 20 30 40 50 60 10 20 30 40 50 60 70 80 time (s) Vo lta ge (V )
Fig. 9 Tracking Curves of Power and Voltage of 3S2P PV Configuration
4.3 PV configuration 2S3P
The P-V characteristics of 2S3P PV configuration for shading patterns 5 and 6 exhibits two maxima, out of which only one is GMPP are shown in Fig. 10.
The 2S3P PV configuration is subjected to pattern 5 from 0 to 30s and pattern 6 from 30s. The tracking curves of proposed MPPT algorithm for shading patterns 5 and 6 of 2S3P PV configuration are presented in Fig. 11.
From Fig. 11 it is clear that MPP tracking subjected to shading pattern 5 and 6 can be achieved by proposed MPPT algorithm. The maximum power extracted by proposed algorithm for pattern 5 is 592.08 W and the time of tracking the MPP is 6.6 s and for pattern 6 is 451.57 W and the time of tracking the MPP is 6.2 s. 0 10 20 30 40 50 0 100 200 300 400 500 600 700 Voltage (V) P o w e r (W ) P-V Characteristics of 2S3P PV Configuration Patte rn 5 Patte rn 6
Fig. 10P-V Characteristics of 2S3P PV configuration
0 10 20 30 40 50 60 0 100 200 300 400 500 600 700 time (s) Po we r ( W ) 0 10 20 30 40 50 60 0 10 20 30 40 50 time (s) Vo lta ge (V )
Fig. 11 Tracking Curves of Power and Voltage of 3S2P PV Configuration
4.4 Performance comparison
To compare the performance of proposed WOA MPPT, GWO and PSO MPPT algorithms in terms of tracking speed and tracking efficiency subjected to all shading patterns of 6S, 3S2P and 2S3P PV configurations, results are presented in Table 2. For any MPPT algorithm both tracking efficiency and tracking time are very important to attain highest benefit from the PV system. Tracking efficiency is the ratio between maximum power tracked by algorithm to maximum power of the PV configuration (Liu et al. 2012). From Table 2, it is observed that proposed algorithm has superior tracking efficiency and tracking speed than GWO and PSO MPPT algorithms.
The performance comparison between three algorithms in terms of global maximum power extraction and tracking speeds are shown in Fig. 12 and Fig. 13. 1 2 3 4 5 6 0 100 200 300 400 500 600 Patterns P ow er ( W )
PSO GWO WOA
1 2 3 4 5 6 0 5 10 15 Patterns Ti m e( s)
WOA GWO PSO
Due to stochastic nature of the optimization algorithms, 50 trail runs were performed with the proposed and other algorithms and the statistical results are given in Table 3. From Table 3 it is noticed that the proposed algorithm has very low standard deviation compared to GWO and PSO MPPT algorithms, where as PSO MPPT suffers from LMPP trapping and leads to wastage of viable PV power.
Fig.13 Tracking speeds of MPPT methods
Table 1
Performance Comparison of WOA, GWO and PSO MPPT Methods
Table 2
Statistical Comparison of WOA, GWO and PSO MPPT Methods
PV configuration Shading pattern Tracking method PV power (W) PV voltage (V) PV current (A) Duty ratio (doptimum) Tracking time (s) Maximum power from P-V curve (W) Tracking efficiency (%) 6S 1 WOA 394.52 83.58 4.72 0.5792 5.4 394.52 99.99 GWO 394.52 84.07 4.69 0.5788 9.1 99.99 PSO 394.52 84.64 4.66 0.5793 12 99.99 2 WOA 301.9 63.31 4.76 0.6357 5.5 301.99 99.97 GWO 301.9 63.31 4.76 0.6357 8.4 99.97 PSO 300.8 68.09 4.41 0.6356 9.6 99.60 3S2P 3 WOA 363.09 42.22 8.59 0.7789 4.9 363.27 99.95 GWO 363.01 42.22 8.59 0.7801 7.8 99.92 PSO 363.05 44.26 8.20 0.7801 9.6 99.93 4 WOA 301.05 19.78 15.21 0.7759 4.6 301.05 99.99 GWO 300.95 21.30 14.12 0.8859 7.2 99.93 PSO 299.41 24.52 12.21 0.7559 10.8 99.45 2S3P 5 WOA 592.08 41.83 14.15 0.8281 6.6 592.31 99.96 GWO 591.19 41.66 14.19 0.8280 10.2 99.81 PSO 591.90 41.36 14.31 0.8281 14.5 99.93 6 WOA 451.57 19.78 22.82 0.9069 6.2 451.57 99.99 GWO 438.69 20.95 20.93 0.9001 9.6 97.14 PSO 438.69 20.95 20.93 0.8999 13.8 97.14 PV configuration Shading pattern Tracking method Mean best values (W) Standard deviation (W) Maximum power value (W) Minimu m power value (W) Average tracking time(s) 6S 1 WOA 394.5273 0.0000 394.5273 394.5273 5.4 GWO 394.5273 0.0000 394.5273 394.5273 9.1 PSO 394.5262 0.0045 394.5273 394.5087 12 2 WOA 301.9921 0.0000 301.9921 301.9921 5.5 GWO 301.9920 0.0000 301.9921 301.9854 8.4 PSO 301.9919 0.0013 301.9921 301.9854 9.6 3S2P 3 WOA 363.2528 0.0372 363.2730 363.1380 4.9 GWO 363.1832 0.0894 363.2730 362.8944 7.8 PSO 350.7179 42.8 363.2730 207.0327 9.6 4 WOA 300.9113 0.4523 301.0516 299.3440 4.6 GWO 300.9214 0.2451 301.0516 299.3004 7.2 PSO 293.8197 15.3695 301.0516 256.1528 10.8 2S3P 5 WOA 592.3051 0.0362 592.3128 592.0590 6.6 GWO 592.2184 0.1492 592.3128 299.3004 10.2 PSO 592.2854 0.0617 592.3128 256.1528 14.5 6 WOA 438.7851 0.1050 438.9024 438.6930 6.2 GWO 438.7349 0.0846 438.9024 438.6930 9.6 PSO 352.4406 116.2678 438.9024 198.9040 13.8
5. Conclusion
In this paper a novel WOA MPPT algorithm is proposed to track GMPP of PV system subjected to Partial shading condition. The P-V characteristics of 6S, 3S2P and 2S3P configurations considering both series and shunt resistances under different partial shading conditions are presented. These characteristics exhibit multiple MPPs of which one is the GMPP and all other are LMPP. It is observed that the characteristics are highly non-linear and it is complex to track GMPP under Partial shaded condition. The proposed WOA algorithm is used to track the GMPP for above configurations and it is effective in tracking the GMPP with high accuracy and less tracking time under dynamic partial shading conditions. From results, it is seen that proposed method is superior in terms of accuracy and tracking time compared to GWO and PSO MPPT algorithms. Since the algorithms WOA, GWO and PSO are stochastic in nature, the simulations are carried for 50 trials and statistical results are presented. It is observed that the Standard Deviation (SD) of the proposed is less compared to other methods which show that the WOA is able track the GMPP effectively. But SD of PSO is very high because maximum value is trapped at local value. From results and statistical analysis, it is seen that proposed WOA MPPT algorithm proved its supremacy over GWO and PSO MPPTs.
Appendix
Parameters of PSO, GWO and WOA MPPT Algorithms
Parameter PSO GWO WOA
Initial population (duty ratio) Randomly between 0.1 and 0.9 Randomly between 0.1 and 0.9 Randomly between 0.1 and 0.9 Np 6 6 6 C1,max 2 - - C2,max 2 - - C1,min 1 - - C2,min 1 - - Wmax 1 - - Wmin 0.1 - - Maximum number of iterations, kmax 100 100 100 Termination criteria
kmax kmax kmax
References
Ahmed, J. & Salam, Z. (2014) A maximum power point tracking (MPPT) for PV system using Cuckoo search with Partial shading capability. Appl Energy, 119, 118-130.
Ahmed, J. & Salam, Z. (2015) A critical evaluation on maximum power point tracking methods for partial shading in PV systems,
Renewable & Sustainable Energy Rev, 47, 933-953.
Bader, N.A., Khaled. H.A., Stephen, J.F. & Barry. W.W. (2013) A Maximum power point tracking technique for partially shaded
photovoltaic systems in microgrids, IEEE Trans.Ind.Electro,
60(4), 1596-1606.
Benyoucef, A.S., Chouder, A., Kara, K., Silvestre, S. & Sahed, O.A. (2015) Artificial bee colony based algorithm for maximum power point tracking (MPPT) for PV systems operating under partial shaded conditions. Applied Soft Computing, 32, 38-48.
Daraban, S., Petreus, D. & Morel, C. (2014) A novel MPPT algorithm based on a modified genetic algorithm specialized on tracking the global maximum power point in photovoltaic systems affected by partial shading. Energy, 74, 374-388.
Ishaque, K. & Salam, Z. (2013) A review of maximum power point tracking techniques of PV system for uniform isolation and partial shading condition. Renewable & Sustainable Energy Rev, 19, 475-488.
Ishaque, K., Salam, Z., Amjad, M. & Mekhilef, S. (2012) An improved particle swarm optimization (PSO)-based MPPT for PV with reduced steady state oscillations. IEEE Trans Power Electron, 27(8), 3627-3637.
Ishaque, K., Salam, Z., Shamsudin, A. & Amjad, M. (2012) A direct control based maximum power point tracking method for photovoltaic system under partial shading conditions using particle swarm optimization algorithm. Applied Energy, 99, 414-422.
Jiang, L.L., Maskell, D.L. & Patra, J.C. (2013) A novel ant colony optimization based maximum power point tracking for photovoltaic systems under partially shaded condition. Energy & Buildings, 58, 227-236.
Kamarzaman, N.A. & Tan, C.W. (2014) A comprehensive review of maximum power point tracking algorithms for photovoltaic systems. Renewable & Sustainable Energy Rev, 32, 585-598. Liu, Y.H., Chen, J.H. & Huang, J.W. (2015) A review of maximum power
point tracking techniques for use in partially shaded condition.
Renewable & Sustainable Energy Rev, 41, 436-453.
Liu, Y.H., Huang, S.C., Huang, J.W. & Liang, W.C. (2012), “A particle
swarm optimization based maximum power point tracking algorithm for PV systems operating under partially shaded conditions. IEEE Trans Energy Conv, 27(4), 1027-1035.
Mirjalili, S. & Lewis, A. (2016) The whale optimization algorithm,
Advances in Engg Software, 95, 51-67.
Reisi, A.R., Moradi, M.H. & Jamasb, S. (2013) Classification and comparison of maximum power point tracking techniques for photovoltaic system: A review. Renewable & Sustainable Energy Rev, 19, 433-443, 2013.
Satyajit, Mohanty., Bidyadhar, Subudhi. & Pravat, Kumar.Ray. (2016) A new MPPT design using grey wolf optimizer technique for photovoltaic system under partial shading conditions. IEEE Trans on sustainable energy, 7(1), 181-188.
Silvestre, S., Boronat, A. & Chouder, A. (2009) Study of bypass diodes configuration on PV modules. Applied Energy, 86, 1632-1640. Sundareswaran, K., Sankar, P. & Sankaran, P. (2014) MPPT of PV
systems under partial shaded Conditions through a colony of flashing fireflies. IEEE Trans Ener Conv, 29(2), 463-472.
Sundareswaran, K., Sankar, P., Nayak, P.S.R., Simon, S.P. & Palani, S.(2015) Enhanced energy output from a PV system under partial shaded conditions through Artificial bee colony. IEEE Trans Sustainable Ener, 6(1), 198-209.
T, Ma., H, Yang. & L, Lu. (2014) Solar photovoltaic system modeling and performance prediction, Renewable & Sustainable Energy Rev, 36, 304-315.
Tajuddin, M.F.N., Ayob, S.M, Sala, Z. & Saad, M.S. (2013) Evolutionary based maximum power point tracking technique using differential evolution algorithm. Energy & Buildings, 67, 245-252. Zainal, Salam., Jubaer, Ahmed. & Beny, S.Merugu. (2013) The application of soft computing methods for MPPT of PV system: A technological and status review. Applied Energy, 107, 135-148.