Persistent link:
http://hdl.handle.net/2345/bc-ir:104374
This work is posted on
eScholarship@BC
,
Boston College University Libraries.
Boston College Electronic Thesis or Dissertation, 2015
Copyright is held by the author, with all rights reserved, unless otherwise noted.
Essays on Health and Labor Economics
Boston College
The Graduate School of Arts and Sciences Department of Economics
ESSAYS ON HEALTH AND LABOR ECONOMICS
a thesis
by
JUNGHYUN KWON
submitted in partial fulfillment of the requirements for the degree of
Doctor of Philosophy
c
○ Copyright by JUNGHYUN KWON
Essays on Health and Labor Economics
by
Junghyun Kwon
Advisor : Andrew Beauchamp
Abstract
This dissertation considers changes of health insurance system of United States that affect health outcomes and labor market outcomes of population. The first chapter examines how Medicaid policy aimed to improve health status of low-income parents affects the health outcomes of young children. Estimates from variations in Medicaid rules across states and over time, show that there exist positive spillover effects on children from Medicaid expansions targeting parents. The child mortality declines more in states with higher level of generosity in Medicaid policy and the effect is larger among black children. Simulations indicate that recent Medicaid expansion under Affordable Care Act Reform can deepen the existing child mortality disparity across states due to different adoption of Medicaid expansion for low income adult population. The second chapter examines Massachusetts health care reform and its impact on labor market outcomes of older males approaching retirement. I find that older males are more likely to remain in full-time employed status rather to choose early retirement, and part-time employment increased only among low-income population who are eligible for subsidized health insurance. The results suggests that there exists employment-lock effect from increase of employers providing employer-sponsored health insurances following the reform.
Contents
1 Do Children Benefit from Their Parents’ Medicaid Coverage? 1
I. Introduction . . . 2
II. Background . . . 6
A Background on Medicaid . . . 6
B Data . . . 7
III. Mortality Analysis . . . 10
A Empirical Analysis . . . 10
B Results . . . 11
IV. Health Care Utilization Analysis . . . 17
A Empirical Strategy . . . 18
B Utilization Patterns . . . 21
V. Conclusion . . . 23
2 Health Care Reform and Labor Supply of Older Workers; Employ-ment lock and RetireEmploy-ment 45 I. Introduction . . . 45
II. Massachusetts Health Care Reform . . . 48
III. Data and Empirical Strategy . . . 51
A Data . . . 51
IV. Results . . . 55
List of Figures
1-1 Growth in Medicaid Eligibility, 1990-2004 . . . 29
1-2 Child Mortality by Races and States, 1990-2004 . . . 30
1-3 Black-White Mortality Disparity . . . 31
1-4 Simulated Child Mortality Change . . . 32
List of Tables
1.1 Medicaid eligibility income threshold for working parents . . 34
1.2 MEPS Descriptive Statistics . . . 35
1.3 Regression on children’s health care utilization . . . 36
1.4 textbfRegression on Children’s Health Care Access . . . 37
1.5 Regression of Mortality Rate on Simulated Medicaid Gen-erosity Indices . . . 38
1.6 Probit Regression on Medicaid Take-up . . . 39
1.7 Black-White Mortality Disparity . . . 40
1.8 Mortality by Cause-of-Death . . . 41
1.9 Children Mortality caused by Motor Vehicle Accidents . . . 42
1.10 Medicaid Income Eligibility for Adults in January 2014 . . . 43
1 Summary statistics . . . 69
2 The Effect of the MA Health Care Reform on Health Insurance Coverage 70 3 The effect of Massachusetts health care reform on labor supply status trasition in a year . . . 71
4 Difference-in-difference effects by groups . . . 72
5 Triple-difference estimates by groups . . . 73
Chapter 1
Do Children Benefit from Their
Parents’ Medicaid Coverage?
Abstract
Does parental Medicaid coverage matter for children who are already covered by Medicaid? This pa-per examines the spillover effect from low-income parents’ Medicaid coverage to their children using cross-state variation in Medicaid eligibility between 1990 and 2004. I construct the index of Medicaid eligibility for parents measured by the fraction of eligible parent population based on the detailed Medicaid policy of each state. Using plausibly exogenous variation in constructed index, I provide new evidence that Medicaid expansion targeting low-income parents leads to a significant decline in the mortality rates of infants and children ages 1-4. The effect is larger and more significant among the black population than among the white population, and saves 3.1 black children’s lives during 15 years of analysis. The differential effect across races leads to a decline in the black-white mortality gap. I explain the difference in effectiveness of parental coverage as a result from the difference in the take-up of Medicaid. The Medicaid-eligible children with Medicaid-eligible parents are two times more likely to enroll, and eligible black children whose parents are also eligible are seven times more likely to enroll. Simulation results using the features of Medicaid expansion in the Affordable Care Act suggest that the different adoption of Medicaid expansion may enlarge existing mortality disparities across states. The spillover effect on children’s health from the Medicaid expansion for parents suggests that the benefit of the policy would reach beyond the direct benefi09ciaries and the evaluation of policy should take the additional benefit into consideration.
JEL Codes : I13, I14, I18, J10, J18
I. Introduction
Does providing parents Medicaid coverage benefit children? Numerous studies exist on the relationship between children’s health insurance status and their health care utilization and health outcomes. Covering children has improved children’s ac-cess to care and furthered their health outcomes (Currie and Gruber 1996a; Dafny and Gruber 2005; Howell et al. 2011). However, even among insurance-covered chil-dren, there exists a disparity in health outcomes by socioeconomic status (Currie and Thomas 1995; Case 2000). Thus, the role of parents in determining children’s health outcomes draws the attention of researchers. Increased awareness of the importance of family-coverage has led researchers to examine the relationship between parental coverage and children’s coverage and health care access. More children are enrolled in Medicaid in states with expanded Medicaid for parents (Lambrew 2001; Dubay and Kenny 2004; Wolfe et al. 2006; Aizer and Grogger 2003; Sommers 2006). Children with insured parents have better access to health care than children with uninsured parents (Gifford et al. 2005; Guendelman 2006). However, the literature has not provided a clear answer on the relationship between children’s health outcomes and parental coverage.
Having uninsured members within the family can have adverse consequences for the whole family: parents’ poor health status affects children’s health and well-being negatively, and reduced labor supply and large medical bills can cause financial
inse-curities for families (Institute of Medicine, 2002).1 Since parents play the main role
in children’s health investments, the health insurance status of parents could have far-reaching effects on children.
The current Affordable Care Act (ACA) health reform is expected to make sig-nificant changes in coverage for low-income parents by expanding Medicaid for
non-1For example, Gross and Notowidigdo (2011) show that an increase in Medicaid eligibility reduces
elderly, non-disabled adults.2 The reform is expected to improve the coverage
dis-parity affecting low-income families.3 This paper examines the possible benefits for
children from expanding Medicaid coverage to parents. Moreover, it addresses the deficiency in the existing literature by examining the relationship between parental coverage and children’s health outcomes.
Child health has been a top priority goal of Medicaid since its enactment in 1965. Towards the initial goal of improvement in child health, Medicaid for children con-tinued to expand during the 1980s and 1990s. Currently almost 90% of low-income children are eligible for Medicaid and half of low-income children are covered by Med-icaid (Kaiser Family Foundation, 2012). Many studies evaluate the effects of these Medicaid expansions on child health outcomes. Currie and Gruber (1996a,b) esti-mate the health effects from the expansions of Medicaid eligibility during the 1980s
and early 1990s.4 Meyer and Wherry (2012) examine the Medicaid coverage during
childhood and possible health effects in teens. Goodman-Bacon (2013) examine the effect of Medicaid introduction on non-white child mortality. However the coverage for low-income parents has been neglected and low-income working parents have
re-mained the most vulnerable population in terms of health insurance coverage.5 The
awareness of the importance of covering both of the parent and the child has increased and welfare reform in the 1990s increased the Medicaid eligible parent population by
2The ACA expands Medicaid eligibility to non-elderly adults up to 138 % of the Federal Poverty
Line (FPL). Among 50 states and the District of Columbia, 24 states declined to expand Medicaid following the Supreme Court Decision in 2012. The median eligibility income threshold for parents rose from 106% in 2013 to 138% among states that expanded Medicaid. Among states that did not adopt ACA Medicaid expansion, the median income threshold for Medicaid eligibility remains at 46% of the federal poverty line.
3The Health Reform Monitoring Survey (HRMS) conducted by the Urban Institute showed that
the uninsured rate of parents decreased by 14.4% nationwide. States that expanded Medicaid expe-rienced a 33.3% decrease in the uninsured rate for parents between September 2013 and June 2014 (Urban Institute, 2014).
4Currie and Gruber(1996a) examine Medicaid expansion for children and child mortality
improve-ment. Currie and Gruber(1996b) examine birth outcomes and infant mortality through Medicaid expansion for pregnant women.
5The low-income working parents consists of 40% of uninsured population in the U.S.(Kaiser
decoupling cash welfare receipt and Medicaid eligibility. Still the eligibility income threshold for parents remained at a very low level, mostly below the poverty line, and
there exists significant variation in Medicaid eligibility across states.6
I examine whether children with uninsured parents are more disadvantaged in health care utilization by comparing Medicaid covered children having uninsured parents with those having insured parents. Building on the descriptive relationship between parental insurance status and children’s health care utilization, I examine whether Medicaid expansions for parents affect the mortality of infants and children exploiting plausibly exogenous variation in Medicaid eligibility over time. The funda-mental question that I aim to answer is whether states that offered a more generous level of Medicaid eligibility to parents have experienced improvements in infant and child mortality compared with states where the Medicaid coverage for parents was more limited. I also control for the Medicaid eligibility for children, allowing me to see whether coverage eligibility of children plays a role in mortality. In terms of utiliza-tion, I find that the presence of uninsured parents has a negative effect on children’s health care utilization even among children covered by Medicaid. Medicaid-covered children with uninsured parents have fewer physician visits and are less likely to receive preventive care compared with children having Medicaid covered parents.
Can the disparity in health care utilization translate into disparities in health outcomes? To answer this question, I examine the mortality of children with respect to the exogenous change in health insurance coverage of parents. I employ the Med-icaid generosity index introduced in Currie and Gruber (1996a,b) and construct the
indices both for children and their parents.7 The Medicaid expansions occurred at
very different rates across states which provides plausibly exogenous variation in the
6Besides the income threshold eligibility rule, there are variations across states in Medicaid
eli-gibility criteria including the existence of an asset test, the work hour limit (100-hour rule) and the level of income disregards.
7Currie and Gruber(1996a) constructed the Medicaid generosity index for children ages 1-15, and
Medicaid generosity indices.
I find that expanding Medicaid coverage to parents reduces infant mortality and child mortality. I also find that there exist substantial difference in effects of the Med-icaid expansions between black and white population. The magnitude of the impact is larger and more significant for black infants and children, and is thus effective in reducing the black-white mortality gap. Estimates suggest that the increase in the Medicaid-eligible parent population accounts for 5.06% of the reduction in infant mor-tality and 4.6% of the reduction in child mormor-tality between 1990 and 2004. The effect is larger and more significant among the black population. The expansion accounts for 7.7% of the reduction in black infant mortality and 7.85% of the reduction in black child mortality. The different magnitude of effects by races induced a significant de-cline in the black-white gap in mortality. The parental Medicaid expansion accounts for 10.02% of reduction in the black-white infant mortality gap and for 10.89% of the black-white child mortality gap.
The difference in the take-up of Medicaid between children who they are only eligible in the family and children whose parents are also eligible is one possible explanation for the different effectiveness. I examine Medicaid enrollment of infants and children when only the child is eligible in a family and when both the parent and child are eligible. The take-up rate is two times larger when both the parent and child are eligible within a family compared with when only the child being eligible. Among black population, the difference in the take-up is significantly larger. The probability of enrollment when both the parent and child are eligible for Medicaid in a family is seven times that when only the child is eligible in a family.
The current ACA health care reform brings significant changes in low-income par-ents’ Medicaid eligibility. However the difference in adoption of Medicaid expansion across states can cause disparities in mortality rates. I simulate the mortality change arising from the increased parental eligibility level under the current ACA Medicaid
implementation for each state. I also present the mortality change under the as-sumption that every state had adopted Medicaid expansion. The simulation results suggest that child mortality rates would decrease by 5 percent more if the Medicaid expansion weren’t optional compared with the simulated mortality under the current policy. The results also suggest that the different adoption of Medicaid expansion widens the disparities in mortality rate across states. The variation in child mortality rate would decrease by 12 percentage points and the variation in black child mor-tality would decrease by 19.9 percentage points with uniform adoption of Medicaid expansion.
The paper is organized as follows. Section 2 provides background on Medicaid expansions and the data I use. Section 3 presents mortality analysis. Section 4 discusses the health care utilization of children by their parents’ health insurance status. Section 5 offers some final thoughts.
II. Background
A Background on Medicaid
Historically, Medicaid eligibility was tied to participation in the Aid for Fami-lies with Dependent Children (AFDC) and was limited to children and their single parents with family income far below the poverty line. Beginning with the Deficit Reduction Act of 1984 (DEFRA 84), the linkage between AFDC coverage and
eligi-bility for Medicaid was gradually weakened.8 The Omnibus Budget Reconciliation
Act of 1989 (OBRA 89) required states to offer coverage to children below age six in families with income up to 133 % of the federal poverty line and many states set
8DERFA 84 eliminated the family structure requirements for Medicaid eligibility of young children
by requiring states to cover children born after September 1, 1983 who lived in families that were income-eligible for AFDC.
the eligibility income level above the federal guideline.9 The establishment of the
State Child Health Insurance Program (SCHIP, currently CHIP) in 1997 expanded public insurance coverage to children in families whose income was too high to qual-ify for Medicaid, and increased the eligible children population. With the additional source of public health insurance coverage for low-income children, more than 90 %
of children in low-income families became eligible for Medicaid.10
While the Medicaid eligibility for children has expanded dramatically, parents’ Medicaid eligibility income threshold was far more restricted. It was beneath the poverty line and tied to cash welfare receipt until 1990s, contrary to the earlier decou-pling for children in 1980s. During the 1990s, some states started to extend Medicaid eligibility to low-income parents who were not receiving cash welfare. With the Per-sonal Responsibility and Work Opportunity Reconciliation Act of 1996 (PRWORA 96), Medicaid eligibility for parents ceased to be tied to the receipt of cash welfare and states have had more flexibility in covering low-income working parents. However Medicaid for parents is still limited to very low-income adults and there exist signif-icant variations across states. Table 1 presents the income thresholds for working parents with dependent children by states between 1990 and 2004.
B Data
Using Medical Expenditure Panel Survey (MEPS), I examine whether children with insured parents are better off in terms of health care utilization to examine possible channels between parental Medicaid expansion and child health improvement.
912 states set the eligibility above the federal guideline an example being 185% of FPL (CA, CT,
IA, ME, MD, MA, MI, MN, MS, RI, SC,VT). However Card and Shore-Sheppard (2004) suggested the further expansion following OBRA 89 had only modest impact on health insurance coverage for children due to very low marginal take-up rates compared with expansion for children under poverty.
10Medicaid and CHIP are different programs but have had similar impacts on the low-income
children (Lo Sasso and Buchmueller, 2004). In this paper, I do not distinguish between these two programs and include CHIP in the Medicaid category. A low-income family is one with family-income less than 200 % of poverty line.
MEPS is a nationally representative survey of the U.S. civilian non-institutionalized population conducted by the Agency for Healthcare Research and Quality (AHRQ). MEPS collects information about the health care access and utilization and health insurance coverage at both of the individual and family level. Also MEPS contains information on demographic characteristics, income, and employment status. One benefit from using MEPS for the analysis is that it oversamples Hispanics, Blacks and low-income families those with income less than 200 percent of poverty line. The over-sampling of low-income families provides a large enough sample of Medicaid beneficiaries to credibly perform our analysis of health care utilization. Unfortunately public-use MEPS does not provide the state of residence, so we cannot link policy changes to these data.
To move beyond a descriptive analysis, I estimate the relationship between Medi-caid expansion of parents and their children on children’s mortality. I use two different data sources to construct the key variables of the analysis: Medicaid generosity indices and mortality rates of infants and children.
The Current Population Survey (CPS) March Supplement from 1991 to 2005 is used to construct the Medicaid generosity indices for infants, children and parents
according to the Medicaid eligibility rules of each state from 1990-2004.11 Medicaid
eligibility rules changed at different rates across states during the period. The varia-tions across states in policy details are the sources of the identification of the impact of Medicaid. The indices measure the fraction of the Medicaid eligible population among the total population in each state, year and age group. The age groups are
defined as infants less than 1 year-old and children ages 1 to 4.12 I restrict samples
to children who are living with at least one parent in the family, in order to examine
the parents’ behavioral influence on children’s health.13
11The March CPS contains income information for previous year, so I use data from 1991 to 2005. 12I restrict the sample to very young children, since they are more likely to be affected by parental
behavior.
Using the sample, I assign Medicaid eligibility for each child and their parents
according to the resident states’ eligibility rules.14 However, the index for Medicaid
generosity faces a small cell problem. There are several states without any individ-uals satisfying the eligibility rule. Also the variation in the index reflects not only variation in states’ Medicaid policies but also changes in the income distribution and the composition of the population within the states.
To overcome these problems, I use simulated eligibility, an alternative way to measure policy generosity developed in Cutler and Gruber (1996) and Currie and Gruber (1996a, b). I begin by drawing a nationally representative random sample of 1,000 individuals of each age group from every year’s March CPS. I take this nationally representative sample to calculate the fraction of infants, children and parents who would be eligible for Medicaid if they lived in each state. This simulated eligibility measure provides an index of Medicaid generosity for each states that reflects only variation in the Medicaid eligibility rules across states and years.
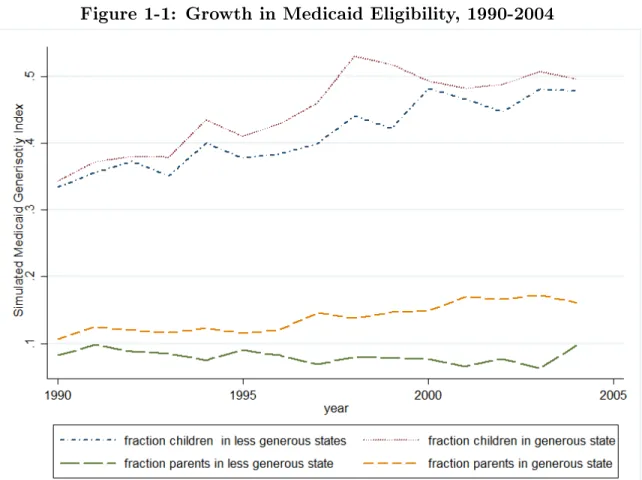
Figure 1 shows the change in simulated Medicaid eligibility index for children ages 1-4 and their parents between 1990 and 2004. I separate states into two groups: high-eligibility and low-eligibility. High-eligibility states are those in which the par-ents’ Medicaid eligibility income threshold is above the U.S. median; low-eligibility states are those in which the eligibility income threshold is below the U.S. median for each year. The fraction of an eligible parent population is persistently lower in low-eligibility states over the time period of analysis.
To measure mortality, I use the Multiple Cause of Death Files from the National Vital Statistics System to construct infant mortality and child mortality by state,
year, race and cause-of-death between 1990 and 2004.15 The infant mortality rate
around 1-2% of all children under age 5 for each year.
14Detailed AFDC eligibility rules and Medicaid rules are from National Governors Association
Report by years, Congress report on Medicaid(1993, 1998) and Kaiser Family Foundation Medicaid and Uninsured Reports. Thankfully, Tal Gross generously provided the invaluable data on the Medicaid policy details for children.
(IMR) is defined as the number of deaths of infants less than 1 year old in each state and year per 1,000 live births. The child mortality rate (CMR) is defined as the number of deaths of children ages 1-4 per 10,000 population in each state and year. Later I also exploit information listed on the cause of death to better assess channels through which parents access affects child health.
III. Mortality Analysis
Death is an extreme but important health outcome, especially for children. Much previous research has shown the positive impact of Medicaid on child mortality (Currie and Gruber, 1996a ; Howell et al. 2010; Meyer and Wherry 2010 ; Goodman-Bacon
2013 ).16 In this section I add to this literature by examining whether the expansion
of Medicaid for parents affects infant and child mortality.
A Empirical Analysis
I regress the state-year mortality rate of infants and children on the Medicaid generosity indices of children and parents via the following equation.
𝑀 𝑅𝑠𝑡𝑎 =𝛼𝑎𝑠 +𝛼𝑎𝑡 +𝛽1𝑎𝐶𝐼𝑠𝑡𝑎 +𝛽2𝑎𝑃 𝐼𝑠𝑡𝑎 +𝜖𝑎𝑠𝑡 (1.1)
where𝑀 𝑅𝑎
𝑠𝑡 denotes the mortality rate by age group𝑎: infants, children ages 1-4 , in
state𝑠and year𝑡,𝛼𝑎
𝑠 are state fixed effects and 𝛼𝑎𝑡 are year fixed effects. The variable
𝐶𝐼𝑎
𝑠𝑡 denotes the Medicaid generosity index of age group a, for each state s and year
t measured by fraction of Medicaid eligible population by agegroup. Similarly 𝑃 𝐼𝑎
𝑠𝑡
denotes the fraction of parents eligible for Medicaid. 𝜖𝑎𝑠𝑡 represents unobserved
state-filed in Vital Statistics offices of each state and the District of Columbia. Causes of death were coded according to the International Classification of Diseases, Ninth Revision during 1990-1998 and the Tenth Revision from 1999 on.
16The impact of Medicaid on mortality examined for various population group. Adults population
year shocks that affect the deaths of children. All observations are by state and
year.17 Standard errors are clustered at the state level to account for possible serial
autocorrelation within state.
B Results
The estimates of eq.(2) are presented in Table 5. Panel A presents results on the infant mortality rate and Panel B for results on the child mortality rate by races. An increase in the Medicaid generosity index for infants reduces the infant mortality rate but the effect is insignificant. However the increase in the index for parents of infants significantly reduces the infant mortality rate. The coefficient implies that a 10 percentage point increase in the index for parents results in 1.29 percent decline in the infant mortality rate relative to the baseline mortality. Between 1990 and 2004, the Medicaid generosity index for parents increased by 7.49 percentage points, which decreases the infant mortality rate by 0.96 percent. This explains 5.06 percent of the infant mortality rate reduction during that period.
The magnitude of the effect is larger and more significant among black infants. The black infant mortality rate decreases by 3.41 percent relative to the baseline mortality for the increase in index for parents during 1990-2004. The parental index increase explains 7.7 percent of the reduction in black infant mortality rate reduction during the same period. The estimate on the white infant mortality shows a negative relationship but the result is not significant.
The estimates on child mortality are similar to the results on the infant mortality rate. The increase in the index for children appears to decrease the child mortality rate slightly, but the effect is insignificant. However, the increase in the parents’ Medicaid generosity index has significantly reduced the child mortality as well. A 10
17I tried various other specifications including the fraction of the population in poverty, per capita
income for each state, the state unemployment rate and a linear time trend. They did not generate significantly different results compared with the fixed effects specification.
percentage point increase in the fraction of eligible parents is estimated to lead to a 3.6 percent decrease in the child mortality rate. Between 1990 and 2004, the fraction of eligible parents of children increased by 7.5 percentage points, which accounts 6.55 percent of child mortality reduction. Among black children, the increase in fraction of Medicaid eligible parents accounts for 7.85 percent of the reduction in black child mortality. The increase in the fraction of the eligible parent population does not have a significant effect on white child mortality.
Why is Parental Medicaid Expansion more effective than Medicaid expan-sion for Children? : Medicaid take-up
Why is expanding parental Medicaid more effective than expanding Medicaid coverage to infants and children in improving mortality? I suggest that the different take-up of Medicaid may explain the difference in effectiveness. Card and Shore-Sheppard (2004) and Currie and Gruber (1996b) show that expansions of Medicaid to low-income population are more effective than the Medicaid expansions for higher-income population in terms of insurance coverage and health outcomes due to the low
take-up among higher-income population.18 I examine whether there exists disparity
in Medicaid take-up by comparing when both the parent and child are eligible and when only the child is eligible in a family.
All sample children in the mortality analysis are born after 1984 and are affected
by the Omnibus Budget Reconciliation Act in 1989 (OBRA 89).19 Thus children
under the poverty line in the analysis are already potentially eligible whereas parental expansion is limited to those with very low-income. Therefore a large share of parent
18Card and Shore-Sheppard (2004) showed that the impact of Medicaid is lower for expansion
above the poverty line on health insurance coverage due to the low take-up rate among children. Also Currie and Gruber (1996b) showed that targeted Medicaid expansion for low-income women is more effective in birth outcome improvement than broad expansion for higher income women and suggest that these heterogeneous effects are due to the take-up difference.
19OBRA 89 made children under age 6 in families with income less than 133 % of the poverty line
population was not eligible for Medicaid relative to children. I consider child-only eligibility as a “broad expansion” and parent-eligibility as a “targeted expansion”, which are the terminologies used in Currie and Gruber(1996b). I examine the take-up of Medicaid for children using linear probability model of the form:
𝑦𝑖𝑠𝑡 =𝛼𝑠+𝛼𝑡+𝛽𝑋𝑖+𝛾𝐸𝑙𝑖𝑔𝑖𝑠𝑡𝑐 +𝛾𝐸𝑙𝑖𝑔 𝑝
𝑖𝑠𝑡+𝜖𝑖 (1.2)
where 𝑦𝑖𝑠𝑡 is an indictor of Medicaid enrollment for individual 𝑖.20 𝑋𝑖𝑠𝑡 is a set of
characteristics of the children including age, race, single mother headed household,
income and mother’s employment status. 𝐸𝑙𝑖𝑔𝑐
𝑖𝑠𝑡 is a dummy indicating whether only
the child is eligible for Medicaid, and 𝐸𝑙𝑖𝑔𝑝𝑖 is a dummy for both of the child and the
parent being eligible. 𝜖𝑖𝑠𝑡 is an error term. The standard errors are clustered at the
state level.
The regression results in Table 6 imply that approximately 9% of children en-rolled in Medicaid when only the child is eligible in a family. The take-up probability increases significantly when both the child and parent are eligible for the Medicaid. About 18% of children enrolled in Medicaid when both the parent and child are eligi-ble. The difference in Medicaid take-up is also large among the black child population. 2.4% of child are enrolled if only they are eligible for Medicaid in the family. Black children are seven times more likely to enroll in Medicaid if both the child and parent are eligible for Medicaid than when only the child is eligible.
Black and White Disparities
Blacks are more likely to be uninsured and more likely to be eligible for Medicaid.21
Thus, Medicaid plays a key role for covering the black population and the expansions
20The CPS March report individuals’ health insurance coverage in the previous year.
21The fraction of eligible black parent is two times higher than white parents (37.53% versus 14%).
43.15% of white infants are eligible for Medicaid, but 73.99 % of black infants are eligible; 37.94% of white children ages 1-4 are eligible for Medicaid while 68.11% of black children are eligible based on the analysis sample using March CPS from 1991 to 2005.
of Medicaid could be more effective among black population. Figure 3 shows the black-white disparity in mortality rate for infants and children. While the mortality gap stabilized at a high level during the 1980s, the disparity started to decline significantly from the mid-1990s. To examine whether the Medicaid expansion had an equalizing effect between black and white, I examine the black-white mortality gap and how expanding Medicaid to parents affects the change in the mortality gap.
Table 7 shows the result of Medicaid expansion and its impact on the black-white mortality disparity. Consistent with previous studies, I found that expanding Medicaid had a larger impact on mortality among black children than among white
children.22 While the Medicaid expansions for children and infants do not affect
the change of mortality gap, expanding coverage to parents is effective in reducing the mortality gap for both infants and children. For infants, a 10 percentage point increase in the Medicaid generosity index for parents leads to a 5.7% decrease in the black-white infant mortality gap. The increase in the parental Medicaid generosity decreases the black-white gap for child mortality by 7.7%. The results suggest that the expanding Medicaid for parents might be a way to improve health outcome disparities by races.
Causes of Deaths
The Vital Statistics data provide information about the causes of deaths. If the reduction of mortality rates is due to improved health care utilization, deaths from internal causes would decrease more than deaths from external causes. Table 8 shows that the increase in eligibility of parents is correlated with a significant reduction in infant and child deaths due to internal causes. The results suggest that a parental Medicaid expansion has positive effect on a mortality reduction of children through improvement in health care utilization. Deaths by external causes show different
22Currie and Gruber(1996a) found a larger impact on black children ages 1-15, but the result was
results for infants and children. The expansion of Medicaid for parents does not have any significant effect on infant deaths due to external causes, but is effective in reduction child mortality due to external causes.
While the relationship between Medicaid expansions and a decrease of internal causes of death is quite obvious, the reason why deaths due to external causes decrease is less clear. One explanation is that the uninsured receive less intensive treatment, or timely care and the other strand of explanation is that the Medicaid coverage improves the safety behavior through better access to care and health education (Doyle 2005 ; Howell et al. 2010). Motor vehicle accidents are the leading cause of deaths of children ages 1-4. According to the Centers for Diseases Control and Prevention (CDC) report in 2012, one out of three children died of motor vehicle accidents were not wearing a seat belt.
I examine the children’s deaths due to motor vehicle accidents to identify whether the improvement in safety behavior of parents related to their insurance coverage plays a role in children’s external mortality decline. Table9 shows that the expansions of Medicaid for children and parents significantly reduce mortality due to motor vehicle accidents. The results suggests the possibility that the behavior of parents changes once they are covered, such as the use of seat-belts or car-seat use for children. These changes along with improved utilization of health care appear to have improved children’s mortality rate.
Simulation based on ACA Medicaid Expansion
The expansion of Medicaid eligibility to low-income, non-elderly adults is a core component of the Affordable Care Act (ACA). Historically, low-income parents with dependent children were the categorically eligible population for Medicaid, but their
eligibility income threshold was very low.23 Thus the significant change in Medicaid
23In 2012, the U.S. median Medicaid income threshold for working parents is 60 percent of poverty
eligibility for adults to 138% of poverty line is expected to improve the coverage for low-income parents and improve the coverage gap between the child and the parent
within a family.24
The health reform was initially required to be a nation-wide Medicaid expansion, however it became a state option through the Supreme Court ruling in 2012. How would infant and child mortality rates be changed if the Medicaid expansion was not optional? Based on the mortality analysis results, I simulate the infant and child mortality rate changes according to the Medicaid eligibility changes in 2014
and counterfactual eligibility assuming every state expanded Medicaid.25 Under the
assumption that the economic conditions and the compositions of population remain constant since the 2012, I use the CPS March 2013 data to construct the simulated Medicaid generosity indices for infants, children and their parents.
Under the current Medicaid eligibility, the simulated U.S. average child mortality rate decreases by 34% relative to the child mortality rate in 1990. If every state had adopted the Medicaid expansion, the child mortality rate would have decreased more by 5 percentage points compared with the simulated mortality under the current Medicaid eligibility. The gain in the black child mortality rate would be larger if every state had adopted Medicaid expansion because 1) more black children would be eligible for Medicaid and 2) some southern states with high black child mortality
rate did not adopt the Medicaid expansion in 2014.26
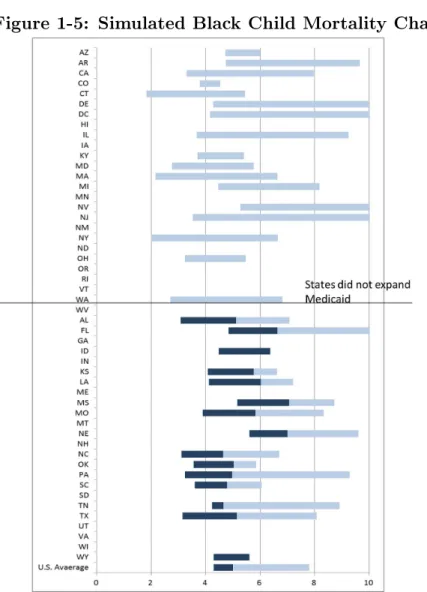
The uneven Medicaid expansion may increase the disparity in mortality across states. Figure 4 and Figure 5 show the change from 1990 in the simulated child mortality rate and black child mortality rate across states according to the current Medicaid expansion and how much further the mortality rate would change if every
24I include 5% income disregards to the threshold 133% of federal poverty line.
25Table 10 presents the Medicaid eligibility income threshold for adults used in the simulation. 26Kansas, Louisiana, Mississippi, Nebraska and Texas are the five highest black child mortality
states and their Medicaid income threshold for 2014 is even lower than the median income threshold among states did not expanded (47% of FPL).
state expanded the Medicaid. Each state that did not expand Medicaid in 2014 would have experienced a significant gain if they had adopted the Medicaid expansion. The darker part of each bar shows the additional gain from adopting the Medicaid expansion. The variation in the child mortality across states would have decreased by 13 percent if every state had adopted Medicaid expansion compared with the current level of Medicaid eligibility. The variation in black child mortality would decrease by more than 29 percent.
IV. Health Care Utilization Analysis
Uninsured parents have limited access to health care and worse health outcome than insured parents. However, once low-income, uninsured parents are covered, they increase their health care utilization and have improved health outcomes (Busch and
Duchovny, 2005).27 In this section, I examine whether having insured parents could
improve children’s health care utilization.
Parents, especially mothers, are the main decision makers of health investment in children within a family (Becker, 1981 ; Case and Paxon, 2002). Thus young children’s health behaviors including health care utilization and health outcomes, are largely affected by their mothers’ behavior. Coverage disparities between parents and their children raise concerns about children’s health since the uninsured parents’ limited access to health care can affect their children’s access to care negatively even though children are covered by health insurance. Studies have accumulated on the effect of parents’ coverage on children’s health care utilization. They show that children having uninsured parents experience more barriers to health care utilization than children with insured parents (Guendelman and Pearl, 2004 ; Gifford , Iech-Maldano, Farley-short 2005).
27Many studies have documented the relationship between adults’ health insurance status and
I re-examine the relationship between children’s health care utilization and par-ents’ health insurance status. I examine young children under age 6 who are covered by Medicaid, and analyze how their health care utilization is associated with their parents’ health insurance status using nationwide sample.
A Empirical Strategy
The empirical strategy focuses on estimating whether parental insurance status is related to children’s health care utilization. I estimate specifications of the following
form only on children covered by public insurance.28
𝑦ℎ𝑖 =𝛼+𝛽1𝐻𝐼𝑖+𝛽2′𝑋𝑖+𝜏𝑡+𝛾𝑟+𝜖𝑖 (1.3)
where 𝑖 denotes each individual child and ℎ ∈ 𝐻 denotes the kind of health care
utilization; physician visit, preventive care, emergency room visit and hospitalization.
𝐻𝐼𝑖 is an indicator for the parent’s health insurance status: uninsured (𝐻𝐼𝑖 = 0) or
Medicaid covered (𝐻𝐼𝑖 = 1). 𝑋𝑖 is the set of control variables consisting of family
characteristics.29 𝜏
𝑡 and 𝛾𝑟 are year and region dummies. The dependent variable 𝑦𝑖ℎ
is 1) the number of utilization of each kind of health care during a year, 2) Indicator of having any access during a year.
The parameter 𝛽1 captures the average difference in health care utilization
be-tween children with Medicaid covered parents and those with uninsured parents. The
estimate for𝛽1 is likely subject to the selection bias because of the differences between
uninsured parents who enrolled their children in Medicaid and Medicaid covered par-ents who also enrolled their children in Medicaid. Children’s take-up of Medicaid
28Public insurance includes Medicaid and state-wise public insurance coverage through CHIP. 29The family characteristics are income, number of children under age 18 in the family, residency
of urban area, and the mother’s marital status, education level and work status. I also control for the following characteristics of the children: race age, the first child, and subjective health status of the children reported by a family member (respondent of the survey).
remains quite low as many people fail to enroll their eligible children in Medicaid
cov-erage.30 The bias from the unobserved heterogeneity among parents confounds the
relationship between the health insurance status of parents and children’s health care utilization. If there exists adverse selection into Medicaid enrollment among children
with uninsured parents, then 𝛽1 could be downward biased.31
Estimation Sample
I focus on Medicaid enrolled children to exclude the variation in utilization due to
their own health insurance status rather than their parents’ coverage status.32
Chil-dren covered by Medicaid are more likely to experience differences in health insurance coverage from that of parents than uninsured children or privately insured children
are.33 I restrict my sample to children ages under 6, living with at least one parent
and who did not enter the school in the survey year to control influences from sources
other than parents’ decision-making, because later I focus on early life mortality.34
Also I restrict the sample to both children and parents who have the same health insurance status for the entire year to avoid possible pent-up demand for health care utilization due to changes in health insurance status within a year. Since the mother in the family is an important decision-maker in children’s health care, I use moth-ers’ demographic characteristics in the estimation of children’s health care utilization (Becker, 1981). Also I restrict the sample to children who live with their birth-mother to avoid possible bias in health investment from living with a step-mother (Case and
30Three most common reasons are the complicated paperwork required to enroll, lack of knowledge
on eligibility, or personal aversion to public assistance (KFF,2012).
31In the sample, Medicaid covered children with uninsured parents are less healthy than children
with Medicaid covered parents (p-value = 0.007).
32Among all children under age 6 in MEPS, about 45% of children were covered by Medicaid, 8%
were uncovered and 46% were covered by private insurance.
33Whereas 97% of privately insured children also have privately insured parents, and 83% of
uninsured children have uninsured parents, only 50 % of Medicaid covered children have Medicaid covered parents and about 30 % have uninsured parents. The rest are with privately insured parents.
34According to the calculation using March CPS, more than 94 % of children ages 0-5 are living
Paxon(2000)).35 The final sample for the analysis includes 11,276 children.
Table 2 gives selected summary statistics for two groups: children with Medicaid-covered parents and those with uninsured parents. Children having Medicaid-Medicaid-covered parents are more likely to be disadvantaged compared with children having uninsured parents; they have lower family income, are more likely to be minorities and live in a single parent headed family headed by female. The disadvantages of children having Medicaid-covered parents are not surprising because parents’ Medicaid eligibility is restricted to very low-income levels, mostly below the poverty line. However, chil-dren with Medicaid-covered parents are generally healthier than those with uninsured parents, which may reflect benefits of health care access.
Children with Medicaid-covered parents utilize significantly more health care of every kind than children with uninsured parents, despite disadvantages and better health status they have. This reflects the likelihood that children’s health care uti-lization is affected by parents’ health investment behavior, which is correlated with parents’ health insurance status even though differences in children’s health insurance status is conditioned out. I examine several dimensions of health care utilization. Pe-diatric guidelines strongly emphasize the importance of visiting physicians for regular check-ups. If a child does not have any physician visits during a year, this is regarded as a strong evidence of a health care access problem. I examine physician visits and
preventive care access as the primary level, efficient form of care.36 Some studies show
that getting proper and timely access to primary care can decrease emergency room visits or avoidable hospitalizations (Gadomski et al. 1998; Dafny and Gruber 2005). I examine the emergency room visits and hospitalization to capture the inefficiency in health care utilization relative to the primary level care.
35If mother does not exist in the family, I use the birth-father’s information. Within final sample
used for the analysis, 93.8% of children were living with birth-mother and 6.1% were living with birth-father without birth-mother.
36Preventive care measure is an indicator variable reporting that a child used their usual site of
B Utilization Patterns
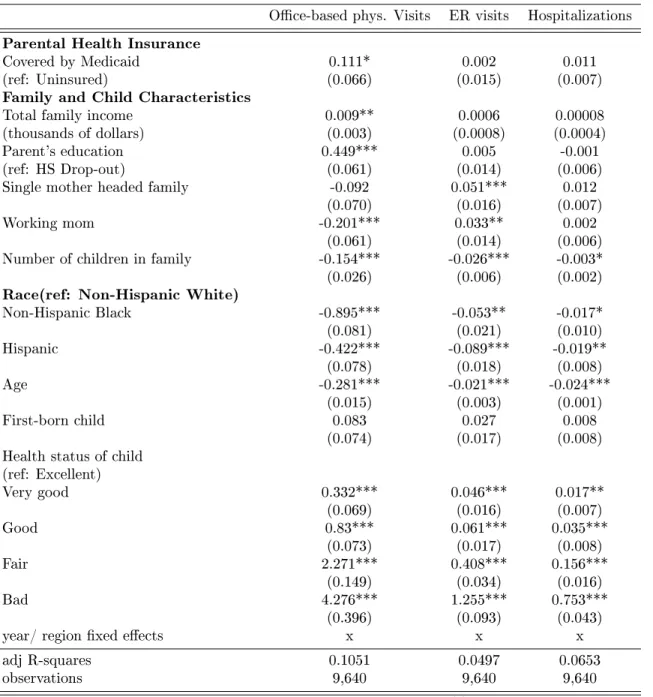
The results for health care utilization estimated by OLS are presented in Table 3. Children with Medicaid-covered parents have a significantly higher number of
physician visits, 5 percent more than children with uninsured parents during a year.37
Children with Medicaid-covered parents also have higher utilization of emergency room visits and hospitalizations but the effects are not significant.
Table 4 presents the probit regression results on the probability of having any ac-cess to the site of care during a year. The regression is to examine whether Medicaid-covered children with uninsured parents have true access problem. Children with Medicaid-covered parents do not have any significantly different access to any health care except for preventive care. Having Medicaid covered parents increases the prob-ability of getting preventive care by 12.9 percent. Different from other forms of care, preventive care is a treatment before symptoms appear. Thus preventive care could be the form of care which is more likely to be affected by parents’ health care utilization decision-making.
Once the child is covered by Medicaid, true access problems decrease.38 However,
the disparity in utilization still remains even among covered children by the differ-ence in parental coverage status. The estimates suggest that covering parents is one possible way to improve children’s health care utilization and reduce the disparities even among children covered by Medicaid.
The control variables also suggest some interesting differences in utilization pat-terns across different demographic groups. The higher family income increases the
37The difference corresponds to 16% of the difference in the number of physician visits between
Medicaid-covered and uninsured children during a year (Medicaid covered children have 0.95 more physician visits compared to uninsured children during a year). Thus, the difference in parental coverage has non-negligible marginal effect relative to the effect of children’s own health insurance status.
38For example, the probability of not having any access to physician offices decreases by 51%
level of utilization and the probability of access, which is consistent with the idea that the health care utilization is a normal good. Blacks and Hispanics use less health care. This shows that racial disparity remains even when the health insurance coverage status of children and parents are conditioned upon. Parental education levels also matter. When the birth-mother is at least a high school graduate, children had 20% more physician visits compared with the utilization level of children whose mother did not finish high school education. However, the number of emergency room visits and hospitalization does not show any significant differences related to the mother’s education. Children with single mothers have fewer physician visits and are more likely to utilize less efficient care such as emergency room visits or inpatient care. But they utilize more preventive care which is inconsistent with other inefficient utilization pattern. This might suggests that single mothers have limited resources and time to invest to give their children regular access to primary care, even though
they are aware of the necessity of primary care utilization.39 The result of working
mothers suggests similar pattern with utilization as with single mother. Children with working mothers also have fewer physician visits and utilize more emergency room visits.
It is hard to identify the causal link between the health insurance status of par-ents and health care utilization of their children due to the endogeneity issue outlined above. The results suggest some descriptive relationship between extending Medi-caid coverage to parents and children’s health care utilization. Even among children already covered by Medicaid, covering parents leads to an increase in health care utilization of children especially primary health care. To better understand this re-lationship, I look at an extreme but unambiguous measure of child health outcomes: mortality.
39The other possible explanation is that mother who covered by Medicaid during their pregnancy
could be more likely to be informed for the immunization schedules for children and increase the utilization of preventive care.
V. Conclusion
The effectiveness of expanding Medicaid to non-elderly, non-disabled adults is con-troversial. The key component of the evaluation of public insurance policy is whether covering the uninsured will actually lead to improvements in health. However, the evaluation of parental Medicaid coverage only in terms of parents’ own health improve-ment is missing the important benefit of family coverage and the positive spillover effects on children’s health. If such a spillover exists, the benefit of parental Medicaid expansion would become larger than when the benefits considered are only among beneficiaries.
Despite its importance, the question of spillover effects on children from parent has received little attention. While a number of studies have shown that expanding Medicaid to parents improves children’s health insurance coverage and health care access, there is little evidence on the relationship between parental Medicaid coverage and children’s health outcomes.
This paper fills this gap in literature by examining Medicaid eligibility for low-income working parents from 1990 to 2004 and its impact on the mortality of children. I do this in the presence of policy changes which induced plausibly exogenous increase in the Medicaid-eligible population, using simulated Medicaid generosity indices for parents and children.
I find new evidence on children’s mortality improvements following the expansion in Medicaid eligibility. The regression estimates indicate that the increase in the eligible parent population between 1990 to 2004 explains 5 percent of the reduction in infant mortality rate and 4.6 percent of the reduction in child mortality rate. The expansion accounts for a 7.7 percent reduction in black infant mortality rate and a 7.85 percent reduction in black child mortality rate. The differential effect across black and white leads to a significant decline in the racial mortality gap. The parental
Medicaid expansion accounts for 10.02 percent and 10.89 percent of the reduction in black-white infant and child mortality gaps. I interpret the different effectiveness of parental coverage as resulting from the difference in take-up of Medicaid. The Medicaid eligible children with Medicaid eligible parents are two times more likely to enroll in Medicaid. Simulation results using the features of the Medicaid expansion in the Affordable Care Act suggest that the different adoption patterns of the Medicaid expansion across states may enlarge existing mortality disparities across states.
My findings suggest that understanding how parental Medicaid expansion bene-fits entire family, not just parents, is important in evaluating the benefit of policy. Secondly, the unequal adoption of policy across state could enlarge the health dis-parities. While I suggest the improvement in primary care access as one possible mechanism for the improvement in health outcomes of children, there could be many other possible mechanisms affecting children’s health outcome through parental cover-age. Further research is necessary for examining possible intra-household mechanisms affecting children. For example the change in financial condition within family can be one possible mechanism for improvement of children’s health outcomes. Also I only examine young children, however the accumulated difference can also have long-term effect on children: improvements in health outcomes among teens, young adults and further improve productivity in adulthood. In the ACA simulation, I only consider the Medicaid expansion but health insurance subsidies to families with high income to be eligible for Medicaid may also make changes in parents’ coverage and further affect children. A more detailed investigation related to these policy details and effects are necessary.
Bibliography
[1] Anna Aizer and Jeffrey Grogger. Parental Medicaid Expansions and Health Insurance Coverage. NBER Working Papers 9907, National Bureau of Economic Research, Inc, August 2003.
[2] Paul Jenkins Anne Gadomski and Melissa Nichols. Impact of a medicaid primary care provider and preventive care on pediatric hospitalization. Pediatrics, 101(3), March 1998.
[3] National Governors’ Association. State medicaid coverage of pregnant women and children. Technical report.
[4] Gary S. Becker. A Treatise on the Family. Number beck81-1 in NBER Books. National Bureau of Economic Research, Inc, 1981.
[5] Gary S Becker and Nigel Tomes. Human Capital and the Rise and Fall of Families. Journal of Labor Economics, 4(3):S1–39, July 1986.
[6] Susan H. Busch and Noelia Duchovny. Family coverage expansions: Impact on insurance coverage and health care utilization of parents. Journal of Health Economics, 24(5), 2005.
[7] David Card and Lara D. Shore-Sheppard. Using Discontinuous Eligibility Rules to Identify the Effects of the Federal Medicaid Expansions on Low-Income Chil-dren. The Review of Economics and Statistics, 86(3), August 2004.
[8] Anne Case and Christina Paxson. Parental behavior and child health. Health Affairs, 21(2), 2002.
[9] Janet Currie, Sandra Decker, and Wanchuan Lin. Has public health insurance for older children reduced disparities in access to care and health outcomes? Journal of Health Economics, 27(6), 2008.
[10] Janet Currie and Jonathan Gruber. Health insurance eligibility, utilization of medical care and child mortality. Quarterly Journal of Economics, 1996.
[11] Janet Currie and Jonathan Gruber. Saving babies: The efficacy and cost of recent changes in the medicaid eligibility of pregnant women. The Journal of Political Economy, 1996.
[12] David M. Cutler and Jonathan Gruber. Does public insurance crowd out private insurance. The Quarterly Journal of Economics, 111(2), 1996.
[13] Leemore Dafny and Jonathan Gruber. Public insurance and child hospitaliza-tions: access and efficiency effects. Journal of Public Economics, 89(1), January 2005.
[14] Lisa Dubay and Genevieve Kenney. Covering parents through medicaid and schip: Potential benefits to low income parents and children. The Kaiser Com-mission on Medicaid and the Uninsured, October 2001.
[15] Robert Weech-Maldonado Elizabeth Gifford and Pamela Farley Short. Low-income childrenâĂŹs preventive services use:implications of parentsâĂŹ medicaid status. Health Care Financial Review, 26(4), 2005.
[16] Sara Hogan Alsahdye Yemane Jonay Foster Embry Howell, Sandy Decker. De-clining child mortality and continuing racial disparities in the era of the medicaid
and schip insurance coverage expansions. American Journal of Public Health, 100(12), December 2010.
[17] Andrew Wilper et al. Health insurance and mortality in us adults. American Journal of Public Health, 99(12), December 2009.
[18] Kenney M. Genevieve et al. Taking stock: Health insurance coverage for parents under the aca in 2014. Policy brief, Urban Institute, Sep. 2014.
[19] Agency for HealthCare Research and Quality. Medical expenditure panel survey hc full year files, 1996-2005.
[20] Andrew Goodman-Bacon. Public insurance and mortality: Evidence from med-icaid implementation. Job Market Paper, November 2013.
[21] Tal Gross and Matthew J. Notowidigdo. Health insurance and the consumer bankruptcy decision: Evidence from expansions of medicaid. Journal of Public Economics, 95(7âĂŞ8):767 – 778, 2011.
[22] Joseph J. Doyle Jr. Health insurance, treatment and outcomes: Using auto accidents as health shocks. Working Paper 11099, National Bureau of Economic Research, February 2005.
[23] Leighton Ku and Matthew Broaddus. Coverage of parents helps children, too. Center of Budget and Policy Priorities, October 2006.
[24] Jeanne Lambrew. Health insurance: A family affair. The Commonwealth Fund, May 2001.
[25] Helen Levy and David Meltzer. The impact of health insurance on health. Annual Review of Public Health, 29, April 2008.
[26] Bruce D. Meyer and Laura R. Wherry. Saving teens: Using a policy discontinuity to estimate the effects of medicaid eligibility. Working Paper 18309, National Bureau of Economic Research, August 2012.
[27] Committee on the Consequences of Uninsurance. Health Insurance is a Family Matter. Institute of Medicine, 2002.
[28] V. Angulo S. Guendelman, M. Wier and D. Oman. The effects of child-only insurance coverage and family coverage on health care access and use: recent findings among low-income children in california. Health Servicies Research, 41(1), Feb. 2006.
[29] Anthony T. Lo Sasso and Thomas C. Buchmueller. The effect of the state childrenâĂŹs health insurance program on health insurance coverage. Journal of Health Economics, 23(5):1059 – 1082, 2004.
[30] Benjamin D. Sommers. Insuring children or insuring families: Do parental and sibling coverage lead to improved retention of children in medicaid and chip? Journal of Health Economics, 25(6), 2006.
[31] Sara Rosenbaum Ramona Whittington. Parental health insurance coverage as child health policy: Evidence from the literature. Department of Health Policy Report, June 2007.
[32] Barbara Wolfe, Thomas Kaplan, Robert Haveman, and Yoonyoung Cho. {SCHIP} expansion and parental coverage: An evaluation of wisconsin’s bad-gercare. Journal of Health Economics, 25(6), 2006.
Figures
Figure 1-1: Growth in Medicaid Eligibility, 1990-2004
Note: The figure plots the simulated fraction of eligible children ages 1-4 and their parent population based on our calculation from the March CPS. The high eligibility states are where parents’ Medicaid eligibility income threshold is above the U.S. median. The figure shows that fraction of eligible population for Medicaid was about four times higher for children than for their parents. The gap between children and their parents is higher in the low eligibility states(𝑝−𝑣𝑎𝑙𝑢𝑒= 0.0151).
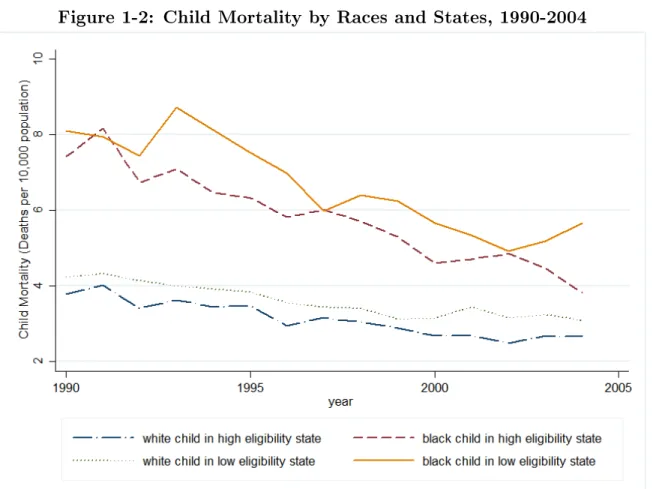
Figure 1-2: Child Mortality by Races and States, 1990-2004
Notes: The figure plots the child mortality rate by races and states’ eligibility level. The figure shows that both of white child and black child mortality are higher in the low eligibility states. The disparity in black-white mortality gap is also higher in the low eligibility states(𝑝−𝑣𝑎𝑙𝑢𝑒= 0.018)
Figure 1-3: Black-White Mortality Disparity
Notes: The figure plots the black-white mortality rate gap of infants and children. The figure shows that the mortality gap decreased rapidly since the mid-1990s.
Figure 1-4: Simulated Child Mortality Change
Note: Each bar show current estimated child mortality for states expanded Medicaid. For states did not expand Medicaid, the bar shows current esti-mate based on the current level of Medicaid generosity and simulated child mortality change assuming every state had expanded Medicaid. The starting point of bar is child mortality in 1990.
Figure 1-5: Simulated Black Child Mortality Change
Note: The bars with light color show the simulated black child mortality change between 1990 and simulated black child mortality rate using cur-rent Medicaid eligibility level. For states did not expand Medicaid, the bar shows current estimate based on the current level of Medicaid generosity and simulated black child mortality change assuming every state had expanded Medicaid. The starting point of bar is black child mortality in 1990.
Table 1.1: Medicaid eligibility income threshold for working parents 1990 2004 Difference Alabama 13.4% 19.0% 5.6% Alaska 76.9% 81.0% 4.1% Arizona 33.3% 200.0% 166.7% Arkansas 23.2% 20.0% - 3.2% California 78.9% 107.0% 28.1% Colorado 47.8% 39.0% - 8.8% Conneticut 63.1% 107.0% 43.9 % Delaware 37.8% 117.0% 79.2 % D.C. 46.5% 200.0% 153.3% Florida 33.4% 62.0% 28.6% Georgia 47.0% 58.0% 11.0% Hawaii 59.5% 100.0% 40.5% Idaho 35.8% 31.0% -4.8 % Illinois 41.7% 140.0% 99.3% Indiana 32.7% 29.0% -3.7% Iowa 46.6% 82.0% 35.4% Kansas 43.5% 38.0% -5.5% Kentucky 59.8% 70.0% 10.2% Louisiana 21.6% 20.0% -1.6% Maine 74.1% 157.0% 82.9 Maryland 45.0% 40.0% -5.0% Massachusetts 61.3% 133.0% 71.7% Michigan 65.3% 59.0% -6.3% Minnesota 60.5% 275.0% 214.5% Mississippi 41.8% 35.0% -6.8% Missouri 32.8% 82.0% 49.2% Montana 40.8% 65.0% 24.2% Nebraska 41.4% 56.0% 14.6% Nevada 37.5% 87.0% 49.5% New Hampshire 67.4% 60.0% -7.4% New Jersey 48.2% 41.0% -7.2% New Mexico 30.0% 69.0% 39.0% New York 70.8% 150.0% 79.2% North Carolina 31.5% 57.0% 25.5% North Dakota 43.9% 69.0% 25.1% Ohio 36.5% 100.0% 63.5% Oklahoma 53.5% 45.0% -8.5% Oregon 49.1% 100.0% 51.9% Pennsylvania 47.8% 66.0% 18.2% Rhode Island 61.7% 192.0% 130.3% South Carolina 47.6% 97.0% 49.4% South Dakota 42.8% 61.0% 18.2% Tennessee 44.0% 100.0% 56.0% Texas 20.9% 33.0% 12.1% Utah 58.6% 53.0% -5.6% Vermont 75.2% 192.0% 116.8% Virginia 33.1% 36.0% 2.9% Washington 56.9% 86.0% 29.1% West Virginia 28.3% 38.0% 9.7% Wisconsin 58.8% 192.0% 133.2% Wyoming 40.9% 60.0% 19.1% U.S. Median 45.0% 69.0% 24.0% Source: National Governors’ Association for 1990 and Kaiser Commission on Medicaid and Uninsured for 2004 information.
Table 1.2: MEPS Descriptive Statistics
Uninsured Medicaid Difference Health Care Utilization
Number of office-based phys. Visit 2.201 2.360 -0.158**
Number of ER visits 0.225 0.271 -0.046***
Number of hospitalization 0.054 0.075 -0.021***
Ever visited phys. office during a year 0.737 0.745 -0.008
Ever had any preventive care 0.834 0.857 -0.022***
Ever visited ER 0.167 0.187 -0.020**
Ever hospitalized 0.046 0.060 -0.014***
Family Characteristics
Total family income(thousands of dollar) 24.13 18.30 5.830***
Parent’s education(HS grad and above) 0.429 0.516 -0.086***
Single mother headed family 0.253 0.531 -0.278***
Working mom 0.416 0.509 -0.092***
Number of children in family 2.636 2.723 -0.086
Race/ethnicity of child
Non-Hispanic Black 0.113 0.252 -0.139***
Number of obs. 3,951 7,325
Note: The sample consists of Medicaid covered children ages 0-4 during the year from 1996 to 2004. Standard errors are in parenthesis. * denote p-value for difference.
Table 1.3: Regression on children’s health care utilization
Office-based phys. Visits ER visits Hospitalizations Parental Health Insurance
Covered by Medicaid 0.111* 0.002 0.011
(ref: Uninsured) (0.066) (0.015) (0.007)
Family and Child Characteristics
Total family income 0.009** 0.0006 0.00008
(thousands of dollars) (0.003) (0.0008) (0.0004)
Parent’s education 0.449*** 0.005 -0.001
(ref: HS Drop-out) (0.061) (0.014) (0.006)
Single mother headed family -0.092 0.051*** 0.012
(0.070) (0.016) (0.007)
Working mom -0.201*** 0.033** 0.002
(0.061) (0.014) (0.006)
Number of children in family -0.154*** -0.026*** -0.003*
(0.026) (0.006) (0.002)
Race(ref: Non-Hispanic White)
Non-Hispanic Black -0.895*** -0.053** -0.017* (0.081) (0.021) (0.010) Hispanic -0.422*** -0.089*** -0.019** (0.078) (0.018) (0.008) Age -0.281*** -0.021*** -0.024*** (0.015) (0.003) (0.001) First-born child 0.083 0.027 0.008 (0.074) (0.017) (0.008)
Health status of child (ref: Excellent) Very good 0.332*** 0.046*** 0.017** (0.069) (0.016) (0.007) Good 0.83*** 0.061*** 0.035*** (0.073) (0.017) (0.008) Fair 2.271*** 0.408*** 0.156*** (0.149) (0.034) (0.016) Bad 4.276*** 1.255*** 0.753*** (0.396) (0.093) (0.043)
year/ region fixed effects x x x
adj R-squares 0.1051 0.0497 0.0653
observations 9,640 9,640 9,640
Note: Coefficient estimates are from the OLS regression as described in eq.(1). Robust standard errors are in parentheses. *𝑝 <0.10, **𝑝 <0.05, ***𝑝 <0.01
Table 1.4: textbfRegression on Children’s Health Care Access Office-based
phys. Visits Preventive Care ER visits Hospitalizations Parental Health Insurance
Covered by Medicaid -0.0001 0.105*** -0.009 -0.0015
(ref: Uninsured) (0.032) (0.039) (0.034) (0.052)
Family and Child Characteristics
Total family income 0.006*** 0.007*** -0.0003 0.0013
(thousands of dollars) (0.001) (0.002) (0.002) (0.002)
Parent’s education(HS grad +) 0.176*** 0.108*** 0.009 -0.031
(ref: HS Drop-out) (0.030) (0.038) (0.032) (0.048)
Single mother headed family 0.011 0.078* 0.117*** 0.068
(0.034) (0.044) (0.037) (0.068)
Working mom 0.006 0.021 0.119*** 0.035
(0.030) (0.039) (0.032) (0.048)
Number of children in family -0.071*** -0.031* -0.0787*** -0.061***
(0.012) (0.016) (0.015) (0.023)
Race(ref: Non-Hispanic White)
Non-Hispanic Black -0.154*** -0.037 -0.123*** -0.021 (0.044) (0.060) (0.047) (0.068) Hispanic 0.011 -0.189*** -0.214*** -0.149** (0.039) (0.047) (0.039) (0.058) Age -0.113*** 0.107*** -0.045*** -0.199*** (0.007) (0.009) (0.008) (0.012) First-born child 0.113*** -0.060 0.037 0.003 (0.036) (0.047) (0.039) (0.061)
Health status of child (ref: Excellent) Very good 0.108*** 0.087** 0.085** 0.130** (0.033) (0.043) (0.037) (0.056) Good 0.180 0.078 0.118 0.262 (0.036) (0.045) (0.039) (0.058) Fair 0.343*** 0.310*** 0.571*** 0.831*** (0.077) (0.103) (0.071) (0.089) Bad 0.750*** 0.152 1.236*** 1.299*** (0.243) (0.251) (0.179) (0.197)
year/ region fixed effects x x x x
R-square 0.0475 0.0364 0.0353 0.1138
observations 9,640 7,703 9,640 9,640
Note: Coefficient estimates are from a probit regression as described in eq.(1). Marginal effects are reported. Robust standard errors are in parentheses. *𝑝 <0.10, ** 𝑝 <0.05, ***𝑝 <0.01Since question on preventive
T able 1.5: Regression of Mortalit y Rate on Sim ulated Medicaid Generosit y Indices P anel A: Infan t Mortalit y Rate Total White Blac k Infan t Medicaid Index -0.060 -0.017 -0.095 -0.076 0.391 0.517 (0.598) (0.591) (0.533) (0.532) (2.265) (2.250) P aren t Medic aid Index -1.403*** -1.403*** -0.613 -0.611 -5.466*** -5.475*** (0.450) (0.454) (0.404) (0.404) (1.884) (1.886) Fixed Effects state x x x x x x x x x year x x x x x x x x x adj. R-square 0.8568 0.8588 0.8585 0.6066 0.6068 0.6073 0.6535 0.6587 0.6581 Observ ation 750 750 750 750 750 750 618 618 618 P anel B: Chil d Mortalit y Rate Total White Blac k Child Medicaid Index -0.5 08 -0. 340 -0.240 -0.333 -0.392 -0.313 (0.438) (0.455) (0.448) (0.457) (1.077) (1.069) P aren t Medic aid Index -0.762** -0.732** -0.105 -0.082 -2.672*** -2.665* (0.374) (0.375) (0.392) (0.394) (0.978) (0.980) Fixed Effects state x x x x x x x x x year x x x x x x x x x adj. R-square 0.6941 0.6953 0.6954 0.5222 0.5219 0.5215 0.5779 0.5846 0.5837 Observ ation 750 750 750 748 748 748 510 510 510 Notes: The co efficien ts of estimates are from eq.(2). Robust standard errors are clustered by states. Standard errors are in paren theses and cl ustered at state lev el. * 𝑝 < 0 . 10 , ** 𝑝 < 0 . 05 , *** 𝑝 < 0 . 01 . T otal mortalit y indicates mortalit y of white and blac k infan ts/c hildren. All observ ations are state and ye ar lev el, dropp ed if the num be r of deaths in a state/y ear cell is less than 5 due to re-liabilit y. For example, observ ations of V ermon t, New Hampshire, Main e are not included in th e analysis for blac k infan t and child mortalit y.