Students’ Perceptions of the Educational Environment in a New
Dental School in Northern Nigeria
Paul Ikhodaro Idon1,2* Ibrahim Kayode Suleiman1 Hector Oladapo Olasoji1,2
1. Department of Dental Surgery, University of Maiduguri Teaching Hospital, Maiduguri, Borno State, Nigeria 2. Faculty of Dentistry, College of Medical Sciences, University of Maiduguri, Maiduguri, Borno State, Nigeria
* E-mail of the corresponding author: idonp85@gmail.com Abstract
The educational climate surrounding students is considered as one of the factors determining academic success. Students and teachers have become aware of the 'educational environment' of their institution. Health science courses in Nigerian universities employ a combination of traditional classroom and clinical learning methods. There is however a scarcity of empirical evidence that evaluates this balance or the way dental students perceive its delivery. Therefore, this study aimed to evaluate, by way of student perceptions, the overall education environment within dental surgery courses in a new Nigerian dental school that employs a balance of traditional classroom-based teaching and clinical work.We used a short demographic questionnaire and the 50-item DREEM questionnaire administered during teaching sessions to collect information on the students’ perception of the environment in their dental school.We recorded high total DREEM scores across the different year levels of enrolment with a total DREEM mean score of 138.2 and also identified problem areas which centered on timetabling, emphasis on factual learning, boredom and stress.Formative assessment structure for students, attention to timetabling, improved administration, and systems to identify stressed students are our key recommendations.
Keywords: Dental students, learning environment, educational environment. 1. Introduction
The educational climate surrounding students is considered as one of the factors determining academic success (Ross, 2005). Though difficult to define (Genn & Harden, 1986), the educational climate or environment is seen by several authors as consisting of an objective external environment, everything that happens within the classroom, department, faculty or university (Roff & McAleer, 2001; Genn, 2001) and an internal subjective perception by the students (Ostapczuk et al, 2012).
In addition to the documented curriculum, students and teachers have become aware of the 'educational environment' of the institution (Roff & McAleer, 2001), and their subjective perceptions constitute the climate (Till, 2005).Extensive investigation of the learning environment of medical students has been carried out with a view to identifying strengths and weaknesses, to monitor change at times of curriculum reform, to compare learning environments across teaching sites and to compare staff and students’ perceptions (Edgren et al, 2010; Miles & Leinster, 2009). The perception of these students of the environment within which they study has been shown to have a significant impact on their behaviour, academic progress and sense of well-being (Genn, 2001:2; Audin, Davy & Barkham, 2003). As such, the context of health science education as it is with medicine (Genn, 2001:1), has moved in recent decades to embrace a more student-centered curriculum (Salvatori, 1999).
Various methodologies have been utilized to investigate educational climate and recent studies have included the use of qualitative approaches (Seabrook, 2004) or questionnaires (Audin, Davy & Barkham, 2003; Roff et al, 1997; Sobral, 2004). Of these, only the DREEM (Dundee Ready Educational Environment Measure) questionnaire (Roff et al, 1997) is specific to the unique environment experienced by students on medical and healthcare-related courses (Whittle, Whelan & Murdoch-Eaton, 2007). Roff et al. (1997) developed and validated this generic, multicultural, multidimensional instrument for measuring the Learning Environment in medical and allied institutions and is being used worldwide with translations in over a dozen languages. Also the findings from the DREEM have been found to be consistent with qualitative information attained via interviews (Denz-Penhey & Murdoch, 2009). Getulio et al. (2005) described the DREEM as a robust instrument designed to measure students' perceptions about dimensions of the Learning Environment. Roff (2005) described that on an average the DREEM score varied from 78 to 139 out of 200 and the questionnaire had the ability to identify the strengths and weaknesses of particular institutions.
In spite of its translation into several languages and its extensive use with thousands of health professional students all over the world, the DREEM has only been employed in very few studies with dental students in India (Thomas et al, 2009), Greece (Kossioni et al, 2011), Pakistan (Ali et al, 2012) and Germany (Ostapczuk et al, 2012). In another study, Zamzuri et al. (2004) assessed the perceptions of Malaysian dental technology and dental nursing students.
While a combination of classroom and clinical learning environments is commonplace within Nigerian health science courses, there is a scarcity of empirical evidence that defines or evaluates this current balance or
the way its delivery is perceived by its students. The lack of empirical research means that little is known about the way health science students perceive their course learning environments. As a result, the opportunity to substantiate or ‘fine tune’ the current curriculum may have been overlooked to date. The DREEM has been validated in a number of undergraduate medical learning environments but has not been used in Nigeria.
The Faculty of Dentistry of the University of Maiduguri is a relatively new dental school with a history of about 12 years. The current curriculum runs in five phases comprising introductory basic sciences, applied sciences, behavioral sciences, and clinical sciences. The curriculum of the dental school at the University of Maiduguri is – like its counterpart in human medicine – traditional, (with a year-pre-clinical period and a 3-year-clinical period). However, there are important structural differences between these two courses: First, the total group of dental students in lecture sessions and clinical rotations is relatively small as compared with the large group of medical students in the 3-year clinical period. Accordingly, dental classes during this stage are usually smaller and more familiar. Second, dental education is characterized by more clinical and practical classes.
Applying the DREEM to dental students would be invaluable on a range of levels. Firstly it would provide an insightful snapshot of the way these students view their respective courses and enable the institution to address any key issues, just as several medical institutions have done previously (Denz-Penhey & Murdoch, 2009; Bassau et al, 2003; Jiffry et al, 2005). Secondly, many of these findings may infer parallel trends for other institutions that run one or more similar courses. Alternatively, the findings from such a study might be a useful point of reference for future DREEM studies that involve dental students.
The aim of this study therefore is to assess, by way of student perceptions recorded on the DREEM inventory, the overall education environment at the University of Maiduguri Faculty of Dentistry, the first of such study in a Nigerian university, as well as specific aspects of this learning environment. A second aim of this study is to investigate whether the education environment or aspects of it are perceived more or less favourably for students of different year levels in the faculty.
2. Methods
The research used a short demographic questionnaire constructed to collect information such as the participant’s gender, age group, and year of study. The 50-item DREEM questionnaire was used to collect information on the students’ perception of the environment in their dental school. The DREEM questionnaire has 50 items organized into five domains namely Students’ Perception of Learning (SPL), Students’ Perception of Teaching (SPT), Students’ Academic Self-perception (SAP), Students’ Perception of Atmosphere (SPA) and Students’ Social Self-Perception (SSP). The responses are scored on a 5-point Likert scale as: 4 for Strongly Agree (SA), 3 for Agree (A), 2 for Uncertain (U), 1 for Disagree (D) and 0 for Strongly Disagree (SD). However, nine of the 50 items (numbers 4, 8, 9, 17, 25, 35, 39, 48 and 50) are negative statements and should be scored 0 for SA, 1 for A, 2 for U, 3 for D and 4 for SD. Item scores count towards an overall environment score as well as one of five subscales or domains. The overall DREEM score is out of 200 while the subscale scores are 48, 44, 32, 48 and 28 for SPL, SPT, SAP, SPA and SSP respectively.
An approximate guide for interpreting overall scores was provided by McAleer and Roff (2002), and indicated that a score of 0 – 50 indicates “very poor”, 51–100 indicates ‘‘plenty of problems, 101 to 150 is ‘‘more positive than negative,’’ while 151 – 200 indicates “excellent”. Indeed, it is advised that a score of 100 should be interpreted as being viewed with ‘‘considerable ambivalence by students and as such needs to be improved.’’
Individual item can also be interpreted to pinpoint more specific strengths and weaknesses within the educational climate. Items that have a mean score of 3.5 or more are real positive points. Any item with a mean of 2 or less should be examined more closely as they indicate problem areas. Item with a mean score between 2 and 3 are aspect of climate that could be enhanced.
The Research and Ethical Committee of the University of Maiduguri approved the study. The study was explained to the respondents in each year level by one of the authors during a teaching session, their consent obtained and their anonymity assured. The questionnaires were then distributed to the respondents by the same author. The student representative for each class year retrieved completed questionnaires during the next teaching session for submission.
3.1 Analysis
Data was analyzed using Microsoft excel 2007 (Microsoft Co., Redmond, WA, USA) and Statistical Package for Social Sciences (SPSS) v20 (SPSS Inc., IL, USA) using descriptive statistics. The mean was calculated for all the items in each year level and across the year levels. For each of the five domains (SPL, SPT, SAP, SPA and SSP), scores were calculated as the sum total of the item mean scores in that domain for each level. The subscale scores were summed across the classes and the mean calculated for each subscale across the classes. The total DREEM score for each year level was calculated by adding the subscale scores of all the five domains. For
comparison, the domain scores were expressed as a percentage of the maximum subscale and DREEM score possible.
4. Results
One hundred and forty one questionnaires were distributed, and 134 (45 females, 89 males) responded. This represents an overall response rate of 95%. There was a 100% response from the females. There was no missing data from any of the respondent.
Table 1: Demographic information of participants
Variable N Respondent % Gender Male 89 66.4 Female 45 33.6 Year of enrolment 1st year 10 7.5 2nd year 13 9.7 3rd year 14 10.5 4th year 25 18.7 5th year 36 26.9 6th year 36 26.9 Total 134
4.1 Item mean for all the students
The DREEM score for individual items is shown in Table 2. Only 2 items (2 and 10) scored greater than or equal to 3.5 mean score across the classes. Four items (12, 14, 25 and 42) had mean item score less than or equal to 2 (Figure 1).
4.2 Overall mean scores
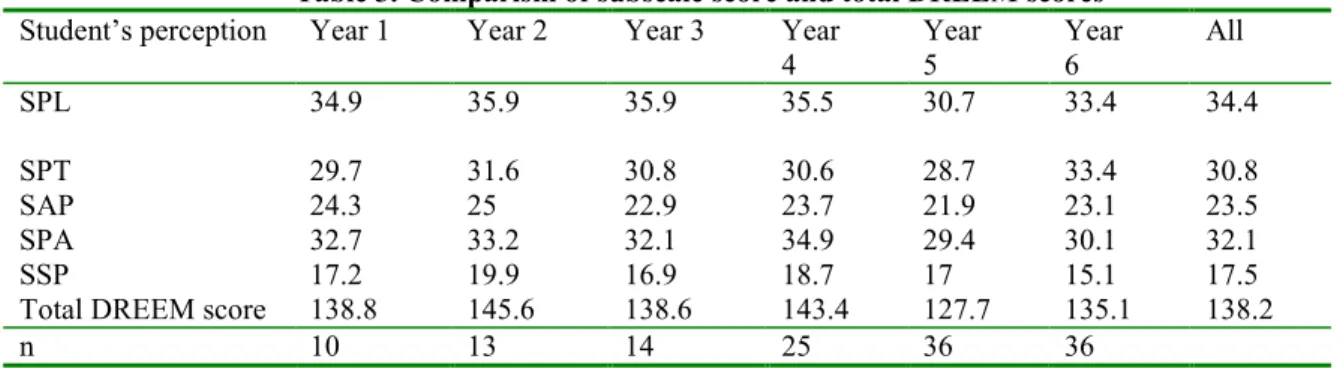
The overall total, subscale score and the percentage score is shown in Tables 3 and 4 respectively. It shows that total DREEM score ranged from 127.7/200 (63.9%) for year 5 to 145.6/200 (72.8%) for year 2.
Table 2: Item mean score
Question Year 1 Year 2 Year 3 Year 4 Year 5 Year 6 Mean
S tu d en ts ’ P e rc ep ti o n o f L ea rn in g
1 I am encouraged to participate in class
3.1 3.2 3.4 3.4 3.4 3.3 3.3 7 The teaching is often stimulating
3.2 3.4 3.3 3.0 2.8 3.1 3.1 13 The teaching is registrar centered
2.8 2.3 3.4 2.6 2.3 1.9 2.6 16 The teaching helps to develop my competence
3.4 3.5 3.4 3.4 3.0 3.5 3.4 20 The teaching is well focused
3.0 3.4 3 3.3 2.3 3.1 3.0 21 The teaching helps to develop my confidence
3.5 3.4 3 3.6 2.9 3.1 3.3 24 The teaching time is put to good use
2.8 2.9 2.5 3.1 2.3 2.7 2.7 25 The teaching over emphasizes factual learning
1.5 1.3 2.5 1.4 1.4 1.4 1.6a
38 I am clear about the learning objectives of the
course 3.2 3.3 3.1 3.1 2.8 3 3.1 44 The teaching encourages me to be an active
learner 3.1 3.3 3.1 3.3 2.6 3.1 3.1 47 Long term learning is emphasized over short term
learning 3.0 3.1 2.8 2.8 2.4 2.8 2.8 48 The teaching is too teacher centered
2.3 3.0 2.4 2.4 2.5 2.4 2.5 Subscale score 34.9 35.9 35.9 35.5 30.7 33.4 S tu d en ts ’ P er ce p ti o n o f T ea ch in g
2 The teachers are knowledgeable
3.6 3.8 3.8 3.1 3.1 3.8 3.5b
6 The teachers espouse a patient centered approach
to consulting 2 2.2 2.4 2.6 2.4 2.4 2.3 8 The teachers ridicule the students
2.4 3 2.5 2.7 2.6 2.9 3.0 9 The teachers are authoritarian
1.9 2.3 2.4 2.2 2.1 3.4 2.4 18 The teachers have good communication skills with
29 The teachers are good at providing feedback to
students 2.8 2.7 2.6 2.6 2.4 2.7 2.6 32 The teachers provide constructive criticism here
2.9 2.3 2.5 2.4 2.6 2.8 2.6 37 The teachers give clear examples
3.1 3.4 3 3.1 2.7 3.2 3.1 39 The teachers get angry in teaching sessions
3.1 3.2 3 2.8 2.8 3 3.0 40 The teachers are well prepared for their teaching
sessions 3.1 3.2 2.5 3.2 2.7 3.1 3.0 49 I feel able to ask the questions I want
2.8 3.5 2.9 3 2.7 3 3.0 Subscale score 29.7 31.6 30.8 30.6 28.7 33.4 S tu d en ts ’ A ca d em ic S el f-P er ce p ti o n
5 Learning strategies which worked for me before
continue to work for me now 2 2.8 2.3 2.8 2.6 2.4 2.5
10 I am confident about passing this year
3.8 3.8 3.5 3.6 3.4 3.6 3.6b
22 I feel I am being well prepared for my profession
3.5 3.5 3 3.5 3 3.5 3.3 26 Last year’s work has been a good preparation for
this year’s work 3.2 3 2.8 2.4 2.3 2.5 2.7 27 I am able to memorize all I need
2 2.4 2.4 2.8 1.8 1.6 2.2 31 I have learned a lot about empathy in my
profession 3.2 3.2 3 2.7 3.1 3.2 3.1 41 My problem solving skills are being well
developed here 3.2 3.2 2.6 3.1 2.6 2.9 2.9 45 Much of what I have to learn seems relevant to a
career in healthcare 3.4 3.1 3.3 2.7 3.2 3.4 3.2 Subscale score 24.3 25 22.9 23.7 21.9 23.1 S tu d en ts ’ P e rc ep ti o n o f A tm o sp h er e
11 The atmosphere is relaxed during consultation
teaching 2.1 2.3 2.7 3 2.5 2.5 2.5 12 The course is well timetabled
1.4 1.5 2.5 2.9 1.1 1 1.7a
17 Cheating is a problem on this course
3.3 3.2 3 2.9 2.9 3.1 3.1 23 The atmosphere is relaxed during lectures
2.8 3.1 2.5 3.1 2.5 2.6 2.8 30 There are opportunities for me to develop
interpersonal skills 3.2 2.8 2.9 3 2.8 3 3.0 33 I feel comfortable in teaching sessions socially
2.8 3.2 3.1 2.8 2.6 2.6 2.9 34 The atmosphere is relaxed during seminars/tutorial
2.6 3.1 2.6 3.0 2.7 2.6 2.8 35 I find the experience disappointing
3.3 3.4 2.9 3.1 2.8 3.1 3.1 36 I am able to concentrate well
3.2 3.1 2.9 3.1 2.7 2.7 3.0 42 The enjoyment outweighs the stress of the course
2.1 1.8 1.6 1.9 1.8 1.5 1.8a
43 The atmosphere motivates me as a learner
2.8 2.8 2.4 3.1 2.3 2.4 2.6 50 The students irritate the teachers
3.1 3 3.1 3 2.8 3.1 3.0 Subscale score 32.7 33.2 32.1 34.9 29.4 30.1 S tu d en ts ’ S o ci al P er ce p ti o n
3 There is a good support system for students who
get stressed 2.4 2.6 1.9 2.3 2 1.9 2.2 4 I am too tired to enjoy the course
2.5 3 2.4 3 2.4 1.9 2.5 14 I am rarely bored on this course
2.1 2 2.4 2 2 1.3 2.0a
15 I have good friends on this course
3.3 3.4 3.1 3.2 3.3 3.4 3.3 19 My social life is good 2.6 3.3 2.9 3.4 3 2.1 2.9 28 I seldom feel lonely 2 2.6 2.1 2.3 2.3 2.2 2.3 46 My accommodation is pleasant
2.3 3 2 2.6 1.9 2.1 2.3 Subscale score 17.2 19.9 16.9 18.7 17 15.1
4.3 Subscores
4.3.1 Perception of learning. As shown in Tables 3 and 4, for year 1, the subscale score for ''perception of learning” was 34.9/48 (72.7%), and 35.9/48 (74.8%), 35.9/48 (74.8%), 35.5/48 (74%), 30.7/48 (64%), and 33.4/48 (69.6%) for years 2, 3, 4, 5, and 6 respectively, with an average of 34.4 (71.6%). For item 25 under perception of learning, (Table 2), “the teaching overemphasized factual learning” has the most negative response (mean score of 1.6) indicating dissatisfaction in this concept, with the lowest in year 2 (1.3) and highest positive response in year 3 (2.5).
Table 3. Comparism of subscale score and total DREEM scores Student’s perception Year 1 Year 2 Year 3 Year
4 Year 5 Year 6 All SPL 34.9 35.9 35.9 35.5 30.7 33.4 34.4 SPT 29.7 31.6 30.8 30.6 28.7 33.4 30.8 SAP 24.3 25 22.9 23.7 21.9 23.1 23.5 SPA 32.7 33.2 32.1 34.9 29.4 30.1 32.1 SSP 17.2 19.9 16.9 18.7 17 15.1 17.5
Total DREEM score 138.8 145.6 138.6 143.4 127.7 135.1 138.2
n 10 13 14 25 36 36
SPL, Students’ Perception of Learning: SPT, Students’ Perception of Teaching; SAP, Students’ Academic Self-Perception; SPA, Students’ Perception of Atmosphere; SSP, Students’ Social Perception
4.3.2 Perception of teaching. Subscale scores ranged from 28.7/44 (65.2%) to 33.4 (75.9%) and averaged 30.8 (70%). This shows similarities in the perception of all the levels about their teachers moving in the right direction. However, a mean score of 2.0 was seen for both items 6 and 18 for students in year 1 (Table 2) 4.3.3 Academic self-perception. From Table 3, all levels have a high academic perception with subscale scores ranging from 21.9/32 to 25.0/32. ASP had the highest subscale score of 23.5/32, i.e. 73.4% of maximum subscale score, with more students really positive for item 10, (“I am confident about passing this year”) with average item score of 3.6. The year 1 class however had a mean of 2.0 for items 5 and 27 (Table 2).
Table 4. Percentage subscale and total DREEM scores Student’s
perception
Year 1 Year 2 Year 3 Year 4 Year 5 Year 6 All
SPL 72.7 74.8 74.8 74 64 69.6 71.6 SPT 67.5 71.8 70 69.5 65.2 75.9 70.0 SAP 75.9 78.1 71.5 74.1 68.4 72.2 73.4 SPA 68.1 69.1 66.9 72.7 61.3 62.7 66.9 SSP 61.4 71.1 60.4 66.8 60.7 53.9 62.5 Total DREEM 69.4 72.8 69.3 71.7 63.9 67.6 69.1
SPL, Students’ Perception of Learning: SPT, Students’ Perception of Teaching; SAP, Students’ Academic Self-Perception; SPA, Students’ Perception of Atmosphere; SSP, Students’ Social Perception.
4.3.4 Perception of atmosphere. Overall subscale scores of 29.4 (year 5) to 34.9 (year 4) were seen as shown in Table 3. Though this reflects a more positive perception of the teaching atmosphere, two items were viewed negatively. “The course is well timetabled” has a below average (1.7) score, with the final year student expressing most dissatisfaction (mean score 1.0). Students also disagree that enjoyment outweighs the stress of the course (mean score of 1.8) with the final year student expressing the most dissatisfaction (mean score of 1.5). 4.3.5 Social self-perception. The Social Self Perception had the lowest subscale percentage (Table 4) for all classes (62.5%), year 6 having the lowest (53.9%) except in year 2 students were it is 71.1% of maximum score. The item “I am rarely bored on this course” had a mean score of 2.0 (Table 2), with year 6 recording the lowest (1.3).
5. Discussion
It can be seen from Table 1 that the distribution of students in the year levels 1 to 3 showed a sharp decline as compared to the upper three levels. This decline is as a result of the enforcement of the country’s regulatory body’s regulations on reduction of the number of students admitted into the course, to allow for a better facility to students ratio. However, the small numbers in these classes is not expected to affect the results as all the lectures in these lower classes are taken together with their medical counterparts.
According to our research this is the first study of students’ perceptions of the dental education environment in Nigeria using the DREEM inventory. Total DREEM scores were high across the study, indicating that students’ perceptions of learning environment were quite positive across the different levels of enrolment. The total DREEM score of 138.2 (69.1%) falls inside the range that indicates a “more positive than
negative” perception of the environment. It has been suggested that medical and dental schools offering traditional curricula generally tend to report lower total DREEM scores (Seabrook, 2004). This suggestion has however not been validated and the result of our study does not support the idea. Although the DREEM inventory has been extensively applied in medical schools, data on its application in a dental academic environment are scarce (Kossioni et al, 2011). A few studies done in other dental schools have yielded lower total DREEM scores than the present study (Ostapczuk et al, 2012; Thomas et al, 2009; Kossioni et al, 2011; Ali et al, 2012). This may show that this dental school, though using a traditional approach, is fairly innovative in its methods. The curriculum alone may therefore not be the sole determinant of students’ perception of learning environment. We believe that Faculty support and students' motivation to learn are factors that also influence the positive outcomes despite the traditional approach used in this school.
The positive perception of the learning environment was shared by students of all the different levels of enrolment as seen from the total DREEM score ranging from 127.7 to 145.6 and subscale scores between 62.5% and 73.4% of the maximum score. The year 5 class recorded the lowest total DREEM score (127.7). This may probably be due to the workload of the students at this level, which includes general medicine, pediatrics, laboratory medicine, and general surgery, all of which they will write exams on at the end of year 5.
Several DREEM items were identified as problem areas based on mean scores for individual items in specific year levels, and others across the 6 year levels. Items 6, 18, 5, and 27 in the year 1 class all had a mean item score of 2. Items 6 and 18 relates to attitudes of teachers. The reason for the low score will probably be that since the year 1 students have no contact with patients, they would not be able to give practical opinions about these two items. Item 12 had a mean score of 1.7 with lowest values of 1.1 and 1.0 in year 5 and 6 respectively. This is similar to results of two other studies on dental students using the DREEM questionnaire (Thomas et al, 2009; Ali et al, 2012). Avalos (2007) suggested that low scores for this item could be a reflection of the stressful situations seen with lectures and tight clinical schedule especially for the clinical students. It may also be a reflection of administrative resources or a lack of coordination between staff within the school office and the teachers.This is also reflected in the year 6 scores for items 3, 4, and 42. Similar perceptions were also noted in the final year dental students in an Indian dental school (Thomas et al, 2009). This may not be unrelated to the congested lecture schedule and clinical requirements of supervised patients treated needed by the students to qualify to sit for the final examination in the faculty. The tiredness (item 4), good support for students who get stressed (item 3), and the factual learning (item 25), and boredom (item 14), all of which had low scores could be related to the students reduced ability to memorize all they need (item 27). . Sofola and Jeboda (2006) in a study among Nigerian dental students identified lack of time for relaxation; amount of assigned work; and receiving criticism from supervisors, respectively as the three highest sources of stress as also indicated in a previous study in Greek dental students (Polychronopoulou & Divaris, 2005).
Figure 1. DREEM mean item scores ≤ 2
The score for item 14 found boredom to be a problem among the students. In this regard, the institution needs to support the students and create an environment that promotes healthy social interaction and extracurricular/leisure activities (Ali et al, 2012). Lastly; one item of concern was identified in the subscale of perception of learning. The teacher overemphasizes factual learning (item 25) had the lowest mean score for all the levels. This is one of the areas that have been identified as problems in medical schools with traditional curricula (Al-Hazimi et al, 2004).
Though established recently, the overall DREEM scores are encouraging, but with problem areas that require attention. There is however no such study conducted in any of the older dental schools in the country to compare results. Ali et al (2012), after comparing overall DREEM scores and overall performance in university examinations of different dental institutions in Pakistan, suggested that it may be possible to use DREEM scores to predict performance, i.e., higher DREEM scores may be predictive of better performance on examinations. 6. Conclusion
Even though our total DREEM score was in the more positive than negative category, it was still lower than a supposedly ‘excellent’ educational environment. Use of the DREEM as a regular monitoring tool would permit timely interventions to remediate problematic areas, which translates into improved student perceptions of the educational experience. Continuous quality improvement and innovation are essential in a medical school. For our dental school the problem areas centre on timetabling, emphasis on factual learning, boredom and stress. Formative assessment structure for students, attention to timetabling, improved administration, and systems to identify stressed students are key recommendations. The result of this study can be used as preliminary data for
Year 1 Year 2 Year 3 Year 4 Year 5 Year 6 Item
Mean The course is well
timetabled 1.4 1.5 2.5 2.9 1.1 1 1.7
The teaching over emphasizes factual
learning
1.5 1.3 2.5 1.4 1.4 1.4 1.6
The enjoyment outweighs
the stress of the course 2.1 1.8 1.6 1.9 1.8 1.5 1.8
I am rarely bored on this
course 2.1 2 2.4 2 2 1.3 2 0 0.5 1 1.5 2 2.5 3 3.5 A v e rag e I te m s c o re
future comparative studies. References
Al-Hazimi, A., Zaini, R., Al-Hyiani, A., Hassan, N., Gunaid, A., Ponnamperuma, G. et al. (2004). Educational environment in traditional and innovative medical schools: A study in four undergraduate medical schools. Education and Health, 17(2): 192-203.
Ali, K., Raja, M., Watson, G., Coombes, L. & Heffernan, E. (2012). The Dental School Learning Milieu: Students’ Perceptions at Five Academic Dental Institutions in Pakistan. Journal of Dental Education, 76(4): 487-494.
Audin, K., Davy, J. & Barkham, M. (2003). University Quality of Life and Learning (UNIQoLL): an approach to student wellbeing, satisfaction and institutional change. Journal of Further & Higher Education, 27(4): 365-382. Avalos, G. (2007). Determining the quality of the Medical Educational Environment at an Irish Medical School using the DREEM inventory. Irish Medical Journal, 100(7): 522-525.
Bassaw, B., Roff, S., McAleer, S., Roopnarinesingh, S., De Lisle, J., Teelucksingh, S. et al. (2003). Students’ perspectives on the educational environment, Faculty of Medical Sciences, Trinidad. Medical Teacher, 25: 522-526.
Denz-Penhey, H. & Murdoch, C. (2009). A comparison between findings from the DREEM questionnaire and that from qualitative reviews. Medical Teacher, 31: 449-453.
Edgren, G., Haffling, A., Jakobsson, U., McAleer, S. & Danielsen N. (2010). Comparing the educational environment (as measured by the DREEM) at two different stages of curriculum reform. Medical Teacher, 32: e233–238.
Genn, J.M. & Harden, R.M. (1986). What is medical education here really like? Suggestions for action research studies of climates of medical education environments. Medical Teacher, 8: 111–124.
Genn, J.M. (2001). AMEE Medical Education Guide No 23 (Part 1): curriculum environment, climate, quality and change in medical education—a unifying perspective. Medical Teacher, 23: 337-344.
Genn, J.M. (2001). AMEE Medical Education Guide No. 23 (Part 2): Curriculum, environment, climate, quality and change in medical education – a unifying perspective. Medical Teacher, 23(5): 445-454.
Getulio, L.R., de Oliveira, F., Joaquim, E.V. & Leonardo, S. (2005). Psychometric properties of the Dundee Ready Educational Environment Measure (DREEM) applied to medical residents. Medical Teacher, 27: 343-347. Jiffry, M.T.T., McAleer, S., Fernando, S. & Marasinghe, R.B. (2005). Using the DREEM questionnaire to gather baseline information on an evolving medical school in Sri Lanka. Medical Teacher, 27(4): 348-352.
Kossioni, A.E., Varela, R., Ekonomu, I., Lyrakos, G. & Dimoliatis, I.D.K. (2011). Students’ perceptions of the educational environment in a Greek dental school, as measured by DREEM. European Journal of Dental Education, 15: 1-6.
McAleer, S. & Roff, S. (2002). Part 3: A practical guide to using the Dundee Ready Education Environment Measure (DREEM). AMEE Education Guide No 23, Curriculum, environment, climate, quality and change in medical education: a unifying perspective, J.M. GENN (Ed.) (Dundee, UK: Association of Medical Education in Europe).
Miles, S. & Leinster, S. (2009). Comparing staff and student perceptions of the student experience at a new medical school. Medical Teacher, 31: 539–546.
Ostapczuk, M.S., Hugger, A., de Bruin, J., Ritz-Timme, S. & Rotthoff, T. (2012). DREEM on, dentists! Students’ perceptions of the educational environment in a German dental school as measured by the Dundee Ready Education Environment Measure, European Journal of Dental Education, 16: 67-77.
Polychronopoulou, A. & Divaris, K. (2005). Perceived sources of stress among Greek dental students. Journal of Dental Education, 69: 687-692.
Roff, S., McAleer, S., Harden, R.M., Al-Qahtani M., Ahmed A.U., Deza H. et al. (1997). Development and validation of the Dundee Ready Education Environment Measure (DREEM). Medical Teacher, 19(4): 295-299. Roff, S. & McAleer, S. (2001). What is educational climate? Medical Teacher, 23(4): 333-334.
Roff, S. (2005). The Dundee Ready Educational Environment Measure (DREEM) – a generic instrument for measuring students’ perceptions of undergraduate health professions curricula. Medical Teacher, 27: 322–325. Salvatori, P. (1999). Meaningful occupations for occupational therapy students: a student-centered curriculum. Occupational Therapy Int, 6: 207-223.
Seabrook, M.A. (2004). Clinical students’ initial reports of the educational climate in a single medical school. Medical Education, 38: 659–669.
Sobral, D.T. (2004). Medical students’ self -appraisal of first year learning outcomes: use of the course-valuing inventory. Medical Teacher, 26(3): 234-238.
Sofola, O.O. & Jeboda, S.O. (2006). Perceived sources of stress in Nigerian dental students, European Journal of Dental Education, 10: 20-23.
educational environment in an Indian dental school. Medical Teacher, 31: e185–e188.
Till, H. (2005). Climate studies: can students’ perceptions of the ideal educational environment be of use for institutional planning and resource utilization? Medical Teacher, 27: 332-337.
Whittle, S., Whelan, B. & Murdoch-Eaton, D.G. (2007). DREEM and beyond; studies of the educational environment as a means for its enhancement. Education and Health, 20(1):7.
Zamzuri, A.T., Azli, N.A., Roff, S. & McAleer, S. (2004). Students’ perceptions of the educational environment at dental training college, Malaysia. Malaysia Dental Journal, 25: 15-26.