COMBINED MICROWAVE - CONVECTION DRYING
AND TEXTURAL CHARACTERISTICS OF BEEF
JERKY
A Thesis Submitted to the
College of Graduate Studies and Research In Partial Fulfillment of the Requirements for the
Degree of Master of Science in the
Department of Agricultural and Bioresource Engineering University of Saskatchewan
Saskatoon, SK
By
PERMISSION TO USE
In presenting this thesis in partial fulfillment of the requirements for a degree of Master of Science from the University of Saskatchewan, I agree that the libraries of this University may make it freely available for inspection. I further agree that permission for copying this thesis in any manner, in whole or in part for scholarly purposes may be granted by the professor who supervised my thesis work or, in his absence, by the head of the Department or the Dean of the college in which my thesis work was done. Copying or publication or use of this thesis or parts thereof for financial gain without my written permission is prohibited. It is understood that due recognition shall be given to me and to the University of Saskatchewan for any scholarly use of material contained in this thesis.
Requests for permission to copy or to make other use of material in this thesis in whole or in part should be addressed to:
Head of the Department of Agricultural and Bioresource Engineering University of Saskatchewan
57 Campus Drive Saskatoon, SK Canada S7N 5A9
ABSTRACT
Beef jerky is a dried meat snack which is rich in protein but of low calorific value. This ready-to- eat meat snack is in high demand among hikers, bikers and travelers due to its compact nature and nutritional value. The current processing methods such as smoke house and home dehydrators take 6-10 h. Increasing market for this shelf-stable meat product increases the need for alternate efficient processing method. Also, this meat snack market depends on its textural characteristics which denote the consumer acceptability. In this research, three different methods of drying beef jerky were examined.
Influences of pH and salt on different characteristics of beef jerky were investigated using combined microwave-convection drying. Also, the effects of relative humidity and airflow rates in forced air thin layer drying on jerky processing were studied. Samples of beef jerky dried using a combined microwave-convection drier and thin layer drying unit were compared with samples dried in a smoke house.
The results obtained showed that pH and salt content had a significant influence on drying, physical and textural characteristics of jerky. It was found that samples with low pH (5.15) and high salt content (3.28% (w/w)) dried faster than samples with high pH and low salt content due to their high drying rates. These samples had shown high shrinkage and weight loss compared to samples with pH 5.65 and 1.28% (w/w) salt content. Analysis of the textural characteristics such as tensile force, puncture force and texture profile showed that the samples with high pH and low salt content were comparably softer than the rest of the samples. Results of the effect of relative humidity and airflow rate in forced air thin layer drying on jerky processing showed that relative humidity and airflow rate influenced the drying, physical, chemical and textural characteristics of beef jerky. Combination of low relative humidity and high airflow rate showed desirable drying characteristics. However, samples dried at this combination showed high shrinkage and weight loss. The hardness of the beef jerky increased with increase in airflow rate and reduction in relative humidity.
A comparison of the drying methods revealed that different drying methods produced different desirable properties. Combined microwave-convection drying was found to be efficient and very rapid (8.25 min). The low shrinkage and weight losses along with high drying rate obtained using this method would pave a way to fast and efficient processing. The color and textural characteristics were different from those of samples dried in a smoke house. Surprisingly, combined microwave-convection drying method produced softer beef jerky than thin layer and smokehouse methods. However, the commercially available jerky is tougher than the one dried using combined microwave-convection drying. The samples dried in a thin layer drier had comparable color and textural characteristics with samples dried in a smoke-house. Also, forced-air thin layer drying method reduced drying time of beef jerky from 7 to 3 h. The forced forced-air thin layer drier has the potential to produce beef jerky with similar color and textural characteristics to commercially available smoke house dried samples.
ACKNOWLEDGEMENTS
I thank the Almighty God, without whose grace this work would have been impossible. I praise him through this humble piece of work.
I would like to express my sincere gratitude to my supervisor Dr. Venkatesh Meda for his guidance, support and patience.
I am grateful to Dr. Terry Fonstad, my graduate advisory committee chair, and Dr. Phyllis Shand and Dr. Oon-Doo Baik, my graduate advisory committee members, and the external examiner Dr. Ike Oguocha, for their expert guidance and support. I would like to specially thank Dr. Shand for her constructive ideas and feedback comments in developing the final version of my thesis. I would like to acknowledge Mr. Neil Weibe from the Department of Food and Bioproduct Sciences for his technical assistance in sample preparation. My sincere thanks go to Dr. Satya Panigrahi, Mr. Sabyasachi Mishra and Mr. Anthony Opoku for their suggestions and technical advices.
I am grateful to the University of Saskatchewan and the Department of Agricultural and Bioresource Engineering for providing me this wonderful opportunity to pursue my master’s degree. Also, I would like to thank Natural Sciences and Engineering Research Council of Canada for funding.
I have no words to express my gratitude to my parents, my sister, brother and brother-in-law for their constant moral support, encouragement and love. I am also grateful to my friend, Princy, for her motivation and moral support.
I would also like to thank my co-graduate students of the Department of Agricultural and Bioresource Engineering and other friends who made my stay in Saskatoon a memorable experience.
DEDICATED TO
MY BELOVED FAMILY
TABLE OF CONTENTS
PERMISSION TO USE --- i ABSTRACT--- ii ACKNOWLEDGEMENTS --- iv DEDICATION --- v TABLE OF CONTENTS--- vi LIST OF TABLES --- ix LIST OF FIGURES --- xi NOMENCLATURE--- xiv CHAPTER I - INTRODUCTION--- 1 1.1 Overview --- 1 1.2 Objectives--- 3CHAPTER II – LITERATURE REVIEW --- 4
2.1. Beef Jerky--- 4
2.1.1. History of jerky --- 4
2.1.2. Food safety concerns of beef jerky--- 5
2.1.3. Product development--- 6
2.2. Meat Preservation Methods --- 7
2.2.1. Drying and dehydration--- 7
2.2.2. Salting--- --- 8
2.2.3. pH --- 8
2.3 Drying Methods --- 9
2.3.1. Thin layer drying --- 9
2.3.2. Microwave drying ---10 2.3.3. Freeze drying---12 2.3.4. Smokehouse drying ---14 2.4. Dielectric Properties---14 2.5. Water Activity---15 2.6. Textural Characteristics---17
2.6.1. Factors affecting texture ---17
2.6.2. Texture measurement methods ---19
2.7. Summary---19
CHAPTER III – MATERIALS AND METHODS ---21
3.1. Materials ---21
3.1.3. Equipment used for drying experiements ---22
3.1.4. Equipment used for characteristics study---22
3.2. Experiment Conducted to Study the Effect of pH and Airflow Rate in Combined Microwave-Convection Drying of Beef Jerky ---23
3.2.1 Experimental design ---23
3.2.2 Sample preparation---25
3.2.3 Combined microwave-convection drying---26
3.3. Experiment Conducted to Investigate the Effect of Relative Humidity and Airflow Rate in Thin-Layer Drying of Beef Jerky ---27
3.3.1 Sample preparation---27
3.3.2 Forced-air thin-layer drying---27
3.4. Smoke House Drying Experiment---28
3.4.1 Sample preparation---28
3.4.2 Smoke house drying ---28
3.5. Drying Characteristics ---30
3.6. End Quality Analysis: Physical-chemical Characteristics Measurement---31
3.6.1. Moisture content measurement ---31
3.6.2 Water activity measurement---31
3.6.3. Shrinkage measurement ---31
3.6.4. pH measurement ---32
3.6.5. Color measurement---32
3.7. End Quality Analysis: Textural Characteristics Measurement---33
3.7.1. Texture profile analysis---33
3.7.2. Puncture properties measurement ---35
3.7.3. Tensile properties measurement ---35
3.8 Statistical Analysis ---36
CHAPTER IV – RESULTS AND DISCUSSION ---38
4.1. Effect of pH and Salt Content on Hybrid Microwave-Convection Drying---38
4.1.1. Initial moisture content ---38
4.1.2. Drying characteristics ---39 4.1.3. Product temperature ---49 4.1.4. Physical-chemical characteristics ---54 4.1.5. Color parameters---56 4.1.6. Textural characteristics ---58 4.1.7. Summary---64
4.2. Effect of Relative Humidity and Airflow Rate on Thin Layer Drying ---65
4.2.1. Drying characteristics ---65
4.2.2. Physical-chemical characteristics ---70
4.2.3. Color parameters---72
4.2.4. Textural characteristics ---73
4.2.5. Summary---76
4.3. Smoke House Drying---77
4.3.1. Drying characteristics ---77
4.3.3. Color parameters---79
4.3.4. Textural characteristics--- ---79
4.4. Comparison of Drying Methods --- --81
CHAPTER V – SUMMARY AND CONCLUSIONS ---85
5.1. Summary --- 85
5.2. Conclusions--- 86
CHAPTER VI – RECOMMENDATIONS FOR FUTURE WORK--- 88
REFERENCES---89
APPENDICES--- 97
APPENDIX A. Nutritional values of commercially avaiable beef jerky--- 97
APPENDIX B1. Drying curves of beef jerky samples dried under combined microwave-convection drying --- 98
APPENDIX B2. Drying curves of beef jerky samples dried using thin layer drying method---103
APPENDIX C. Statistical results of curve fitted data of beef jerky dried in combined microwave-convection drying --- 105
LIST OF TABLES
Table 2.1 Biological hazards and controls--- 6
Table 3.1 Treatment combinations--- 23
Table 3.2 Formulations of beef jerky samples with different treatments--- 25
Table 3.3 Specifications of Panasonic NNC 980 W-microwave oven--- 26
Table 3.4 Process cycles used for smokehouse processing--- 30
Table 3.5 Drying models --- 30
Table 3.6 Summary ANOVA table representing a randomized complete block design.--- 37
Table 4.1 Initial wet basis moisture contents of the jerky samples prior to drying with different pH and salt content levels--- 39
Table 4.2 Effect of pH and salt content on drying characteristics of beef jerky dried under combined microwave-convection drying--- 40
Table 4.3 Drying equations of different treatment samples dried under combined microwave-convection drying--- 43
Table 4.4 Physical-chemical characteristics of beef jerky dried under combined microwave-convection drying--- 54
Table 4.5 CIE color parameter of beef jerky samples dried under combined microwave-convection drying method--- 57
Table 4.6 Puncture properties of beef jerky samples dried under combined microwave-convection drying--- 58
Table 4.7 Tensile properties of beef jerky samples dried under hybrid microwave-convection drying--- 60
Table 4.8 Texture profile analysis results of beef jerky samples dried under combine microwave-convection drying(1)--- 62
Table 4.9 Texture profile analysis results of beef jerky samples dried under combine microwave-convection drying(2)--- 63
Table 4.10 Drying characteristics of beef jerky samples dried under forced-air thin layer drying unit--- 66
Table 4.11 Drying constants and models of beef jerky samples dried using
thin-layer drying method--- 66 Table 4.12 Physical-chemical properties of beef jerky samples dried under
forced-air thin layer dryer--- 71 Table 4.13 Color parameters of beef jerky samples dried using forced-air thin layer
dryer--- 72 Table 4.14 Puncture properties of beef jerky samples dried using forced-air thin
layer dryer--- 73 Table 4.15 Tensile properties of beef jerky samples dried in thin layer dryer--- 74 Table 4.16 Texture profile analysis results of beef jerky samples dried in forced-air
thin layer drying unit(1)--- 75 Table 4.17 Texture profile analysis results of beef jerky samples dried in forced-air
thin layer drying unit (2)--- 75 Table 4.18 Drying characteristics of beef jerky samples prepared under
smokehouse processing--- 78 Table 4.19 Physical-chemical characteristics of beef jerky processed in a
smokehouse--- 79 Table 4.20 Color parameters of beef jerky samples processed in smoke housing--- 79 Table 4.21 Puncture properties of beef jerky samples processed in a smoke-house--- 80 Table 4.22 Tensile properties of beef jerky samples processed in a smoke-house---- 80 Table 4.23 Texture profile analysis results of beef jerky samples processed in
smoke-house--- 80 Table 4.24 Processing cycle used in smoke house processing--- 81 Table 4.25 Different characteristics of beef jerky processed under different drying
methods--- 82 Table A1 Nutritional value of restructured beef jerky (100 g)--- 97 Table C1 Statistical results of curve fitted data of beef jerky dried in combined
LIST OF FIGURES
Figure 2.1 Breakage of bonds of water molecules in microwave field--- 11
Figure 2.2 Phase diagram of water--- 13
Figure 2.3 Deterioration rates as a function of water activity--- 16
Figure 2.4 Relationship between water activity and moisture content--- 17
Figure 3.1 Flow chart indicating various stages of beef jerky preparation, drying and end product quality analysis --- 24
Figure 3.2 Schematic diagram of the thin layer cross-flow drying system--- 27
Figure 3.3 Batch smoke oven --- 29
Figure 3.4 Airflow system of the small batch oven --- 29
Figure 3.5 Texture analyser TA.XT2 --- 33
Figure 3.6 Texture Profile Analysis calculation for texture expert software --- 34
Figure 3.7 Picture of the puncture test apparatus --- 35
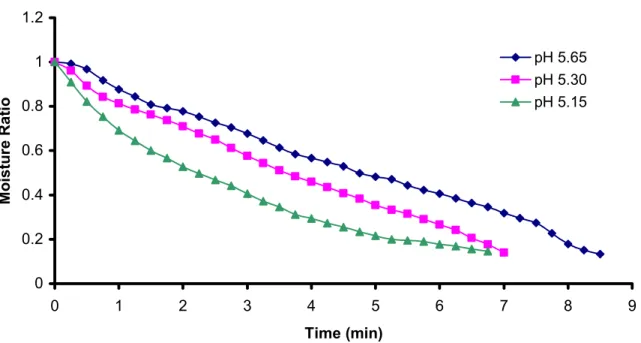
Figure 4.1 Drying curves of jerky samples having 1.28% salt with 5.65, 5.30 and pH 5.15 levels dried in combined microwave-convection drying--- 44
Figure 4.2 Drying curves of jerky samples dried in combined microwave-convection drying showing the effect of pH at 2.28% salt --- 45
Figure 4.3 Drying curves of jerky samples dried in combined microwave-convection drying showing the effect of pH at 3.28% salt --- 45
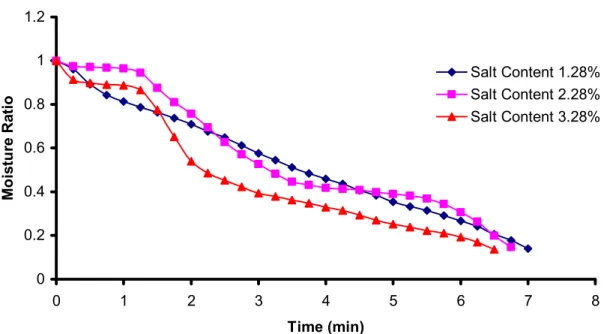
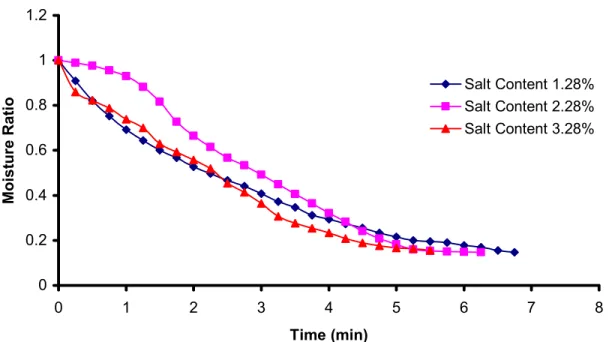
Figure 4.4 Drying curves of samples dried in combined microwave-convective drying mode, showing the effect of salt content at pH 5.65 --- 46
Figure 4.5 Drying curves of samples dried in combined microwave-convective drying mode, showing the effect of salt content at pH 5.30 --- 47
Figure 4.6 Drying curves of samples dried in combined microwave-convective drying mode, showing the effect of salt content at pH 5.15 --- 48
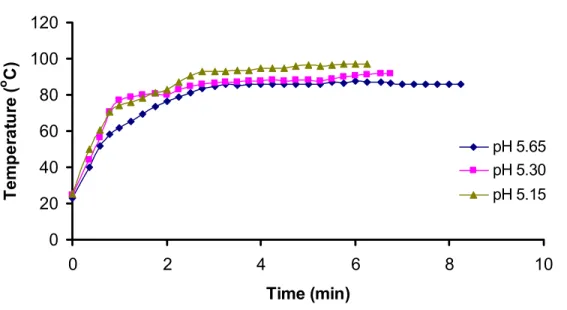
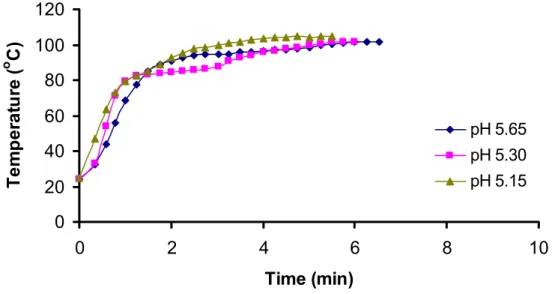
Figure 4.7 Effect of pH on product temperature of beef jerky samples with 1.28% salt content dried in combined microwave-convection drying --- 49
Figure 4.8 Effect of pH on product temperature of beef jerky samples with 2.28% salt content dried in combined microwave-convection drying --- 50
Figure 4.9 Effect of pH on product temperature of beef jerky samples with 3.28% salt content dried in combined microwave-convection drying --- 51 Figure 4.10 Effect of salt content on product temperature of beef jerky samples dried
in combined microwave-convection drying at pH 5.65 --- 52 Figure 4.11 Effect of salt content on product temperature of beef jerky samples dried
in combined microwave-convection drying at pH 5.30 --- 53 Figure 4.12 Effect of salt content on product temperature of beef jerky samples dried
in combined microwave-convection drying at pH 5.15 --- 53 Figure 4.13 Drying curves of beef jerky dried in thin layer convection dryer showing
the effect of relative humidity at the air flow rate of 1.00m/s --- 67 Figure 4.14 Drying curves of beef jerky dried in thin layer convection dryer showing
the effect of relative humidity at the air flow rate of 1.45m/s --- 68 Figure 4.15 Drying curves of beef jerky dried in thin layer convection dryer showing
the effect of airflow rate at the relative humidity of 40% --- 69 Figure 4.16 Drying curves of beef jerky dried in thin layer convection dryer showing
the effect of airflow rate at the relative humidity of 15% --- 70 Figure 4.17 Drying curve of beef jerky processed in smokehouse --- 78 Figure B1 Drying curve of the jerky sample having pH 5.65 and 1.28% (w/w) salt
content dried in combined microwave-convection drying.--- 98 Figure B2 Drying curve of the jerky sample having pH 5.30 and 1.28% (w/w) salt
content dried in combined microwave-convection drying--- 98 Figure B3 Drying curve of the jerky sample having pH 5.15 and 1.28% (w/w) salt
content dried in combined microwave-convection drying--- 99 Figure B4 Drying curve of the jerky sample having pH 5.65 and 2.28% (w/w) salt
content dried in combined microwave-convection drying--- 99 Figure B5 Drying curve of the jerky sample having pH 5.30 and 2.28% (w/w) salt
content dried in combined microwave-convection drying--- 100 Figure B6 Drying curve of the jerky sample having pH 5.15 and 2.28% (w/w) salt
content dried in combined microwave-convection drying--- 100 Figure B7 Drying curve of the jerky sample having pH 5.65 and 3.28% (w/w) salt
content dried in combined microwave-convection drying--- 101 Figure B8 Drying curve of the jerky sample having pH 5.30 and 3.28% (w/w) salt 101
Figure B9 Drying curve of the jerky sample having pH 5.15 and 3.28% salt content dried in combined microwave-convection drying--- 102 Figure B10 Drying curve of beef jerky dried in thin layer drying unit with 40%
relative humidity and 1 m/s air flow rate--- 103 Figure B11 Drying curve of beef jerky dried in 15% relative humidity and 1 m/s air
flow rate--- 103 Figure B12 Drying curve of beef jerky dried in 40% relative humidity and 1.45 m/s
air flow rate--- 104 Figure B13 Drying curve of beef jerky dried in 15% relative humidity and 1.45 m/s
air flow rate--- 104
NOMENCLATURE
εr Complex permittivity
ε′ Dielectric constant
ε″ Dielectric loss factor
MR Moisture ratio
MC (wb) Percentage wet-basis moisture content (Kg of water per kg of material)
MC (db) Decimal dry-basis moisture content (kg of water per kg of dry matter)
K Drying constant (min-1 or h-1) n Exponential part of drying constant
L* Lightness value a* Redness/greenness value b* Yellowness/blueness value ∆E Color index aw Water activity RH Relative humidity (%) pKa Acid dissociation constant
H+ Hydrogen ion
pH Potential of hydration
SD Standard deviation
CV Coefficient of Variation
CIE A color standard
CHAPTER I
INTRODUCTION
1.1. Overview
The North American meat snack industry is comprised of jerky, meat sticks, and other meat and cheese snacks. Beef is one of the main ingredients in majority of the meat snacks. Over 80% of the meat snack market is beef based. Since 1997, the market for meat snacks has grown 14% (Bosse and Boland, 2008). Mintel International Inc. (2007) reported that the market for meat snack in the United States increased from 2001 to 2006 and it reached $3.2 billions in 2006. The reported growth in the market of meat snacks is due to their low carbohydrate, fat content and diverse flavor selection (Bosse and Boland, 2008). He also reported that jerky has an estimated sale of 44% among meat snacks. Jerky is a well known meat snack which is rich in protein content.
The name jerky was derived from the Spanish word ‘Charque’, meaning dried meat. Jerky is made by slicing the meat into strips and drying (whole meat jerky) or by grinding the meat and drying (restructured jerky). The processing of jerky involves salting and drying to improve its shelf life. The high protein content, low fat content and low calorific value of this dried meat product made it popular in the consumer market. It is liked by a wide range of consumer groups such as hikers, bikers and travelers because of its compact nature and nutrients.
Due to recent food poisoning outbreaks, the processing procedures for jerky has been regularized by the United States Department of Agriculture (USDA). The present recommendation is that a jerky having moisture-to-protein ratio of 0.75:1 and water activity of not more than 0.85, is safe. These values inhibit the growth of pathogens and assure product safety. Also, it is recommended that the product temperature should reach 71°C during processing (USDA, 2003).
Although jerky is in high demand in the market, no effort has been taken to optimize its process conditions. Commonly reported methods in practice for jerky processing include drying in a smoke house and home dehydration. The American Association of Meat Processors (2004) reported that this traditional method takes 6-10 h at 60ºC. Reducing the processing time would certainly lead to the reduction in the product cost and increase efficiency. It is essential to have a good understanding of the processing behavior in order to optimize the process.
It is reported for several other food products that it is 75% more energy efficient to utilize electromagnetic energy for the drying process (Quenzer and Burns, 1981). In the meat industry, microwaves are currently employed to pasteurize poultry meat. There are advantages in using microwave energy over conventional types in terms of energy savings, reduced processing time, enhanced quality attributes and cost effectiveness. It was reported by Cunningham (1980) that meat treated with microwave energy for less than 20 s showed no drastic change in appearance. The application of new innovative, energy efficient technology has not been experimented for jerky processing yet. To the best of the author’s knowledge, there is no single study reported on systematic drying of beef jerky or dried beef products.
In this present study, an attempt was made to explore different drying methods for jerky processing. Also, the effects of different product formulations on its processing behavior were investigated.
1.2. Objectives
The objectives of this study were:
1. To investigate the effect of pH and salt content in a combined microwave-convection drying of beef jerky.
2. To explore the effect of air-flow rate and relative humidity in forced air thin layer drying environment of beef jerky.
3. To compare beef jerky processing under combination of microwave and convection, thin layer cross- flow and smoke-house drying methods.
CHAPTER II
LITERATURE REVIEW
In this chapter, the current jerky processing methods and product quality parameters are reviewed briefly.
2.1. Beef Jerky
2.1.1. History of jerky
Jerky is a nutritious, dense and shelf-stable form of preserved meat which is traditionally prepared by slicing the whole meat into long, thin strips which are then dried. The word “jerky” was derived from the Spanish word “charque” which means dried meat (AAMP, 2004). It was found that jerky has been a part of the human diet since ancient Egypt (FSIS, 2000). It was used as a major staple food in emergency rations and for travellers where fresh meat was not available. Pemmicans have been prepared by combining the dried meat with dried fruits or animal fat by the American Indians. It is reported in the literature that pemmican was the food that enabled Alexander Mackenzie to cross the North American continent in 1793 (AAMP, 2004).
Jerky’s high protein content and popularity have increased the dried meat snack market to $250 million in 2004 (AAMP, 2004). Branded jerky costs around $35 per pound (AAMP, 2004). Jerky is prepared by drying thin strips of lean meat to about one-half of its original weight. It can be made from any form of meat; sliced or ground meat. The former one is called whole muscle jerky, while latter is called the re-structured or formed jerky.
2.1.2. Food safety concerns of beef jerky
Several outbreaks of microbial infections called for a revision of food safety measures and processing procedures for jerky. Several studies have been conducted since the past two decades to control pathogens such as Escherichia coli O157:H7, Listeria monocytogenes and Salmonella (Yoon et al., 2005; Calicioglu et al., 2002; 2003). It was reported that the product needs to be heated prior to drying and addition of sodium nitrite to the formulation improved the rate of destruction of pathogenic microorganisms (AAMP, 2004). The United State Department of Agriculture strongly recommends that the meat should be heated to 71°C before drying (USDA, 2003).
Eidson et al. (2000) reported six Salmonella and two Staphylococcus aureus food-borne illness outbreaks in beef jerky in New Mexico between 1966 and 1995. Food-borne illness outbreaks associated with beef jerky consumption due to Escherichia coli O157:H7 in venison jerky (Keene et al., 1997) and Salmonella (USDA/FSIS, 2003) have also been reported. Another study carried out by Levine et al. (2001) concluded that between 1990 and 1999 there were 0.31% and 0.52% of cumulative occurrence of Salmonella and Listeria monocytogenes in the jerky produced by federally inspected plants. Therefore, there is a strong need to evaluate the present drying and processing procedures to make safer jerky (Yoon et al., 2005; Archuleta, 2004). In the past ten years, several researches have been carried out to rectify the above mentioned issues and assure food safety. Harrisons and Ruth Ann Rose (1998) reported that ground beef jerky prepared with curing mix salt and sodium nitrate showed greater percentage of bacterial destruction than the one prepared without curing mix. Another study done by Quixton (1997) concluded that high acid content achieved by varying the pH of the jerky formulation with vegetables and meat proteins have resulted in better shelf stability than the normal one.
After an extensive review of the microbial control in intermediate moisture foods, the United States Department of Agriculture (USDA) revised the standards for this shelf staple food product, which is found in Food Standards and Labelling Policy Book (USDA, 2003). The new standards recommend having at least moisture to protein ratio of ≤ 0.75:1 and water activity of not more than 0.85 to ensure product safety. Indeed, any meat product with a water activity (aw)
of less than 0.85 is commonly considered as ‘shelf stable’ as this value indicates the measure for controlling Staphylococcus aureus. However, the Food Safety and Inspection Service-Meat and Poultry Compliance Guidelines (2004) suggested that critical water activity limit for jerky, which is in contact with air, be ≤ 0.70, as mold growth is arrested at this water activity level. Different biological hazards with their controls are shown in Table 2.1 (AAMP, 2004).
Table 2.1. Biological hazards and controls (adapted from AAMP (2004)).
Microbial Hazard Minimum aw Temperature (°C) (log10 reduction) Minimum pH Campylobacter NA 71.2°C (Meat) 82.3°C (Poultry) 4.0 Clostridiumperfringens 0.93 60°C 5.0
E. coli O157:H7 0.95 70°C (for 2 mins) 4.4
(O157:H7 is reported to be acid resistant surviving at pH
values below 4.4)
Listeria monocytogenes 0.92 70°C (for 2 mins)
107 log reduction 4.39
Salmonella 0.94 70°C (instant)
107 log reduction 3.8
Staphylococcus aureus 0.85 60°C 4.0
2.1.3. Product development
Increasing demand for jerky among women and children has accelerated research in new product development. Studies have been conducted to look for an alternative non-meat source for protein. Ray (1996) tried 2:3 ratio of potato flour with meat to make jerky and reported that this product had a significant nutritional advantage due to its high carbohydrate and protein content. Another attempt by Quixton et al. (1997) to prepare softer jerky by incorporating 50% (w/w)
2.2. Meat Preservation
Meat, being one of the essential sources of protein and a wide variety of other nutrients, has been consumed by humans as a major food since the prehistoric era. However, as the consumption rate and the production of meat grow invariably with time, the nature of the product requires that it be preserved for future use. The high water content of meat makes it extremely perishable. Food preservation is employed to prevent undesirable changes in the nutritive value and sensory quality of food by controlling the growth of micro-organisms and reducing the physical, chemical and microbiological changes, which in turn improve the economic value of the product. Military and exploratory efforts have always had a strong influence on preservation technology because they have depended on a reliable and continuous food supply for success. Improved transportation allowed better distribution. A variety of methods are used in combination to produce the greatest preservation while keeping quality high. The effectiveness of a preservation method is somewhat like a balancing act. It must be used to a degree that achieves the preservation desired, yet does not adversely alter the appearance or quality of the food (Cassens, 1994). There have been enormous advancements in meat preservation with the result of making available high quality and safe meat and meat products.
Although there are a variety of physical, chemical and biological means of preserving meat, a few major preservation methods are discussed in the following subsections.
2.2.1. Drying and dehydration
In general, drying is the lowering of water activity of a perishable product accomplished by removing water, where micro-organisms would not be able to get sufficient water for survival. It is a complex operation involving transient heat and mass transfer along with physical transformations such as shrinkage, puffing, crystallization or glass transition and chemical or biochemical reactions which cause changes in color, texture, odor etc. (Mujumdar and Devahastin, 2000). On the whole, it affects the final quality of the end product. So, the selection criteria for drying methods relies on the type of the product to be dried, desired final product quality, the product’s susceptibility to heat and the operation cost (Cohen and Yang, 1995).
Drying is the oldest method of food preservation, as it is known that drying and salting were practiced in the Nile valley by early societies (Cassens, 1994). The most desirable advantages of drying are the low storage space, low transportation cost, simple operative method and low cost. It was reported by Humphrey (2002) that the protein content of dried meat is higher than the fresh one.
Drying at a very high temperature results in an improperly dried product due to the case hardening phenomenon of food materials. Temperature and relative humidity of the air affect the equilibrium moisture content and the composition of the surface. Moisture transfer from the surface of the meat product to the surroundings depends on its water content and composition. Nevertheless, temperature and relative humidity of the environment and characteristics of boundary layer are also important (Simal et al., 2003).
2.2.2. Salting
As salt is an effective inhibitor of microorganisms, salting of foods has been used as a preservation method for a long time. It is known that salt binds with water molecules and thus acts as a dehydrating agent in foods. A high level of salinity may impair the conditions under which pathogens can survive. Salt that is added during processing has an influence in changing the ability of lean meat to retain water (Ranken, 2000). Water holding capacity can be enhanced by the addition of the salts of strong acids such as sodium chloride (Gerrard, 1935). The more strong ions are bound by the protein, the stronger will be the hydrating effect (Hamm, 1957). At high pressures, water behaves similar to solutions with increasing salt content in that the water activity apparently decreases with increased pressure (Koop et al., 2000). Salting reduces the water activity of the food product (Henning, 2004). Salt interacts with water through ionic and dipolar bonds, and thus reduces the water available for the growth of microorganisms.
2.2.3. pH
main factors in controlling the microbial stability of food products that are acidified or fermented. The minimum pH required to destroy the major hazardous micro-organisms are tabulated in Table 2.1. A study by Unklesbay et al. (1999) showed a significant effect of pH in beef jerky samples cooked in a smoke house, where the pH of the samples was altered by using citric acid. At a low pH, the myofibrillar proteins denature, allowing the water molecules to evaporate freely. At the isoelectric point of meat protein, the water holding capacity is minimum (Cassens, 1994). According to Cassens (1994), at the pH range of 5.1 to 5.0, the positive and negative ions were almost equal resulting in the most compact physical structure in which water molecules can reside or be immobilized.
2.3. Drying Methods
This section deals with different drying methods commonly used in the agri-food industry. There are varieties of different drying methods available to develop new products.
2.3.1. Thin-layer drying
In this method of drying, sensible heat of heated air is transferred to the wet products by convection. Heated air is ventilated through the thin layer of wet material and carries with it the water vapor evaporated from the material. Airflow rate influences convective mass transport (Hamdy and Barre, 1969). A number of researchers have chosen to neglect the effect of air-flow rates in the analysis of thin layer drying data, citing the conclusion of Henderson and Pabis (1962) that resistance to moisture at the surface is negligible compared to the internal resistance. The humidity of drying air has a significant impact on the final or equilibrium moisture content that is achieved as a result of drying. In addition, the driving force for convective transport at the surface of the drying material depends on the difference between the partial pressure of water vapor at the surface and that of the drying air (Fortes and Okos, 1981). The effect of temperature on drying of different agricultural materials is well documented in the literature (Henderson and Pabis, 1961). Most of the material properties that are relevant to drying, for example, mass diffusivity, thermal conductivity and latent heat of evaporation, are temperature dependent (Singh et al., 1972). There are several works done to evaluate the drying model for different
plant based products in a thin layer dryer. Researchers have developed numerous thin layer models for various agricultural products. Generally these models are based on thin layer data characterizing the change in drying constant and moisture diffusivity under constant drying conditions (Babalis et al., 2005). There is no literature on thin layer cross flow drying or any other drying methods of meat and meat products.
2.3.2. Microwave drying
In conventional drying methods, the heat required to evaporate the moisture has to be transmitted inward through the moist material from the surface. This hurdle is eliminated in dielectric heating, where internal heat generation phenomenon is the source of drying. Dielectric drying is achieved by volumetric heating of the material by electromagnetic energy (Strumillo and Kudra, 1986). Microwave drying uses electromagnetic wave as a form of energy, which interacts with materials, thus generating heat and increasing the drying rate dramatically (Mujumdar et al., 1987). The capacity of a food product to be heated when exposed to microwave radiation depends on its dielectric loss coefficient, which reflects the limit of the material to convert the electromagnetic field to thermal energy (Taher and Farid, 2001).
Microwaves fall between radio and infrared waves having a wavelength of 0.025 to 0.75 microns and a frequency range of 300 MHz to 300 GHz. In North America, the Federal Communications Commission (FCC) has permitted only the following microwave frequencies: 915, 2450 and 5800 MHz. Electromagnetic waves, including microwaves, possess energy in the form of high energy packets known as quantum energy. When the quantum energy exceeds chemical energy, it can break chemical bonds. Approximately 75% less energy is required for microwave heating as compared to conventional methods (Quenzer and Burns, 1981).
Microwaves and radio waves which have long wavelengths, low frequency and low energy do not have enough energy to break chemical bonds (Knutson, 1987). Therefore, they are non-ionizing. The quantum energy in the microwave is responsible for the creation of heat as the microwave oscillates 2450 x 106 times per second and the dipole molecules align to the electric
Alternating electric fields stimulate the oscillation of the dipoles of the atoms in water. Heat is generated due to the molecular friction between dipole molecules. Figure 2.1 shows the breakage of water molecular bonds. Breakage in chemical bonds might occur due to this heat generation, but not due to the microwaves directly (Knutson, 1987). The electric field component of microwave is responsible for heating (Meda and Raghavan, 2005). It causes the molecules of dielectric materials to rotate, and produces a rise in temperature due to friction between molecules. It is reported that the magnetic field components do not take part in heating food.
Figure 2.1 Breakage of bonds of water molecules in microwave field
Inside the microwave oven, when incident and reflected microwaves interact, standing wave patterns are formed. The standing wave patterns have maximum and minimum values at certain distances from the reflecting surface. The incident and reflected waves are always in continuous motion (Lorenson, 1990). Inside a microwave oven, there are high possibilities for multiple reflections and hence there are a number of standing wave patterns, leading to non-uniformity in energy distribution.
Several studies have reported that microwaves could be used for surface pasteurisation of meat. Teotia and Miller (1975) reported that 600 and 120 s bursts of microwave energy at 2450 MHz were required to totally destroy Salmonella senftenberg on broiler carcasses and turkey drumsticks. Meat treated with microwave energy less than 20 s showed no drastic changes in appearance (Cunningham, 1980). Partial thawing of meat products has been a major use for
Rotation due to Torque Bond Broken by Rotation
microwaves in the meat industry (Taher and Farid, 2001). Research on electromagnetic radiation such as near and far infrared, microwave and radio frequency has also been applied to the meat industry. Zhang et al. (2004) studied the effect of radio frequency cooking on the texture, color and sensory properties of meat and it was concluded that the radio frequency heating reduced the pasteurization time nearly 79% compared to steam cooking. Infra-red cooking is of particular interest in the meat sector (Sheridan and Shilton, 1999). Also, they reported that the presence of fat had no effect in mid-infrared radiation and, in the case of far-infrared radiation, a number of mechanisms reduced the cooking time more than with mid-infrared radiation cooking. Ohlsson and Bengtsson (1971) have studied microwave heating in slabs of food and food substitutes and developed a one dimensional heat conduction model. Taher and Farid (2001) reported that the time required to thaw the frozen minced beef using microwave energy was only one-fifth of the time required in conventional method.
2.3.3. Freeze drying
Freeze drying is the process of removing water from a product by sublimation and desorption. Sublimation is the transformation of ice directly into a gaseous form without passing through a liquid phase. Figure 2.2 shows the phase diagram of water. Sublimation occurs when the vapor pressure and the temperature of the ice surface are below the triple point of water (4.58 mmHg, 0°C). Freeze drying was first instituted in the early 1900’s as a means for high quality preservation of biological things such as human serum (Irzynic et al., 1995). Freeze dried products have high structural rigidity, high rehydration capacity and low density and they retain raw material properties such as appearance, shape, taste and flavor (Hui et al., 2004).
Ang et al. (1977) have studied the edge effect for cubic beef samples in microwave freeze drying and reported that the pressure had an influence in sample temperature and little effect on drying time. Sagara (2001) studied the transport properties for freeze dried beef and developed a model to predict the permeability of water vapor flow through the dried layer in freeze drying. Ratti (2001) reviewed the hot air and freeze drying by taking into account several important characteristics such as shrinkage, glass transition temperature, process quality interaction, drying
kinetics and costs. It was also concluded by Ratti (2001) that freeze drying can be used as the alternative preservation method where food quality is of main concern.
Hui et al. (2004) studied the microwave freeze drying characteristics of raw beef for various levels of electric field strength, vacuum pressure, sample thickness and initial saturation. They concluded that same quality of dried product could be obtained in much shorter time with microwave freeze drying than conventional freeze drying.
Figure 2.2 Phase diagram of water (adapted from www.wikipedia.org)
Luyet (1962) demonstrated that for freeze dried meat, the rate and extent of rehydration was influenced by the initial freezing rate, which determines the size and location of the corresponding cavities in the freeze dried product. Luyet (1962) also discussed rehydration in terms of two phases: (1) the penetration of water through the cavities and, (2) the absorption of water by the solid tissue surrounding the cavities. It was found that whether the cavities exist within the fibres, as in rapid freezing, or between the fibres, as in slow freezing, water apparently moved more freely through the tissue framework than through the cavities. Air in intermediate
size cavities (about 10 µm diameter) that occur in slowly frozen tissue may interfere with rapid rehydration. The air is ultimately dissolved or expelled. In addition to entrapped air, other impediments to rehydration are water repellent surfaces and relatively impermeable membranes. Surface active agents can be added to increase wettability of the surfaces. Luyet (1962) also observed that water absorption into the muscle fibers proceeded faster in the radial direction than longitudinal direction. Even though the cost of production is two to five times higher than conventional drying methods, freeze dried meat is used by the military, campers and explorers, and is also used in some dried food mixes (Ratti, 2001).
2.3.4. Smoke house drying
Smokehouse preservation is almost as old as open air drying. Smoke has the added effect of imparting desirable flavors to the food. Some of the compounds formed during smoking may have bactericidal properties. The composition of the smoke is of major importance for the quality of smoked products (Sebastian et al., 2004). Although not primarily used to reduce the moisture content of the food, the heat associated with the generation of smoke has a drying effect (Cohen and Yang, 1995). This slow cooking technique keeps the final product tender (FSIS, 2003). Dried beef prepared by proper smoking would lose from 25 to 35% of its green weight (Tomhave, 1955).
2.4. Dielectric Properties
Dielectric properties are of primary importance to evaluate the suitability and efficiency of microwave heating. The dielectric properties of usual interest are the dielectric constant (ε’), dielectric loss factor (ε”) and penetration depth (Dp). ε’ and ε” are the real and imaginary parts, respectively, of relative complex permittivity (εr). The dielectric properties are often defined by the complex permittivity equation (Nelson, 1973):
εr= ε’ – jε” (2.1) where,
ε′ = Dielectric Constant (Real part), and
ε″ = Dielectric Loss Factor (Imaginary part) j = √(-1)
Values that can be presented are those of the dielectric constant, ε′, and the dielectric loss factor,
ε″, respectively, the real and imaginary parts of the complex relative permittivity, ε = ε′ - j ε″
(Nelson, 1973). Values for the loss tangent, tan δ = ε″ / ε′ (where δ is the loss angle of the dielectric) can be calculated from the ε’ and ε″ values. The dielectric constant, loss factor, and loss tangent (sometimes called the dissipation factor) are dimensionless quantities. Mudgett et al. (1974) reported that the amount of free moisture in a substance greatly affects its dielectric constant since water has a high dielectric constant, approximately 78 at room temperature.
Lyng et al. (2005) reported the dielectric loss factor of 1.5% and 2.5% salt as 29.19 and 36.37, respectively, at 2540 MHz frequency. The dielectric loss factor of beef alone was reported to be 13.7 (Lyng et al., 2005). When blended with 1.5% (w/w) salt, the dielectric loss factor increased to 24.4 (Lyng et al., 2005). At 2450 MHz frequency, the dielectric loss of the water mixed with 0.5% (w/w) salt was measured as 15.6 and that of distilled water was measured as 10.3. A study done by Rozzi and Singh (2000) on starch solutions containing salt revealed that the microwave heating profile of the samples containing salts versus those without salt were significantly different. Also, Tang (2005) reported the change in the dielectric properties of mashed potato with 0.8 and 1.8% (w/w) salt. He has reported that the dielectric loss factor was increased from 16.3 to 19.4 by the addition of more salt.
2.5. Water Activity
Water activity is defined as the ratio of water vapor pressure measured in the product to the pressure of a saturated water vapor atmosphere at the same temperature. Water activity is also defined as the free water available to microorganisms to grow. Distilled water has a water activity of 1.0. When solutes like sugar or salt are added to the water, the water activity reduces due to water molecule and salt/sugar interactions which lead to a reduction in available water (Henning, 2004). Low moisture content is only an indication of food stability and not a
guarantee. The availability of moisture for microbial growth has more impact on product safety than water content. The minimum available water necessary for bacterial growth varies with the type of organism. According to the FAO, the lowest water activity for normal bacteria, yeast, molds and salt tolerant bacteria is 0.91, 0.88, 0.80 and 0.77, respectively. It was reported by the USDA (2001) that toxin production by Staphylococcus aureus is inhibited at water activities of 0.92 for anaerobic condition and less than 0.90 for aerobic condition. Figure 2.3 shows the activity of different sources of deterioration at different water activity level. There are only limited details about the relation between water content and water activity (Serra et al., 2005). Reducing the water activity and pH may retard or impede microbial growth. Figure 2.4 gives the relationship between water activity and moisture content for different food groups.
Figure 2.4. Relationship between water activity and moisture content (Cassens, 1994).
2.6. Textural Characteristics
Texture is an important parameter which defines the commercial value of meat and meat products. Texture and tenderness are rated as the most important of all the attributes of eating quality (Lawrie, 1998). Texture can be defined as a function of the size of the bundles of fibres into which the perimysial septa of connective tissue divides the muscle longitudinally (Lawrie, 1998). According to Weir (1960), the overall impression of tenderness to the palate includes texture, the initial ease of penetration of the meat by the teeth, the ease with which meat breaks into fragments and the amount of residue remaining after chewing. Hyldig and Nielsen (2001) reported that texture is a sensory parameter that only human being can perceive, describe and quantify. Even though there are contradictions among its definitions, it is clear that texture is the most important parameter which decides the value of meat products (mainly, in terms of consumer needs), particularly jerky.
2.6.1. Factors affecting texture
The texture of meat is affected by different pre and post-mortem factors. Several works were carried out to understand the textural properties of dry cured ham. Garcia-Rey et al. (2004)
studied the relationship between pH before salting and dry-cured ham quality and concluded that pH before salting is a good predictor for dry-cured ham quality. Ruiz-Ramirez et al (2005) reported that dry-cured ham muscles with lower salt content had lower hardness. Firmness, dryness and aroma of dry-cured ham improved with time (Buscailhon et al., 1994). Sensory and mechanical textural properties were not highly correlated for dry-cured ham (Guerrero et al., 1999). It was reported by Serra et al. (2004) that the hardness value of the dry-cured ham increased dramatically when the water activity and moisture content reached below 0.70 and 0.55 kg water/kg dry matter, respectively. Aranu et al. (1997) had found that an increase in the final month ageing temperature produced a softer and pastier texture in Biceps femoris muscle product. Resting time, brine injection, skinning and deboning also affected the final ham product. Texture is strongly dependent on the meat protein level (Pietrasik and Shand, 2003). Salt concentration has an influence on the texture of the product (Arnau, 1991). Intra muscular fat content has a strong influence on the texture of dry cured ham (Ruiz-Carrascal et al., 2000). It was found out that deboning time along with cooking method also affect texture (Hsieh et al., 1980). Coarseness of texture increases with age of the animal (Lawrie, 1998). Significant negative correlation was reported between moisture content and hardness by Virgili et al. (1995) and Monin et al. (1995 & 1997) for dry-cured ham product. Temperature and relative humidity of the air affect the appearance and texture of dry-cured ham (Arnau and Gou, 2001; Arnau et al., 2003). Numerous studies of texture properties of meat muscles have been reported. Laakkonen et al. (1970) reported that meat tenderization and toughening during heating were due to the solubilization of the connective tissue and the denaturation of myofibrillar proteins, respectively. The relationship between toughness and cooking temperature was further studied by Davey and Gilbert (1974). They reported that toughness increases in two stages. The first increase was between 40 and 50oC due to the denaturation of the contractile system of muscle, while the second stage was between 65 and 75oC because of the collagen shrinkage. Similar results were found in other studies (Bouton et al., 1974; Ledward 1979). Most of the researchers studied the effect of physico-chemical composition on texture properties or the measurement of texture properties under a certain set of processing conditions. But, no studies were done to investigate the effect of different ingredients on textural properties of jerky.
2.6.2. Texture measurement techniques
Many attempts have been made to develop objective physical and chemical methods of assessing texture which would compare with subjective assessments by taste panels (Lawrie, 1998). Physical methods of measuring texture include the following; measuring the shear force (Warner, 1928; Kramer, 1957; Winkler, 1939), penetration force (Tressler et al., 1932; Lowe, 1934), force required to cut (Miyada and Tappel, 1956), force required to puncture (Lehmann, 1907; Volodkevitch, 1938), compression force (Sparring et.al., 1959) and tensile force (Wang et al., 1956). Chemical method involves the determination of connective tissue (Lowry et al., 1941; Neumann and Logan, 1950). In the enzymatic digestive method, enzymes such as papain, bromelain, ficin, trypsin and Rhozyme P-11 were employed (Kramer and Szczesniak, 1973). Ruiz de Huidobro et al. (2005) have compared Warner-Bratzler texture profile and texture profile analysis on raw and cooked meat and reported that texture profile analysis (TPA) method is the best predictor of sensory texture for bovine meat. The Warner-Bratzler shear test measures the force necessary to shear a piece of meat, whereas TPA measures the compression force.
Texture is affected by drying jerky at high temperatures for extended periods of time (Calicioglu et al., 2002). It was reported by El-Shimi (1992) that the penetration force required is higher for microwave cooked roast beef than for conventionally cooked roast beef. Texture Technologies Corporation (2005) has tested the textural properties of restructured jerky against the traditionally made jerky. Very limited works have been reported on the textural characteristics of dried meat products. As the product quality mainly relies on its textural properties for market value, it is vital to investigate the effect of different parameters involved in its processing such as pH, water activity, salt content and method of drying. There was no literature found regarding these aspects. Emphasis has to be given to improve the textural characteristics of meat products. 2.7. Summary
As discussed earlier, there is a strong urge to understand the behavior of jerky while drying to optimize the process. As drying is the most important process controlling the final quality of the
product, a deep knowledge of drying characteristics becomes vital. Increasing demand for this jerky increases the need for alternate and efficient drying method. As there are varieties of drying methods available, an energy efficient, rapid drying method needs to be further evaluated for its feasibility in jerky processing. Selection of the best method of drying beef jerky is desirable in order to achieve a better quality product in terms of texture, product safety and nutritional value. Increasing demand of soft jerky among women and children also urges the need for further research in product development of jerky. In this study, an attempt has been made to introduce the microwave drying / processing of beef jerky due to its rapid heating characteristics and unique manner of energy – material interaction effect.
CHAPTER III
MATERIALS AND METHODS
This chapter describes all the materials used for this research study. Also, it explains the experimental design plan and procedures carried out.
3.1. Materials
This section deals with the listing of several ingredients used in the preparation of the jerky samples and different drying systems, instrument and related equipment used in this research. 3.1.1. Materials used for sample preparation
The ingredients used for preparing all the samples studied are included below;
1. Meat –Beef Biceps femoris meat from Department of Food and Bioproducts Sciences, University of Saskatchewan, Saskatoon, SK
2. Glucono delta lactone, acidifier 3. Sodium chloride
4. Sugar
5. Sodium erythorbate
6. Prague™, curing agent (1 part sodium nitrite and 16 parts sodium chloride) 3.1.2. Equipment used for sample preparation
The following equipment were used in sample preparation of beef jerky. 1. Meat Grinder – Biro, Biro Mfd. Co. Marblehead, OH, USA
3. Industrial Blender – Berkel BA-20, Model ARM-02.
4. Food Extruder – Albert Handtmann Mfd. Ltd., Model VF-80, West Germany 3.1.3. Equipment used for drying experiments
The drying experiments were carried out in the following drying systems, listed below: 1. Modified microwave oven – Model Panasonic NNC 980W, 2005.
a. Universal Multi channel Instrument, FISO Technologies Inc. Quebec. b. Labview, Version 6.0, National Instruments, Austin, TX
2. Forced air cross flow thin layer drying system
a. Air Conditioning Unit- Bryant Mfd., Model AH-213, BMA Inc., Ayer, MA b. Axial fan, Model VA7D32, American Cool Air Corp, Jacksonville, FL c. Electronic transistor inverter- Model VFS7, Toshiba Corporation, Japan d. Relative humidity sensor- Watlow microprocessor controller
3. Smokehouse unit from Department of Food and Bioproduct Sciences, U of S. a. Alkar small batch smoke oven, Model 1000, Alkar, Lodi, WI, USA
b. Combined exhaust and dust collector, American air filter, Model Type W- Roto-clone, Filtration Product Group, Louisville, KY
3.1.4. Equipment used for characteristics measurements
The following is the listing of the instruments used to measure physical-chemical and textural characteristics of beef jerky;
1. Vacuum oven -Fisher Vacuum Oven, Fisher Scientific. Co., Model 15, USA 2. Water activity meter- Aqua Lab, Model CX2, Decagon Devices Inc., WA, USA
3. Hunterlab Color Analyzer- Model Labscan-2, Hunters Associates Laboratory Inc., Virginia, USA.
4. pH Meter – Accumet, Model 15, Fisher Scientific, Pittsburgh, PA
5. Universal Texture Analyser – Model TA.XT2, Texture Technologies Corp., Scarsdale, NY
3.2. Experiment Conducted to study the Effect of pH and Salt Content in Combined Microwave-Convection Drying
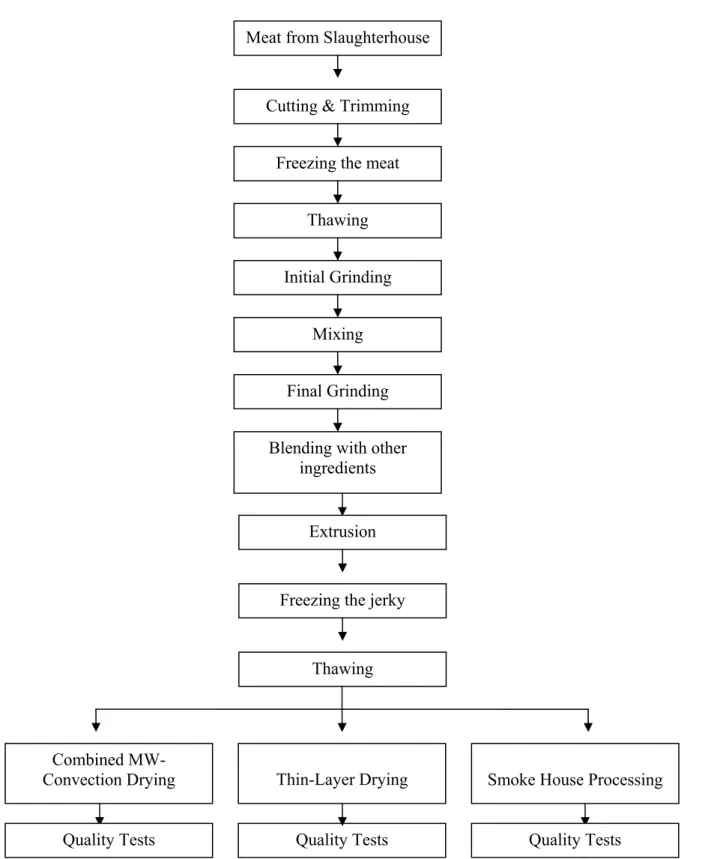
The effect of pH and salt content on beef jerky was explored for combined microwave-convection drying. The experimental design, methods of sample preparation and drying are explained in this section. Figure 3.1 shows the overall processing steps involved (sample procurement to end quality determination) in this experiment.
3.2.1. Experimental design
Samples having pH values of 5.65, 5.30 and 5.15 and sodium chloride content of 1.28, 2.28 and 3.28% (w/w) were tested to explore the effect of pH and salt content on combined microwave-convection drying of beef jerky. The experiment was designed using a randomized complete block design. All the experiments were done in two replicates. The treatment combinations are shown in Table 3.1.
Table 3.1. Treatment combinations P1S1 P1S2 P1S3 P2S1 P2S2 P2S3 P3S1 P3S2 P3S3
where, P1, P2 and P3 refer to pH values of 5.65, 5.30 and 5.15, respectively and S1, S2 and S3 refer to salt content of 1.28, 2.28 and 3.28% (w/w), respectively.
Figure 3.1. Flow chart indicating various stages of beef jerky preparation, drying and end product quality analysis.
Meat from Slaughterhouse
Cutting & Trimming
Initial Grinding Freezing the meat
Mixing Final Grinding Blending with other
ingredients
Extrusion
Freezing the jerky
Thin-Layer Drying Thawing
Quality Tests Combined MW-
Convection Drying Smoke House Processing
Quality Tests Quality Tests
3.2.2. Sample preparation
Beef Biceps femoris muscles were used to prepare the samples. The excess fat was trimmed off from the meat to prevent rancidity while drying. The meat received from the slaughterhouse was stored at -30 °C. The meat was thawed for 48 h to reach 4°C prior to sample preparation. As a first step of sample preparation, the meat chunks were ground using a kidney plate in a meat grinder (Biro, Biro Mfd. Co, Marblehead, OH, USA). To improve the homogeneity, the coarsely ground meat was blended in a vacuum tumbler (H. Glass, Model-VSM-150, Frankfurt, Germany) for 2 minutes. Again the meat was ground twice in a meat grinder using a blade with 1/8 inch slots. The other ingredients, according to the respective treatments shown in Table 3.2., were mixed with the meat at a low speed using the Industrial Blender (Berkel BA-20, Model ARM-02) for 105 s. To achieve the desired pH values of 5.65, 5.30 and 5.15, an industrial acidifier, glucono delta lactone, was added at 0, 0.5 and 1% (w/w), respectively, with the mixture while blending. The mixture was then fed into an industrial food extruder (Albert Handtmann Mfd. Ltd., model-VF-80, West Germany) to get 6 mm thick samples, which were then vacuum packed and stored in a -30°C blast freezer for further processing.
Table 3.2. Formulations of beef jerky samples with different treatments
Treatment Meat (g) GDL* (g) Salt (g) Sugar 2% (g) Prague™ 0.3% (g) Na Ery** 0.05% (g) Water 3% (g) P1S1 2817.92 0 21.58 60 9 1.5 90 P1S2 2787.92 0 51.58 60 9 1.5 90 P1S3 2757.92 0 81.58 60 9 1.5 90 P2S1 2802.92 15 21.58 60 9 1.5 90 P2S2 2772.92 15 51.58 60 9 1.5 90 P2S3 2742.92 15 81.58 60 9 1.5 90 P3S1 2757.92 30 21.58 60 9 1.5 90 P3S2 2757.92 30 51.58 60 9 1.5 90 P3S3 2727.92 30 81.58 60 9 1.5 90
3.2.3. Combined microwave-convection drying
The frozen raw samples were thawed for 5 h at room temperature (23°C) prior to drying. Drying experiments were carried out in a laboratory-scale modified microwave oven (Model-Panasonic NNC 980W, 2005) which was designed to dry/heat with microwave, convective and a combination of convective and microwave energy. The specifications of the microwave oven are shown in Table 3.3. Each test was conducted with a sample size of 25 g. A setting of 295 W, pulse microwave (14 s ON and 7 s OFF), 70°C air temperature and 1.45 m/s air flow rate were used to dry the samples to 0.33 dry-basis moisture content. The time taken was noted and the weight loss was recorded online using a balance and Labview 6.0 (National Instruments, Austin, TX). The product temperature was monitored online during drying using a Universal Multi- channel Instrument (UMI, FISO Technologies Inc., Quebec) and Labview 6.0. One end of the four fibre optic probes was connected to the UMI and the other end of the probes was placed in different locations of the sample. Data were acquired using Labview 6.0. All the experiments were conducted in two replicates. Within each replication, three sets of data were collected for each treatment and the means were used for statistical analysis.
Table 3.3. Specifications of Panasonic NNC 980 W-Microwave oven.
The dried samples were vacuum-packed and kept at 4ºC as a preventive measure from loss or gain of moisture.
Microwave Power Consumption 12.8 Amps, 1500 W Heater Power Consumption 12.5 Amps, 1500 W
Microwave Output 1100 W
Heater Output 1400 W
Outside Dimensions 376 mm (H) x 606 mm (W) x 491 mm (D) Oven Cavity Dimensions 242 mm (H) x 412 mm (W) x 426 mm (D)
3.3. Experiment Conducted to Study the Effect of Relative Humidity and Airflow Rate on the Thin-Layer Drying of Beef Jerky
The study to find the effect of relative humidity and airflow rate on thin-layer drying experiment was done with two relative humidities (40 and 15%) and airflow rates (1 and 1.45 m/s).
3.3.1. Sample preparation
For this experiment, 2.28% (w/w) salt content, 2% (w/w) sugar, 0.3% (w/w), pragueTM, 0.05% (w/w) sodium erythorbate and 3% (w/v) water were mixed with 3 kg of meat and the samples were prepared using the method described in section 3.2.2.
3.3.2. Forced-air thin-layer drying
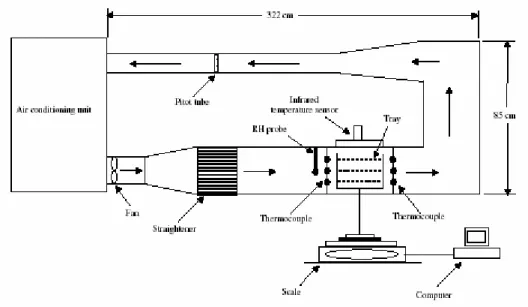
The laboratory scale forced-air thin-layer cross flow drying unit (Figure 3.2) was used to dry the samples. This system consists of an air conditioning unit, a drying chamber, a vane axial circulating fan and a connecting duct system
The air conditioning unit (Model AH-213, BMA Inc., Ayer, MA) has an operating range of temperature between -17 and 200ºC and a relative humidity range of 2 to 98% which are controlled by a Watlow microprocessor controller with a temperature accuracy of ± 0.25ºC and the relative humidity accuracy of ± 2%. The axial fan (Model VA7D32, American Cool Air Corporation, Jacksonville, FL) re-circulates the conditioned air. The speed of the fan is controlled by a variable electronic transistor inverter (Model VFS7, Toshiba Corporation, Japan). The drying chamber consists of three rectangular fine wire-mesh drying trays, which are housed in the duct system insulated with 50.8 mm thick fiber glass.
The tests were conducted for 40 and 15% relative humidity and 1 and 1.45 m/s airflow rate with a constant air temperature of 80ºC. Samples were placed in the drying trays and product weight change was monitored online using Labview 6.0 (National Instruments, Austin, TX).
3.4. Smoke House Drying Experiment
3.4.1. Sample preparation
For this experiment, the jerky samples prepared with 2.28% (w/w) salt content, 2% (w/w) sugar, 0.3% (w/w) pragueTM, 0.05% (w/w) sodium erythorbate, 3% (w/v) water and 3 kg of meat were used.
3.4.2. Smoke house processing
A batch smoke oven (Model 1000, Alkar Corp., Lodi, WI, USA) shown in Figure 3.3, having a dimension of 228.6 m x 139.7 m x 154.9 m (height x depth x width), was used to process the jerky. The raw samples were placed on the trays of the scrolling truck with a screen size of 106.7 m x 106.7 m. The specialized oscillating air movement within the oven designed for the smoke house (shown in figure 3.4) improves the circulation of air within the chamber. The process is controlled by a JumboKPF-92 computerized controller. The dust and exhaust air is handled by type W roto-clone, American Air Filter, Filtration Product Corp., Louisville, KY. Table 3.4
shows the process parameters used in the preparation of beef jerky. The drying trials were done with two replications.
Figure 3.3. Batch smoke oven (www.alkar.com).
Table 3.4.Process parameters used for smokehouse processing. Air
Temperature,°C
Relative humidity, % Cycle Time, min
40 30 20 55 30 20 60 30 20 65 45 20 70 40 20 76 45 30(Steaming) 50 25 Till end 3.5. Drying Characteristics
The different drying data obtained were fitted to the existing drying models shown in Table 3.5 using TableCurve 2D statistical software (Version 5.01, Systat Software Inc., San Jose, CA). Table 3.5.Drying models.
Model
No. Name Model Equation References
1 Newton MR = exp(-kt) Liu and Bakker-Arkema (1997) 2 Page MR = exp(-ktn) Zhang and Litchfield (1991) 3 Modified Page MR = exp(-(kt)n) White et al. (1981)
4 Wang and Singh MR = 1 + at + bt2 Wang and Singh (1978) 5 Henderson MR = a.exp(-kt) Chhninman (1984) 6 Midilli MR = a*exp(-k(tn))+b*t Midilli et al. (2002)
The moisture ratio (MR) is calculated as: e i e M M M M MR − − = (3.1)
where, M = moisture content (% db.); M
e= equilibrium moisture content (% db.) and
M
i= initial moisture content (% db.)
3.6. End Quality Analysis: Physical-Chemical Characteristics Measurement
3.6.1. Moisture content measurement
Initial and final moisture contents of the sample were measured in accordance with the ASAE S353 (2003) method. The samples were passed through a 3 mm size screen of a precision grinder for three times. The ground sample was then mixed properly and a 5 g sample was placed in a covered aluminum dish which was put in a vacuum oven at 100°C under 100 mmHg absolute pressure for about 5 h until it reached a constant weight. Moisture content of each sample was measured three times.
3.6.2. Water activity measurement (aw)
Water activity of the dried samples was measured using an Aqua lab water activity meter (Model CX2, Decagon Devices Inc., Washington, USA). The slices were cut into fine pieces for taking the measurements. Water activity of each sample was measured three times.
3.6.3. Shrinkage loss measurement
Initial and final volumes were measured and the shrinkage coefficient was calculated using
Shrinkage Coefficient = 1 ×100 − i f V V (3.2) where Vf is the final volume and Vi is the initial volume of the sample (Trujillo et al., 2005). Samples were tested three times for each treatment.
3.6.4. pH measurement
The pH of jerky samples before drying was measured using a pH meter (Accumet-Model 15, Fisher Scientific). The pH meter was first calibrated with standard buffer solutions. Then, 20 g of sample with 80 ml of distilled water was mixed thoroughly in a household type blender for 30 s. The electrode was immersed in the mixed slurry and the sample pH was recorded. It was repeated three times for each treatment, with a fresh sample each time.
3.6.5. Color measurement
The color of the jerky before and after drying was measured to determine the appearance change. All the color measurements were done using a Hunterlab Color Analyzer- Labscan-2 (Hunter Associates Laboratory, Inc. Virginia, USA). The fresh or dried samples were placed in the 1.25 cm of area view and D65 was used as the illumination source. The CIE lab color scale (L*, a* and b*) value were recorded, where ‘L’ coordinate indicates lightness, which represents the greyness ranging from black (L = 0) to white (L = 100). The browning of the dried samples can be identified from the L value. The higher the L value, the less the product’s brown color (Rahman et al., 2002). The value represents the redness/greenness of the product. A positive a-value indicates the redness of the product and the coordinate ‘b’ indicates the yellowness (positive) or bluishness (negative). Three replicates were taken for each treatment and six readings were taken. To evaluate the effect of different drying temperatures on the overall combined color of the dried meat, the index ∆E as given in equation (3.3) (Tabil et al., 2001) was calculated by taking the color of fresh meat as the base value.