Interactive Tool and Database for Optic Disc and Cup
Segmentation of Stereo and Monocular Retinal Fundus
Images
F. Fumero1, J. Sigut2, S. Alayón3 University of La Laguna Department of Computer Science
Faculty of Physics
Spain (38200), La Laguna, Tenerife 1[email protected],2[email protected], 3[email protected] M. González-Hernández4, M. González de la Rosa5 University of La Laguna Department of Ophthalmology Hospital Universitario de Canarias Spain (38320), La Laguna, Tenerife
4[email protected], 5[email protected]
ABSTRACT
Glaucoma is one of the leading causes of irreversible blindness in the world. Early detection is essential to delay its evolution and avoid vision loss. For this purpose, retinal fundus images can be used to assess the cup-to-disc ratio, the main indicator of glaucoma. Several automatic methods have been developed to compute this indicator, but the lack of ground truth of the optic disc and cup is an obstacle to evaluate and compare their results. In order to support clinicians to perform this task, an interactive tool for the segmentation of the disc and cup on stereo and monocular retinal fundus images has been developed. By using this tool, we have also built a new database of 159 stereo fundus images with two ground truth of disc and cup. The application and the database are both publicly available online. This work can serve as a learning environment for clinicians, as well as to evaluate the results of automatic segmentation algorithms.
Keywords
retinal fundus images, optic disc, optic cup, database, interactive segmentation, stereo
1
INTRODUCTION
A retinal fundus image is an image of the retina taken by a specialized camera, called fundus camera. This image modality plays an important role on diagnose eye diseases such as diabetic retinopathy or glaucoma. Glaucoma is the leading cause of irreversible blind-ness in the population of industrialized countries [But12][Ala13] and refers to a group of diseases that affect the optic nerve and involves a loss of retinal ganglion cells. Early detection is crucial to prescribe appropriate treatment, in order to delay its evolution and avoid vision loss. The best known prevention methods are the regular assessment of the morphology of the optic nerve head (ONH), establishing the thick-ness of the fiber layer of the retinal optic nerve, and the
Permission to make digital or hard copies of all or part of this work for personal or classroom use is granted without fee provided that copies are not made or distributed for profit or commercial advantage and that copies bear this notice and the full citation on the first page. To copy otherwise, or re-publish, to post on servers or to redistribute to lists, requires prior specific permission and/or a fee.
subjective analysis of retinal sensitivity in the visual field of the patient.
The morphology of the surface of the optic nerve is controlled through direct observation methods, such as confocal laser scanning (HRT) or retinal fundus images. The latter, either monocular or stereoscopic, is the only modality which preserves the color and most patholo-gies of the retina. The main indicator of glaucoma is the cup-to-disc ratio (CDR) [Zha10][Tru13], which is the ratio of the size of the optic cup to that of the optic disc. Glaucoma can cause the cup to enlarge because of the loss of nerve fibers, leading to high values of the CDR [Bha10].
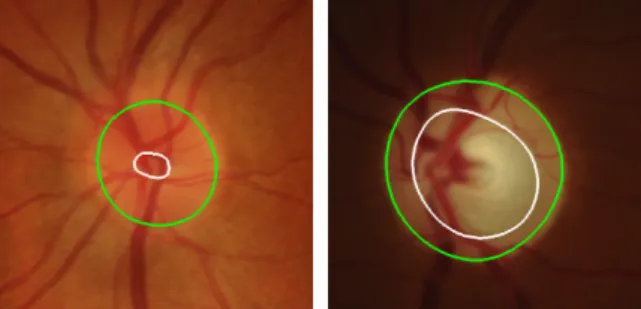
Figure 1 shows examples of retinal fundus images of a healthy and a glaucomatous eye. The images have been cropped to highlight the optic nerve head of the retina, also called the optic disc, which is the brightest part with elliptical shape. In both images, the contours of the optic disc and the optic cup have been superimposed in green and white, respectively. It can be seen that the cup-to-disc ratio is larger in the subject with glaucoma than in the healthy subject. As the cup-to-disc ratio is considered the main indicator of glaucoma, the correct detection of the optic disc and cup is a key factor for the early detection and treatment.
Figure 1: Examples of retinal fundus images of a healthy (left) and glaucomatous (right) subject, cropped to highlight the optic nerve head. The contours of the optic disc (green) and cup (white) have been superim-posed.
There are numerous contributions aiming to automat-ically measure the CDR [But12][Jos10] but given the lack of totally objective instruments to obtain ground truth segmentations of the optic disc and cup, the only way to evaluate the results of these methods is to rely on expert segmentations [Tru13]. One of the obstacles is that most information remains locally in hospitals or re-search centers [Zha10] and only one public dataset for glaucoma diagnosis is available [Siv14], as far as we know.
The manual delimitation of the optic disc and cup is a difficult task, due to the high inter-patient variability of the ONH appearance [Ala13]. Hence, considerable ex-perience is required to perform this task, but as some authors have suggested clinicians are not trained to use software to annotate images and create reference seg-mentations [Tru13]. To this end, it would be desirable to have intuitive annotation tools that can also be used to introduce clinicians to this practice.
In order to achieve this, we have developed an easy-to-use interactive segmentation tool, called DCSeg, specif-ically designed to manually segment the optic disc and cup. Its main features are the possibility of segmenting the cup as well as the disc, the ability to show an stereo image to ease the segmentation of the cup [Sto10] and a self-assessment mode to train or improve the abilities of a new user when creating ground truth of the disc and the cup.
We have used this tool to build a new database of stereo fundus images, with two reference segmentations of the optic disc and cup, created by two experts in ophthal-mology from Hospital Universitario de Canarias. This database can be used in the self-assessment mode of DCSeg and for the evaluation of the results of automatic algorithms.
Both the segmentation tool and the database are pub-licly available online at the website of the Medical Im-age Analysis Group of the University of La Laguna (http://medimrg.webs.ull.es/).
The detailed description of the DCSeg software (section 3) and the database of stereo fundus images with ground truth of the optic disc and cup (section 4) constitute the core of this paper.
2
RELATED WORK
Firstly, we will analyze some tools for interactive or semiautomatic segmentation of medical images and, in particular, fundus images. Secondly, we will discuss some databases of retinal images that are available on-line.
2.1
Segmentation tools
The tools that allow labeling of medical images range from general-purpose image processing applications, such as the GIMP, to more specific ones, commercial and free, that allow the user to segment an image inter-actively. In this review, we will focus on specific tools freely available on the Internet, with a special empha-sis on those designed to annotate the structures of the retina, like the optic disc and cup.
Most interactive segmentation tools for medical images work with 3D gray-scale images which is not useful in our case. Some applications that allow working with 2D color medical images are Ratsnake [Iak14], which uses active contours and has been successfully applied to different medical imaging domains, MRSeg [Fum13], an adaptable tool that can use any automatic segmentation algorithm to create regions that the user will later fuse or split to create the ground truth, or ilastik [Som11], an interactive segmentation environ-ment with a trainable classifier based on Random For-est.
However, segmentation tools specifically designed for retinal fundus images are scarce or difficult to access. The most notable ones are the applications recently in-cluded in the VAMPIRE project [Per11]. In the con-text of this project, a semi-automatic tool to annotate the optic disc, fovea, junctions and vessel widths has been developed. Separate tools to manually segment the macula, the vessels and the optic disc [Gia11] have also been published. The latter allows the user to spec-ify 10 points along the contour of the optic disc and then performs the fitting of an ellipse to generate the fi-nal segmentation. However, a serious disadvantage of this tool is that the fitted ellipse cannot be deformed to capture the irregular shapes of some discs. Moreover, the tool does not enable the user to annotate the optic cup or work with stereo images. DCSeg provides all these features, among others.
2.2
Retinal databases
There are some well-known databases of retinal fundus images that have been widely cited in the scientific liter-ature, such as the DRIVE [Sta04], a database for vessel
extraction, and the STARE project [Hoo03], created to validate the location of the optic nerve in retinal images. Concerning databases that contain ground truth of the optic disc, we have found DiaRetDB1 [Kal], with 89 color fundus images annotated with different diabetic retinopathies and with some elliptical optic disc seg-mentations, and DRIONS-DB [Car08], which contains 110 images and 2 ground truths of the optic disc for each one. Some other examples are ARIA [Zhe12], RIM-ONE [Fum11] and MESSIDOR [Tec]. ARIA only provides optic disc segmentation for some of the images. RIM-ONE is a database specifically designed for optic disc segmentation of color fundus images. Up to date, it has 2 releases, the first one with 5 manual expert segmentation and 169 images classified into nor-mal subjects and different glaucoma states; the most re-cent release with one expert segmentation of 455 im-ages, split into healthy and glaucoma subjects. MES-SIDOR consists of 1200 images with annotations of the optic disc by a single clinician of the University of Huelva [GA13].
There seems to be only one publicly available database with optic disc and cup reference segmentations, Drishti-GS [Siv14]. It consists of 101 monocular fundus images, divided into 50 training and 51 testing images, with four expert segmentations of the disc and cup for the training set. Some authors have published papers describing similar databases, such as ORIGA-light [Zha10] or, more recently, ACHIKO-K [Zha13], but they cannot be easily accessed. ORIGA-light contains 650 fundus images annotated by one clinician using an ellipse fitting. ACHIKO-K consists of 258 images from glaucoma patients, with expert segmentations generated via polynomial spline fitting. As far as we know, and as pointed out in the exhaus-tive and extensive revision carried out in [Tru13], there are no publicly available stereo datasets for glaucoma diagnosis and validation. Therefore, to the best of our knowledge the proposed database seems to be the first publicly available database of stereo fundus images with ground truth of the optic disc and cup.
3
INTERACTIVE SEGMENTATION
TOOL
The main aims of this work are to ease the creation of data sets of reference segmentations of the optic disc and cup and to train users to perform this task.
For this purpose, we have developed DCSeg, a desk-top application with a graphical user interface for the interactive segmentation of the optic disc and cup in retinal fundus images. It allows to manually segment the optic disc and the cup separately, using monocular or stereo fundus images. The tool has been designed to be able to create several reference segmentations of the
same image, by one or more experts. Moreover, it can be used to train a new user on the segmentation of this kind of structures through the self-assessment mode of the application. By using this feature, the tool compares the segmentation of the user to the gold standard of the same image developed by the experts, thus helping the user to improve their skills.
This application has been developed entirely in Java and has been tested on Java SE 6, 7 and 8, so it could be used in the most popular operating systems.
In the following subsections we will describe the fea-tures of the tool in detail.
3.1
Segmentation of monocular fundus
images
By using monocular fundus images the user can manu-ally segment either the disc, the cup or both. As we pre-viously pointed out, some other tools [Gia11][Zha10] require to select some points of the image to perform an ellipse fitting based on least square fitting algo-rithms. Sometimes, it is difficult to select these points to achieve the desired fitting because the fitted ellipse is only shown once the user has selected all the points. Besides, the result is an ellipse that cannot be deformed to capture individual variability.
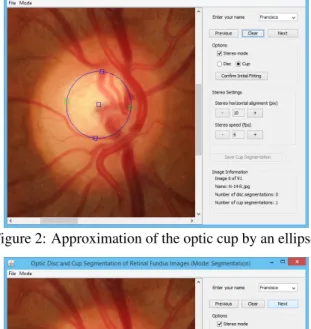
In order to ease the process of manual segmentation, a different strategy has been implemented in DCSeg. Firstly, it allows to make an initial segmentation of the contour of the optic disc and cup by adjusting an ellipse on top of the image. This initial approximation can be easily achieved by using the green and blue controls showed in Fig. 2 to adjust the position and the shape of the ellipse.
Secondly, after this initial fitting, the ellipse can be op-tionally deformed to capture the irregular shape of some structures. In order to do this, the application gives the option to refine the segmentation by the adjustment of 16 predefined radii, as showed in Fig. 3.
The application can also be used by more than one ex-pert to create several reference segmentations of the same image. The number of disc and cup segmenta-tions of the same image are clearly showed in the appli-cation interface. This feature helps to evaluate the intra-and inter-observer variability intra-and to generate richer intra-and more reliable gold standards.
3.2
Usage of stereo fundus images
Alternatively, stereo fundus images can be used to seg-ment the cup in an easier way. The stereo output format of the Kowa WX 3D fundus camera has been adopted as the input format in DCSeg. An example of this for-mat is shown in Fig. 4. It consists of two photographs of the same eye taken at the same time from slightly
Figure 2: Approximation of the optic cup by an ellipse.
Figure 3: Refinement of the initial fitting of the cup by adjusting the predefined radii.
different angles and showed together on one image to form a stereo pair.
TheStereo modeof DCSeg simulates 3D effect by loop-ing the two images of the stereo pair, one on top of the other, as the frames of an animated image, which is of-ten known asanimated stereograph. The frequency of the animation is 6 frames per second by default.
Figure 4: Example of the stereo image format accepted by DCSeg. The ONH of a subject is captured from two slightly different angles at the same time using a stereo-scopic fundus camera.
As the two images are taken from different angles, this technique allows the user to recover part of the 3D scene, which provides some depth information of the cup thus easing its segmentation. This avoids the use of a stereoscope or a special stereo viewer but still takes advantage of the utility of stereo images to evaluate the optic disc [Sto10].
The application provides some controls to the user in order to deal with theStereo mode: theStereo horizon-tal alignment and theStereo speed (Fig. 2, 3). The former,Stereo horizontal alignment, allows the user to properly align the left and right images of the stereo pair, as they are vertically aligned but not necessarily horizontally aligned. A proper horizontal alignment is necessary to see the 3D effect of the animation. The latter, Stereo speed, gives the user the ability to change the frames per second, increasing or decreasing the speed of the animation.
3.3
Learning and self-assessment mode
As we previously stated and according to [Tru13], an-notating the structures of a medical image using a com-puter application is a task that clinicians are not nor-mally trained for.
In order to introduce ophthalmology experts into this practice, a self-assessment mode has been imple-mented. This mode of the application can be used to learn how to segment both the disc and the cup. It allows the user to perform a segmentation as described in the previous sections and compare the result to the ground truth of the image being segmented, showing the variability percentage of each one of the radii (Fig. 5).
Figure 5: Self-assessment mode of DCSeg showing the variability percentage of all the radii between the ground truth and the user segmentation of the disc. This feature is also useful to visually evaluate if two ex-perts have different criteria segmenting both structures, to assess the intra-observer variability and to detect er-rors in the database.
4
DATABASE OF STEREO FUNDUS
IMAGES
A new online database of stereo retinal fundus images for glaucoma diagnosis and validation has been de-veloped. This is the third release of the Retinal IM-age database for Optic Nerve Evaluation, RIM-ONE [Fum11], and consists of 159 stereo fundus images and 2 expert reference segmentations of optic disc and cup. The previous releases of RIM-ONE were focused on the segmentation of the optic disc, while this new one also adds optic cup ground truths as well as stereo im-ages. The expert segmentations have been carried out by using the proposed tool DCSeg. The database and the tool can be both used for research and educational purposes, without requesting permission to the authors. The rest of this section describes the dataset, the ground truth and the evaluation of the results.
4.1
Dataset
The database consists of 159 images collected at the Hospital Universitario de Canarias and divided by the experts into two groups: one group for healthy subjects and the other group for glaucoma or suspicion of glau-coma patients. The group of healthy subjects consists of 85 images (46 females and 39 males, 48±15 years) and the other group contains 39 confirmed glaucomas (17 females and 22 males, 68±11 years) and 35 glau-coma suspects (21 females and 14 males, 62 ± 12.1 years).
The study was performed in accordance with the ethical standards established in the 1964 Helsinki declaration. Ethical committee approval was obtained and the pa-tients were informed about the objectives of this study. All of the studied subjects were selected arbitrarily and do not belong to longitudinal cases.
All the images were taken by a non-mydriatic Kowa WX 3D stereo fundus camera, with specific flash inten-sities to avoid color saturation. They are centered on the ONH with a field-of-view of 34oand the stereoscopic images are captured in the same camera shot, giving a resolution of 2144×1424 pixels in the format showed in Fig. 4. The image files of the dataset are named as
Category-K-EyeSide.jpg, whereCategorycan be Nor-mal (N), Glaucoma (G) or Suspect (S),Kis a number assigned to each image andEyeSidecan be Left (L) or Right (R).
4.2
Ground truth description
The interactive tool DCSeg has been used in Stereo modeto carry out the ground truth of the database. As a result, some text files were generated for each ex-pert segmentation. Then the files were processed using some Matlab scripts, which are also publicly available, to obtain an average segmentation and an interpolated
mask. The format and content of each type of ground truth file are described below.
• DCSeg segmentation file
This file contains the parameters of the ellipse used for the initial segmentation of the disc and cup, the coordinates of each one of the points over the prede-fined radii, as well as the coordinates of the center of the radii and the ellipse. The name of this file is of the formCategory-K-EyeSide-M-Region-Expert.txt, where the first 3 elements identify the image,Region
refers toDiscorCup,Expertis the expert who per-formed the segmentation, andMis an order number to properly store different segmentations of the same image and region by the same expert.
• Average segmentation file
All of the text files containing an expert segmenta-tion of the same image and region were fused to-gether into a new file. This was done by a Mat-lab script that averages the points of the same ra-dius (Fig. 3) from different segmentations, creat-ing an average segmentation file. This file is named asCategory-K-EyeSide-Region-Avg.txtand contains the average coordinates of the center and the points.
• Interpolated mask file
Another Matlab script was used to interpolate the points of the radii and create a smoothed mask from the text files described previously. The interpolated mask is stored as a binary image in PNG and MAT formats, for the experts and the average segmenta-tion using the same name convensegmenta-tion as before. Fig-ure 1 shows examples of two images of the dataset where the contours of the interpolated masks for one of the experts have been superimposed.
4.3
Evaluation of the database
The expert segmentations of the database have been evaluated using the Jaccard index, the variability measure defined in [Fum11] and the estimated vertical CDR.
The Jaccard similarity index between a segmentationS
and a reference segmentationRis the size of the inter-section divided by the union of the two segmentations (Eq. (1)).
J(S,R) =|S∩R|
|S∪R| (1)
The variability percentage (VP) defined in eq. (2) mea-sures the variability between the boundary of a segmen-tation and a reference in 8 points of the contour every 45o, covering the most important zones of the ONH. The termsdi(S)anddi(R)measures the distance from
the center of the reference to thei−thpoint of, respec-tively, the contour ofSandR.
V Pi(S,R) =
|di(S)−di(R)|
diR
∗100,i∈[1..8] (2) The vertical CDR (VCDR) is the ratio between the ver-tical size of the cup to that of the disc, as shown in Eq. (3). The vertical size is the maximum size in the vertical direction of the corresponding structure [Bha10].
VCDR=Vertical Cup Size
Vertical Disc Size (3)
In order to perform this evaluation, the healthy and the glaucoma group have been studied independently. For the Jaccard index and the VP, we have chosen the aver-age segmentation described in section 4.2 as the refer-ence R and each individual expert segmentation asS, evaluating the disc and the cup separately. Tables 1 and 2 contain the results of both measures, averaged for the two experts. The results show high similarity and low variability, suggesting an agreement between the experts and the reference. It also seems to be a stronger agreement on the disc segmentation than on the cup. In the segmentation of the disc, there are no signifi-cant differences between the healthy and the glaucoma group. However, the difference between the two groups when segmenting the cup is significant (p<0.001, two-sample t-test), giving better values in the glaucoma group.
Healthy Glaucoma Disc 0.96±0.02 0.95±0.03 Cup 0.79±0.11 0.86±0.10
Table 1: Average Jaccard similarity index (M±SD).
Healthy Glaucoma Disc 2.31±1.11 2.64±1.79 Cup 12.98±8.73 8.22±6.47 Table 2: Average Variability Percentage (M±SD). Table 3 shows the estimated VCDR from the expert seg-mentations and the correlation coefficientrbetween the VCDR of the two experts. It can be seen that the mean values of the VCDR are lower in the healthy group than in the glaucoma group, as it was expected. The corre-lation between the experts is high in both groups, but slightly higher in the glaucoma group, which is in ac-cordance with the previous measures in the cup. De-spite the results obtained for the healthy group, signif-icant differences between the VCDR of the two groups have been found (p<0.0001, two-samplet-test). This suggests that the VCDR can be estimated from the man-ual segmentations, obtained through the use of DCSeg.
Expert 1 Expert 2 r
Healthy 0.41±0.10 0.42±0.11 0.74 Glaucoma 0.60±0.17 0.60±0.17 0.88 Table 3: Average Estimated VCDR (M±SD) and cor-relation coefficientr.
5
CONCLUSIONS
In this work, we have presented an interactive tool called DCSeg for the segmentation of the optic disc and cup in monocular and stereo fundus images which has been used to build a new database of stereo retinal im-ages with their corresponding ground truth. The appli-cation also features a special mode to train clinicians to carry out this task. The database has been evalu-ated using several measures and we have found a good agreement between the experts, concluding that DCSeg is helpful to perform manual segmentations and esti-mate the cup-to-disc ratio.
As future work, our effort will be focused on the fur-ther development of the database, extending the number of ground truths with expert segmentations from any groups willing to collaborate with this project. For this purpose, a web version of DCSeg will be released in the next months. As the number of ground truth increases, a more advanced algorithm could be implemented to combine them into a unique reference segmentation, in-stead of using a simple average procedure. The usabil-ity of the DCSeg interface will also be improved based on user experience.
6
ACKNOWLEDGMENTS
This research has been supported by a Doctoral Schol-arship from the Spanish Government (AP2012-6800), and has also been partially funded by the Project PI12/02301 from the Fondo de Investigación Sanitaria, Instituto Carlos III (co-financed with Feder funds). The authors acknowledge the funding granted to the University of La Laguna by the Canarian Agency for Research, Innovation and Information Society, financed in an 85% by the European Social Fund.
7
REFERENCES
[Ala13] Alayon, S., Gonzalez de la Rosa, M., Fumero, F.J., et al., Variability between experts in defin-ing the edge and area of the optic nerve head. Archivos de la Sociedad Espanola de Oftalmolo-gia (English Edition), 88, no. 5, pp. 168–173, 2013.
[Bha10] Bhartiya, S., Gadia, R., Sethi, H.S., et al., Clinical evaluation of optic nerve head in glau-coma. Journal of Current Glaucoma Practice, 4, pp. 115–132, 2010.
[But12] Buteikiene, D., Paunksnis, A., Barzdziukas, V., et al., Assessment of the optic nerve disc and
excavation parameters of interactive and auto-mated parameterization methods. Informatica, 23, no. 3, pp. 335–355, 2012.
[Car08] Carmona, E.J., Rincón, M., García-Feijoó, J., et al., Identification of the optic nerve head with genetic algorithms. Artificial Intelligence in Medicine, 43, no. 3, pp. 243–259, 2008.
[Fum13] Fumero Batista, F.J., Garcia Llarena, S.J., Nunez Regalado, O., et al., MRSeg - herramienta interactiva para generar segmentaciones de refer-encia de imagenes medicas, Terrassa2013. [Fum11] Fumero, F., Alayon, S., Sanchez, J., et al.,
RIM-ONE: An open retinal image database for optic nerve evaluation. In 2011 24th International Symposium on Computer-Based Medical Sys-tems (CBMS), 2011, pp. 1–6.
[GA13] Gegundez-Arias, M.E., Marin, D., Bravo, J.M., et al., Locating the fovea center posi-tion in digital fundus images using threshold-ing and feature extraction techniques. Comput-erized Medical Imaging and Graphics, 37, no. 5-6, pp. 386–393, 2013,http://www.uhu. es/retinopathy/muestras/Provided_ Information.zip.
[Gia11] Giachetti, A., Chin, K., Trucco, E., et al., Multiresolution localization and segmentation of the optical disc in fundus images using inpainted background and vessel information. In 2011 18th IEEE International Conference on Image Process-ing (ICIP), 2011, pp. 2145–2148.
[Hoo03] Hoover, A., and Goldbaum, M., Locating the optic nerve in a retinal image using the fuzzy convergence of the blood vessels. IEEE Transac-tions on Medical Imaging, 22, no. 8, pp. 951–958, 2003.
[Iak14] Iakovidis, D.K., Goudas, T., Smailis, C., et al., Ratsnake: A versatile image annotation tool with application to computer-aided diagnosis. The Sci-entific World Journal, 2014, 2014.
[Jos10] Joshi, G., Sivaswamy, J., Karan, K., et al., Optic disk and cup boundary detection using re-gional information. In 2010 IEEE International Symposium on Biomedical Imaging: From Nano to Macro, 2010, pp. 948–951.
[Kal] Kalesnykiene, V., Kamarainen, J.k., Voutilainen, R., et al., DIARETDB1 diabetic retinopathy database and evaluation protocol.
[Per11] Perez-Rovira, A., MacGillivray, T., Trucco, E., et al., VAMPIRE: Vessel assessment and mea-surement platform for images of the REtina. Inter-national Conference of the IEEE Engineering in Medicine and Biology Society., 2011, pp. 3391– 3394, 2011.
[Siv14] Sivaswamy, J., Krishnadas, S.R., Chakravarty,
A., Joshi, G.D., Ujjwal, et al., A Comprehen-sive Retinal Image Dataset for the Assessment of Glaucoma from the Optic Nerve Head Analysis. JSM Biomed Imaging Data Pap 2(1): 1004, 2015. [Som11] Sommer, C., Straehle, C., Koethe, U., et al.,
"ilastik: Interactive learning and segmentation toolkit". In 8th IEEE International Symposium on Biomedical Imaging (ISBI 2011), 2011.
[Sta04] Staal, J., Abramoff, M., Niemeijer, M., et al., Ridge based vessel segmentation in color images of the retina. IEEE Transactions on Medical Imag-ing, 23, no. 4, pp. 501–509, 2004.
[Sto10] Stone, R.A., Ying, G.s., Pearson, D.J., et al., Utility of digital stereo images for optic disc eval-uation. Investigative Ophthalmology & Visual Science, 51, no. 11, pp. 5667–5674, 2010. [Tru13] Trucco, E., Ruggeri, A., Karnowski, T., et al.,
Validating retinal fundus image analysis algo-rithms: issues and a proposal. Investigative oph-thalmology & visual science, 54, no. 5, pp. 3546– 3559, 2013.
[Tec] Techno-Vision, P., Méthodes d’evaluation de systèmes de segmentation et d’indexation dédiées à l’ophtalmologie rétinienne.http:// messidor.crihan.fr/.
[Zha10] Zhang, Z., Yin, F.S., Liu, J., et al., ORIGA-light: An online retinal fundus image database for glaucoma analysis and research. In International Conference of the IEEE Engineering in Medicine and Biology Society (EMBC), 2010, pp. 3065– 3068.
[Zha13] Zhang, Z., Liu, J., Yin, F., et al., ACHIKO-K: Database of fundus images from glaucoma pa-tients. In 2013 8th IEEE Conference on Industrial Electronics and Applications (ICIEA), 2013, pp. 228–231.
[Zhe12] Zheng, Y., Hijazi, M.H.A., and Coenen, F., Automated "disease/no disease" grading of age-related macular degeneration by an image mining approach. Investigative Ophthalmology & Visual Science, 53, no. 13, pp. 8310–8318, 2012.