an exploratory analysis
Shelan S. Jeawak, Christopher B. Jones, and Steven Schockaert
Cardiff University, School of Computer Science and Informatics, Cardiff, UK {JeawakSS,JonesCB2,SchockaertS1}@cardiff.ac.uk
Abstract
The photo-sharing website Flickr has become a valuable informal information source in disciplines such as geography and ecology. Some ecologists, for instance, have been manually analysing Flickr to obtain information that is more up-to-date than what is found in traditional sources. While several previous works have shown the potential of Flickr tags for characterizing places, it remains unclear to what extent such tags can be used to derive scientifically useful information for ecologists in an automated way. To obtain a clearer picture about the kinds of environmental features that can be modelled using Flickr tags, we consider the problem of predicting scenicness, species distribution, land cover, and several climate related features. Our focus is on comparing the predictive power of Flickr tags with that of structured data from more traditional sources. We find that, broadly speaking, Flickr tags perform comparably to the considered structured data sources, being sometimes better and sometimes worse. Most importantly, we find that combining Flickr tags with structured data sources consistently, and sometimes substantially, improves the results. This suggests that Flickr indeed provides information that is complementary to traditional sources.
1998 ACM Subject Classification I.2.6 Learning
Keywords and phrases Social media, Volunteered Geographic Information, Ecology
Digital Object Identifier 10.4230/LIPIcs.COSIT.2017.21
1
Introduction
Social media websites such as Flickr1, Twitter2 and Facebook3 have become a popular
platform to share and find information. Flickr, for instance, hosts more than 10 billion photographs4, many of which are associated with textual data in the form of a title, description
and a set of tags that express what is in the photo. The availability of GPS systems in current electronic devices such as smartphones enables latitude and longitude coordinates to be recorded as meta-data. For a large number of photos on Flickr, these coordinates have been made publicly available5. Together with their textual descriptions, such photos can be regarded as Volunteered Geographic Information (VGI [11]). The coordinates and textual meta-data associated with Flickr photos have already proven valuable in many disciplines such as health[18], geography[4, 12], and ecology[1, 5].
Although there are many organizations that serve environmental data, the information they provide is far from complete [1]. The idea of using Flickr as a supplementary source of
1 http://www.flickr.com 2 http://www.twitter.com 3 http://www.facebook.com 4 http://expandedramblings.com/index.php/flickr-stats
5 We were able to crawl around 350M georeferenced Flickr photos in September 2015. © S. S.,Jeawak, C. B.,Jones and S.,Schockaert ;
environmental data is appealing for several reasons. For example, due to the fact that photos are often uploaded directly after they have been taken, Flickr can provide us with more up-to-date information than traditional citizen science datasets, which is important e.g. for monitoring the spread of invasive species and migration patterns of pollinators. Moreover, the information that is captured by Flickr tags is broader than what is normally recorded, and includes e.g. subjective assessments about the scenicness of a landscape. In fact, Flickr has already proven valuable as a resource for ecological analysis. However, ecologists are currently mostly analysing Flickr data manually. For example [5, 20] manually analysed the content of social media websites to assess its usefulness for ecology. Manually analysing Flickr is clearly limited and time-consuming. Moreover, both the structure and the volume of the data present practical challenges [5], compared to formal or semi-formal citizen science monitoring data [23]. Nonetheless, these studies prove that Flickr contains valuable information which could be used to support the available sources [1, 5]. All this highlights the need for automated methods for extracting environmental information from Flickr.
The main research questions we consider in this paper are whether it is possible to extract large amounts of high-quality environmental information from Flickr, and if so, how complementary this information is to publicly available environmental data sets. In particular, we test the usefulness of Flickr for predicting a broad set of environmental features: scenicness, species distribution, land cover, and climate data. Our main aim is to provide a clearer picture of the kinds of environmental characteristics for which scientifically useful information can be derived from Flickr. Our analysis in this paper will focus on features that we can ascribe to locations (e.g. there is a coniferous forest at this location) rather than to individual photos (e.g. this is a photo of a 7-spot ladybird). While the latter is also important, it requires solving a particular set of challenges beyond the scope of this paper (e.g. distinguishing photos of sightings from photos that are tagged with the name of a species for other reasons) and is difficult to evaluate given the lack of ground truth data. The remainder of this paper is organised as follows. Section 2 gives an overview of related work. Section 3 presents our methodology for making predictions from Flickr tags and from traditional data. In Section 4 we then provide a detailed discussion about our experimental results. Finally, Section 5 summarises our conclusions and plans for future work.
2
Related work
2.1
Citizen science related research
Considerable progress has been made in recent years in citizen science projects in the environmental sciences that recruit participants to contribute actively to particular campaigns such as in land cover mapping [9], hydrological surveys [17], ornithology and many forms of ecological study [6]. In parallel with these initiatives there is growing interest in the potential of “passive” survey methods that exploit social media to provide additional useful data. For instance, [27] analysed the visual features of the photographs on Flickr automatically to observe natural world features such as snow cover and a particular species of flower. In [28] photos from Flickr were used to estimate snow cover and vegetation cover, and compare these estimations with fine-grained ground truth collected by earth-observing satellites and ground stations. Both the text associated with Flickr photographs and their visual features were used in [16] to perform land-use classification. The approach was evaluated on two university campuses and three land-use classes were considered: Academic, Residential, and Sports. In [7] and [8], they classified a sample of georeferenced Flickr photos according to CORINE land cover classes. They also evaluated the use of Flickr photos in supporting Land Use/Land
Cover (LULC) classification for the city of Coimbra in Portugal and for comparison with Corine Land Cover (CLC) level 1 and level 2 classes. The results of this approach were evaluated manually by experts. Their results suggest that Flickr photos cannot be used as a single source to achieve this purpose but they could be helpful if combined with other sources of data.
The authors of [24] explored the relationship between CORINE land cover classes and the valuation of natural scenery, namely scenicness, scenic beauty, landscape beauty, aesthetics, or cultural ecosystem services (CES), through user evaluated georeferenced photos from the ScenicOrNot6 website. They employed the user’s rating of a photo in a specific area as an evaluation of the land cover of that area. The results of this study showed that the highest rated areas belong to the forest and semi natural areas, and water bodies classes. Measures of scenicness are important since they reflect human well-being and can be taken into consideration in land planning and decision-making processes. Nonetheless, people’s perceptions of landscapes are subjective and cannot easily be quantified [24]. Some authors have assessed the beauty of the landscape through groups of evaluators using images, videos and/or questionnaires [24, 19], while others used geographic information system (GIS) data such as elevation together with visual assessments and/or questionnaires to predict the scenicness [2, 21]. Another group of works, such as [3], [10], and [25], quantify landscape aesthetics according to the number of photos taken near a given location [3] or the number of people who published photos [10] in photo-sharing websites such as Flickr and Panoramio. Considering popularity on social media as a surrogate for the level of appreciation of a place might work with some types of landscapes, but the results might be liable to be biased towards more accessible places.
Another growing area of interest is in the use of social media data for ecological monitoring. For example, [1] examined Flickr biodiversity data quality by analysing its metadata and comparing it with ground-truth data, using Snowy owls and Monarch butterflies as a case study. They concluded that Flickr data has potential to add to knowledge of these species in terms of geographic, taxonomic, and temporal dimensions, which tends to be complementary to the information contained in other available sources. In another similar work, based on a manual analysis of Twitter posts, [5] confirm that social media mining for ecological analysis is as important as traditional monitoring and the features derived from Twitter could be integrated with and hence improve the value of existing sources of such information. In [20] the content of the Flickr photos was analysed manually to assess the quality of cultural ecosystem services and derive useful information to manage Singapore’s mangroves.
Despite all the efforts that have been made to explore the role of social media in obtaining or supplementing environmental information, research in this area is fairly new and research questions about its effectiveness still remain open.
2.2
Geo-spatial analysis of social media
Many recent studies have focused on analysing social media data, with the aim of extracting useful information in domains such as geography (e.g. [13]). In particular, there is a large number of studies that derive such information from georeferenced Flickr photos. For example, [12] described two methods for the automatic delineation of imprecise regions based on geotagged photos. The first one is a method based on kernel density estimation (KDE) and the second is based on one class support vector machines (SVMs). Similarly, [4] presents
6
an approach for automatically defining the geographic boundaries of vague regions by using one class support vector machines (SVMs) and learning multiple kernels. To describe regions, they rely on a combination of the Flickr tags of the photos that were tagged with the region’s name, and external features such as the land cover data, population count, elevation and the geographical coordinates (latitude and longitude) of Flickr photos that are tagged with the region’s name. They showed that their method performs better than the simpler methods described by [12]. Our work is analogous to these approaches, in applying support vector machine learning methods to Flickr tags in combination with other geo-spatial data, but we are concerned with characterizing and predicting information about the environment.
The authors of [22] presented and evaluated methods for automatically geo-referencing Flickr photos using the textual annotations of photos to predict the single most probable location where the image was taken. They showed that location-specific language models, based on sets of distinctive tags, can be estimated effectively by analysing the terms people use to describe images taken at particular locations. They demonstrated how to incorporate the GeoNames database and they defined extensions to improve their language models using tag-based smoothing and cell-based smoothing, and by leveraging spatial ambiguity. In [26], a language modelling approach was used to discover and characterize places of interest (POIs). They experimented with both Flickr data and Twitter data, finding that Flickr data on its own is more useful than Twitter data for this task, while combining both sources led to the best results. Similar to this latter work, we explore the possibility that sets of tags cannot just distinguish one location from another, but can contribute to classifying aspects of the environment.
3
Methodology
In the next section, we will consider a number of classification and regression problems that are aimed at assessing the value of Flickr as a source for environmental information. Here we first explain how locations are represented in these experiments. In particular, Section 3.1 explains how feature vectors describing locations can be obtained from the tags associated with georeferenced Flickr photos. In Section 3.2 we then describe what structured information sources will additionally be considered.
3.1
Modelling locations using Flickr tags
Many of the tags associated with Flickr photos tell us something about the locations where these photos were taken. For example, tags might refer to toponyms (e.g. United Kingdom, England, London), landmarks (e.g. London Eye, Westminster Abbey, Hyde Park) or land cover types (e.g. forest, beach, airport). Using the Flickr API, we collected the metadata of all geo-referenced Flickr photos that were uploaded before the end of September 2015, leading to a total of over 70 million photos with coordinates in Europe (which is the region our experiments will focus on).
Let L = {l1, ..., lm} be a set of (point) locations, each characterized by latitude and
longitude coordinates. Our aim is to associate with each of these locations a weighted bag of tags, intuitively encoding for each tag how often it occurs in photos near that location. To this end, we first use a BallTree7to retrieve the set F
l of all Flickr photos whose distance
to the considered locationl is at most D. Let us write Ut,c for the set of users who have
7
assigned tagtto a photo with coordinatesc. Then we can definen(t, l) =P
d(c,l)≤D|Ut,c|,
withdthe Haversine distance. Intuitively,n(t, l) is the number of times tagtappears among the photos inFl. However, to reduce the impact of bulk uploading, following [26], we count
a tag occurrence only once for all photos by the same user at the same location.
One problem with using n(t, l) to measure the importance of tagtfor locationl is that it gives equal weight to all photos, whereas intuitively we want photos which are closer tol to influence our characterization ofl more than photos which are further away. To this end, following [26], we use a Gaussian kernel to weight the tag occurrences:
w(t, l) = X d(c,l)≤D |Ut,c| ·exp −d 2 l, c 2σ2
whereσis a bandwidth parameter.
The weightw(t, l) still has the problem that common words (e.g.iphone) are given the same importance as more specific words. Intuitively, we want the weight of tagtto reflect how strongly it is associated with locationl. A standard way of measuring this in bag-of-words models is to use Positive Pointwise Mutual Information (PPMI), which essentially compares the actual number of occurrences with the expected number of occurrences (given how many tags occur overall nearl and how common the tagtis). Specifically, the weight of tagt in our bag-of-words representation of lis then given by:
PPMI(t, l) = max 0,log P(t, l) P(t)P(l) where: P(t, l) =w(t, l) N P(t) = P l0∈Lw(t, l0) N P(l) = P t0∈Tw(t0, l) N N= X t0∈T X l0∈L w(t0, l0)
withT the set of all tags that appear in the collection. Finally, each locationl is represented as a sparse vector, encoding the weightsPPMI(t, l) for all the tags inT.
3.2
Modelling locations using structured data
There is a wide variety of structured data that can be used to describe places. The most obvious type of structured data are the coordinates of the photo itself. Clearly, latitude and longitude degrees can be helpful for predicting a range of environmental phenomena (e.g. Southern areas of Europe tend to be warmer than Northern areas). In addition to geographic coordinates, we will consider the following sources of structured scientific data:
CORINE Land Cover 20068 is a European dataset which describes land cover with a 100-meter spatial resolution. CORINE uses three levels of description: a top level with 5 classes, an intermediate level with 15 classes and a detailed level with 44 classes. SoilGrids9 is a global raster dataset, which classifies locations into 116 types of soil, using
a 250 meter spatial resolution
The Digital Elevation Model over Europe (EU-DEM)10is a Europe-wide digital surface model, encoding elevation with a spatial resolution of about 30 meter.
8 http://www.eea.europa.eu/data-and-maps/data/corine-land-cover-2006-raster-2 9 https://www.soilgrids.org 10 http://www.eea.europa.eu/data-and-maps/data/eu-dem
European Population Map 200611 is a digital raster grid that reports the number of residents (night-time population) with a 100-meter spatial resolution.
WorldClim12 is a global raster dataset, containing average monthly recordings of the following climate features, over the period 1970-2000, using a 1 km spatial resolution: temperature, precipitation, solar radiation, wind speed and water vapor pressure. In this work, we convert the monthly averages reported in the dataset to a single annual average. To encode locations, we consider a feature vector that contains one binary feature for each CORINE land cover class (being 1 if the location belongs to that class and 0 otherwise), one binary feature for each SoilGrids class, and 9 real-valued features (encoding latitude, longitude, elevation, population, and the 5 climate features). The real-valued features have been normalised using the standard z-score. In experiments where both Flickr data and structured data are used, we simply concatenate the two corresponding feature vectors.
4
Experiments
In the following experiments, we evaluate how well we can predict a number of environmental features using Flickr tags and the considered structured data. For all experiments, we have set the maximum Haversine distance D (cluster radius) to 1 kilometre and the bandwidth
σto D/3. The choice ofDrepresents a trade-off, where larger values can potentially lead to better results but also lead to a higher computational cost. The choice ofσ=D/3 was found to be reasonable in a small set of initial experiments. To make predictions, we use Support Vector Machines (SVMs) for classification problems and Support Vector Regression (SVR) for regression problems. In both cases, we used the SVMlight implementation13[15].
For each experiment, the set of locationsLwas split into two-thirds for training, one-sixth for tuning the parameters of the SVM/SVR models, and one-sixth for testing.
4.1
Predicting the scenicness of a place
In this first experiment, we consider the problem of predicting people’s opinions of landscape beauty, using the UGC dataset from the ScenicOrNot website14as ground truth. This website
allows people to evaluate places in Britain by rating photos collected from Geograph15. The dataset contains 217,000 photos (at distinct locations), each of which has been rated by at least three people on a scale from 1 (not scenic) to 10 (very scenic). For 25,395 of the photos in this dataset, our Flickr collection did not contain any georeferenced photos within a 1 km radius. Therefore, we only report results for the remaining 191,605 photos (i.e. 88.3% of the full dataset). The number of Flickr photos within a 1km radius of these locations varies between 1 and 397982.
For this experiment,Lthus contains the locations of these 191,605 photos.Table 1 shows the results for three different variants: only using structured data, only using Flickr data, and combining both. Based on the tuning data, for the SVR model, we found a Gaussian kernel to be optimal when only structured data is used, and a linear kernel to be optimal otherwise. The results in Table 1 show the mean absolute error between the predicted
11 http://data.europa.eu/89h/jrc-luisa-europopmap06 12http://worldclim.org 13 http://www.cs.cornell.edu/people/tj/svm_light/ 14 http://scenic.mysociety.org/ 15 http://www.geograph.org.uk/
and actual scenicness scores, as well as the Spearman ρcorrelation between the rankings induced by both sets of scores. Note that the mean value of this data set is 4.372 and the standard deviations is around 1.6. While the differences are small, we find that using Flickr outperforms using structured data, and that combining both leads to the best results overall. Looking at what tags most influence the regression model, among the highest weighted tags we find terms relating to natural and open-country landscape such asscotland, highlands,
mountains andsea, while among the lowest weighted tags we find names of artificial and urban phenomena such asstation,bus,pubandrailway. This reinforces the finding from [24] that land cover categories are strongly correlated with scenicness scores.
We also tested whether the number of photos (or users) could be used to predict scenicness, as was suggested in [3, 25, 10] for particular restricted settings. However, we actually found a negative correlation of around -0.12 (resp. -0.1) between scenicness and the number of photos (resp. users who have posted photos) near a given location.
Table 1Results for predicting scenicness.
Dataset Mean Absolute Error Spearmanρ
Structured 1.031 0.556 Flickr 1.013 0.570 Structured + Flickr 1.006 0.581
4.2
Predicting species distribution
The next experiment we considered was to predict the distribution of species across Europe, using as ground truth the dataset of the European network of nature protected sites Natura 200016. This dataset contains information about 35,600 species from 7 classes: Amphibians,
Birds, Fish, Invertebrates, Mammals, Plants and Reptilia. In particular, it specifies which species occur at 26,425 different sites across Europe. For this experiment,Lis defined as the set of these sites.
For species that only occur at a few of the sites inL, it is clearly not possible to estimate a reliable distribution model. Therefore, we focused our evaluation on 100 species which occur at more than 500 sites. For each of these species, we consider a binary classification problem, i.e. predicting at which of the sites the species occurs. Note that as in all analyses we use all Flickr tags, some of which might include the species name. The results are reported in Table 2, showing that combining structured data with Flickr data leads to substantially better results than either structured data alone or Flickr data alone. Comparing Flickr with structured data directly is more difficult, as Flickr data led to a much higher precision whereas the structured data led to a much higher recall.
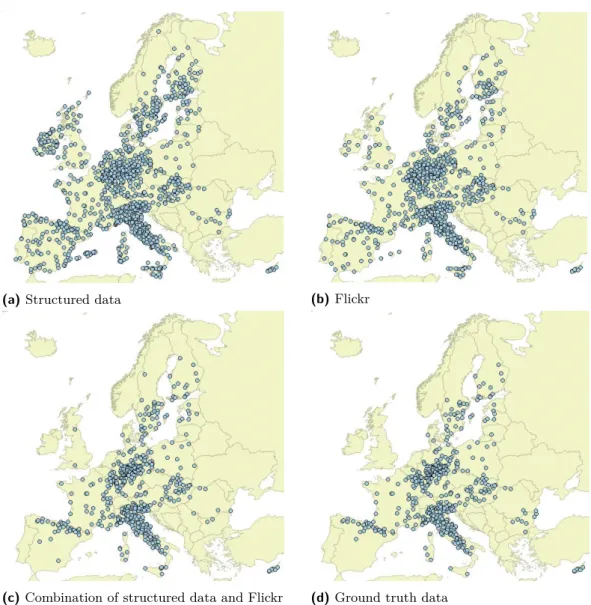
As an example, Figure 1 compares the predictions that were made by the different models with the ground truth for a particular species: the black woodpecker (dryocopus martius). For this species, the F1 scores were 0.594, 0.648 and 0.927 for structured data, Flickr data, and the combined data, respectively. This example shows that highly accurate distribution models can be learned for species that occur in sufficiently many sites. Interestingly, while the number of occurrences is overestimated in e.g. Spain and the UK when only Flickr data or only structured data is used, much more accurate predictions are made for these countries using the combined model. For species that have a more restricted geographic scope (in
16
terms of number of sites), it is likely that better results can be obtained by looking at a wider radius (i.e. choosingD1 km) and by specifically counting photos that mention the name of the species, as a separate feature. This is left as an issue for future work, however, as in this paper our focus is on assessing the overall usefulness of Flickr.
Table 2Results for predicting species distribution.
Dataset Precision Recall F1 Score Structured 0.241 0.568 0.338
Flickr 0.577 0.112 0.188 Structured + Flickr 0.650 0.506 0.569
4.3
Predicting CORINE land cover classes
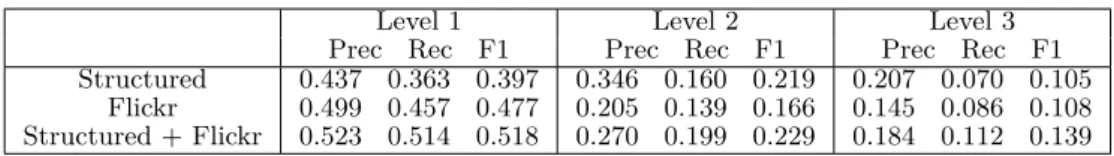
In this Section we consider the task of predicting CORINE land cover classes. For this experiment, we have used the same setLof sites as for species distribution. Since the task is about predicting CORINE land cover classes, for the results reported in this section we do not consider any CORINE features in the representations of the locations (as the CORINE data serve here as ground truth). We experimented with predicting CORINE land cover classification at levels 1, 2 and level 3, each time treating the task as a binary classification problem. The results are presented in Table 3, showing again that combining structured data and Flickr data clearly leads to the best results. The difference in performance between structured data alone and Flickr data alone is mixed, with e.g. Flickr data performing better at level 1 but worse at level 2. For level 1, we found that Flickr outperformed structured data in 4 out of the 5 classes, with the ‘artificial surfaces’ class being the only exception. This seems related to the small number of sites for this particular class (e.g. only 4% of the training data sites belong to this class). To illustrate how Flickr tags are used to predict CORINE classes, Table 4 shows the 5 tags with highest weight in the SVM classifier for each of the classes at level 1.
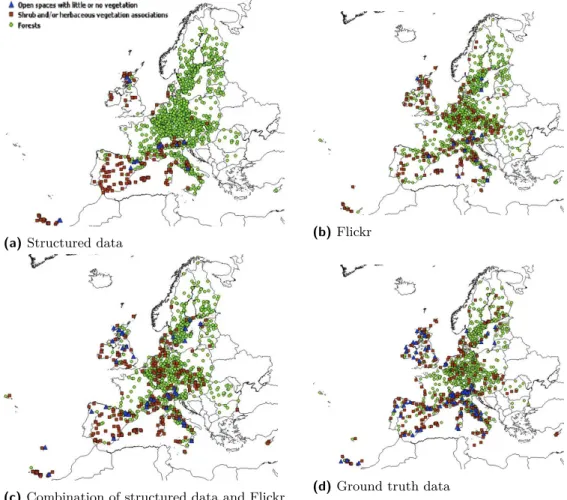
By far the largest CORINE class at level 1 is ‘Forest & semi natural areas’. At level 2 this class has three subclasses. The predictions of the three models for these three subclasses are compared with the ground truth in Figure 2. Clearly, in this case, the structured data has resulted in a model that is too simplistic, essentially segmenting Europe into forest areas and ‘Shrub and/or herbaceous vegetation’. Flickr data alone leads to more faithful predictions in these subclasses, but instances of ‘open spaces with little or no vegetation’ are underreported. This issue is alleviated in the combined model.
Table 3Results for predicting CORINE land cover classes, at levels 1, 2 and 3. Level 1 Level 2 Level 3 Prec Rec F1 Prec Rec F1 Prec Rec F1 Structured 0.437 0.363 0.397 0.346 0.160 0.219 0.207 0.070 0.105
Flickr 0.499 0.457 0.477 0.205 0.139 0.166 0.145 0.086 0.108 Structured + Flickr 0.523 0.514 0.518 0.270 0.199 0.229 0.184 0.112 0.139
4.4
Predicting climate data
In the last experiment, we assess the usefulness of Flickr tags in the task of predicting climate data. We again use the same set of sitesL as in the species distribution experiment. In this case, we omit all the climate related features from the feature vector representations as
(a)Structured data (b)Flickr
(c) Combination of structured data and Flickr (d)Ground truth data Figure 1Prediction of the black woodpecker distribution across Europe.
Table 4Top 5 Flickr tags for CORINE level 1 classes in the SVM models.
Artificial surfaces Agricult. areas Forest & semi nat. areas Wetlands Water bodies Babenhausen field wald bog lake
Ceskedrahy grass forest moor island Meppen horse mountains marsh sea
Tuplice vineyard woods swamp boat Deutsche Reichsbahn meadow mountain saline sailing
they constitute the ground truth. We consider 5 different regression problems: predicting average temperature, average precipitation, average solar radiation, average wind speed, and average water vapor pressure. The results are reported in Table 5, in terms of mean absolute error (MAE) and Spearmanρ. Overall, structured data and Flickr data perform comparably. However, by far the best results are obtained when combining both types of data, showing again that the information we obtain from Flickr is complementary to what is available as structured data. As an example of how Flickr tags are used by the regression model, the tag
(a)Structured data (b)Flickr
(c)Combination of structured data and Flickr (d)Ground truth data
Figure 2Prediction of subclasses of the CORINE class “Forest & semi natural areas”.
‘sea’ has a very high weight in the model for predicting water vapor pressure, while the tag ‘mountain’ has a very low weight in this model. In Figure 3, we illustrate the predictions made by the different models for solar radiation. Clearly, the model based on structured data is too simplistic, mostly capturing the impact of latitude.
Table 5Results for predicting average climate data.
Mean STDEV Structured Flickr Struct+ Flickr value MAE ρ MAE ρ MAE ρ
Temperature(°C) 9.268 3.490 0.789 0.938 1.623 0.814 0.728 0.940 Precipitation(mm) 66.625 24.827 13.173 0.709 11.660 0.689 10.523 0.755 Solar Rad(kJm−2day−1) 11478 2388 1726.5 0.747 926.3 0.832 484.8 0.939
Wind Speed(ms−1) 3.605 1.126 0.508 0.791 0.545 0.756 0.429 0.846
Water Vapor Press(kPa) 0.958 0.186 0.060 0.903 0.083 0.719 0.053 0.914
5
Conclusions and future work
In this paper, we have analysed how Flickr tags can be used to supplement structured scientific data in tasks that rely on characterizing the environment. To this end, we have considered four different evaluation tasks. The first experiment aimed to predict the scenicness of a place,
(a)Structured data (b)Flickr
(c) Combination of structured data and Flickr (d)Ground truth data Figure 3Prediction of solar radiation (in kJm−2day−1).
as assessed subjectively by humans on the ScenicOrNot website. In the second experiment, we focused on modelling the distribution of species across Europe, using observations from the Natura 2000 dataset as ground truth. The third experiment consisted in predicting CORINE land cover categories. Finally, we looked at predicting five climate related properties. Each time, we compared three different setups. In a first setup, we used features that were derived from a number of structured scientific datasets. In the second setup, we used a bag of words representation, capturing how strongly each tag is associated with photos that appear near a considered location. In the final setup, we combined both data sources, concatenating the corresponding feature vectors.
Our main finding is that the combined model substantially and consistently outperformed the model that only relied on structured data sources. This strongly suggests that Flickr can indeed be valuable, as a supplement to more traditional datasets in environmental analyses. While it may be possible to reduce some of the performance gap by considering additional scientific datasets, we found the versatility of Flickr data that was displayed in the four experiments to be remarkable.
There are a number of directions for future work. First, it may be possible to improve the way we have combined structured features with bag-of-words features by learning a low-dimensional vector space embedding that captures both kinds of data, similar to how embeddings of Wikipedia entities were learned in [14] by combining bag-of-words representations with semantic descriptions from WikiData. Second, many of the considered features are strongly spatially autocorrelated. As such, we can expect more accurate predictions by formulating some of the considered tasks as collective classification problems, where we would intuitively take into account the predictions for neighbouring sites when making a prediction. Finally, it remains unclear to what extent Flickr can be used for more fine-grained ecological analyses, e.g. at the level of individual sightings.
Acknowledgments
Shelan Jeawak has been sponsored by HCED Iraq. Steven Schockaert has been supported by ERC Starting Grant 637277.
References
1 Vijay V Barve.Discovering and developing primary biodiversity data from social networking sites. PhD thesis, University of Kansas, 2015.
2 Ian D Bishop and David W Hulse. Prediction of scenic beauty using mapped data and geographic information systems. Landscape and urban planning, 30(1-2):59–70, 1994.
3 Stefano Casalegno, Richard Inger, Caitlin DeSilvey, and Kevin J Gaston. Spatial covariance between aesthetic value & other ecosystem services. PloS one, 8(6):e68437, 2013.
4 Eduardo Cunha and Bruno Martins. Using one-class classifiers and multiple kernel learning for defining imprecise geographic regions. International Journal of Geographical Informa-tion Science, 28(11):2220–2241, 2014.
5 Stefan Daume. Mining twitter to monitor invasive alien species—an analytical framework and sample information topologies. Ecological Informatics, 31:70–82, 2016.
6 Janis L. Dickinson, Benjamin Zuckerberg, and David N. Bonter. Citizen science as an ecological research tool: Challenges and benefits. Annual Review of Ecology, Evolution, and Systematics, 41:149 – 172, Jan-12-2010 2010.
7 Jacinto Estima, Cidália C Fonte, and Marco Painho. Comparative study of land use/cover classification using flickr photos, satellite imagery and corine land cover database. In Pro-ceedings of the 17th AGILE International Conference on Geographic Information Science, Castellon, Spain, pages 1–6, 2014.
8 Jacinto Estima and Marco Painho. Photo based volunteered geographic information initiat-ives: A comparative study of their suitability for helping quality control of corine land cover.
International Journal of Agricultural and Environmental Information Systems (IJAEIS), 5(3):73–89, 2014.
9 Steffen Fritz, Ian McCallum, C. Schill, C. Perger, L. See, D. Schepaschenko, M. van der Velde, F. Kraxner, and M. Obersteiner". Geo-wiki: An online platform for improving global land cover. Environmental Modelling & Software, 31:110 – 123, 2012.
10 Gianfranco Gliozzo, Nathalie Pettorelli, and Mordechai Muki Haklay. Using crowdsourced imagery to detect cultural ecosystem services: a case study in south wales, uk.Ecology and Society, 21(3), 2016.
11 Michael F Goodchild. Citizens as sensors: the world of volunteered geography.GeoJournal, 69(4):211–221, 2007.
12 Christian Grothe and Jochen Schaab. Automated footprint generation from geotags with kernel density estimation and support vector machines. Spatial Cognition & Computation, 9(3):195–211, 2009.
13 Livia Hollenstein and Ross Purves. Exploring place through user-generated content: Using flickr tags to describe city cores. Journal of Spatial Information Science, 1, 2010.
14 Shoaib Jameel and Steven Schockaert. Entity embeddings with conceptual subspaces as a basis for plausible reasoning. InProceedings of the 22nd European Conference on Artificial Intelligence, pages 1353–1361, 2016.
15 Thorsten Joachims. Making large-scale svm learning practical. Technical report, SFB 475: Komplexitätsreduktion in Multivariaten Datenstrukturen, Universität Dortmund, 1998.
16 Daniel Leung and Shawn Newsam. Exploring geotagged images for land-use classification. InProceedings of the ACM multimedia 2012 workshop on Geotagging and its applications in multimedia, pages 3–8, 2012.
17 Christopher S. Lowry and Michael N. Fienen. Crowdhydrology: Crowdsourcing hydrologic data and engaging citizen scientists. Ground Water, 51(1):151–156, 2013.
18 Michael J Paul, Abeed Sarker, John S Brownstein, Azadeh Nikfarjam, Matthew Scotch, Karen L Smith, and Graciela Gonzalez. Social media mining for public health monitoring and surveillance. InPacific Symposium on Biocomputing, pages 468–79, 2016.
19 Chad D Pierskalla, Jinyang Deng, and Jason M Siniscalchi. Examining the product and process of scenic beauty evaluations using moment-to-moment data and GIS: The case of Savannah, GA. Urban Forestry & Urban Greening, 19:212–222, 2016.
20 Daniel R Richards and Daniel A Friess. A rapid indicator of cultural ecosystem service usage at a fine spatial scale: content analysis of social media photographs. Ecological Indicators, 53:187–195, 2015.
21 Uta Schirpke, Erich Tasser, and Ulrike Tappeiner. Predicting scenic beauty of mountain regions. Landscape and Urban Planning, 111:1–12, 2013.
22 Pavel Serdyukov, Vanessa Murdock, and Roelof Van Zwol. Placing flickr photos on a map. In Proceedings of the 32nd international ACM SIGIR conference on Research and development in information retrieval, pages 484–491, 2009.
23 S Andrew Sheppard, Andrea Wiggins, and Loren Terveen. Capturing quality: retaining provenance for curated volunteer monitoring data. InProceedings of the 17th ACM confer-ence on Computer supported cooperative work & social computing, pages 1234–1245, 2014.
24 B Stadler, R Purves, and M Tomko. Exploring the relationship between land cover and subjective evaluation of scenic beauty through user generated content. In Proceedings of the 25th International Cartographic Conference, 2011.
25 Patrizia Tenerelli, Urška Demšar, and Sandra Luque. Crowdsourcing indicators for cultural ecosystem services: a geographically weighted approach for mountain landscapes.Ecological Indicators, 64:237–248, 2016.
26 Steven Van Canneyt, Steven Schockaert, and Bart Dhoedt. Discovering and characterizing places of interest using flickr and twitter. Hospitality, Travel, and Tourism: Concepts, Methodologies, Tools, and Applications: Concepts, Methodologies, Tools, and Applications, page 393, 2014.
27 Jingya Wang, Mohammed Korayem, and David Crandall. Observing the natural world with flickr. InProceedings of the IEEE International Conference on Computer Vision Workshops, pages 452–459, 2013.
28 Haipeng Zhang, Mohammed Korayem, David J Crandall, and Gretchen LeBuhn. Mining photo-sharing websites to study ecological phenomena. InProceedings of the 21st interna-tional conference on World Wide Web, pages 749–758, 2012.