FINAL REPORT
Energy Efficient End-Use Equipment (4E)
International Energy Agency
SSL Annex Task 2 and Task 3
10 SEPTEMBER 2014
Solid State Lighting Annex:
Solid State Lighting Annex 2013 Interlaboratory Comparison Final Report
This report was prepared by International Energy Agency 4E Solid State Lighting Annex Task 2 and Task 3.
Authors:
Yoshi Ohno, Task 2 Leader (primary author) Koichi Nara, Task 3 Leader
Elena Revtova, VSL – Nucleus Lab leader Wei Zhang, NLTC – Nucleus Lab leader
Tatsuya Zama, AIST, NMIJ – Nucleus Lab leader Cameron Miller, NIST–Nucleus Lab leader
The authors are grateful for the reviews by and support from all Annex experts and Management Committee members. Particular thanks to Mike Scholand, Operating Agent Support who provided editing of text and figures. Thanks also to Peter Bennich, Management Committee chairman and Nils Borg, Operating Agent of the IEA 4E SSL Annex.
Abstract:
This Interlaboratory Comparison (IC 2013) for the measurement of solid state lighting (SSL) products was conducted by International Energy Agency (IEA) 4E SSL Annex between October 2012 and August 2013. Fifty-four laboratories from 18 countries participated in this comparison for measurements of photometric, colorimetric, and electrical quantities of several different types of SSL products. In addition, measurement data from the proficiency testing of 35 laboratories in the National Voluntary Laboratory Accreditation Program (NVLAP) Energy Efficient Lighting Products for SSL and in the National Institute of Standards and Technology’s Measurement Assurance Program are linked to IC 2013. And, data from further 21 laboratories from the Asia Pacific Laboratory Accreditation Cooperation (APLAC) proficiency test T088, are also linked to IC 2013, making it a comparison of test results from 110 laboratories and 123 sets of data. Measurements of luminous flux, luminous efficacy, active power, RMS current, power factor, chromaticity x, y, correlated colour temperature, and colour rendering index were compared. IC 2013 was also designed so that the results can be recognised as proficiency testing for SSL testing laboratory accreditation programmes worldwide. The differences of participants results from the reference values as well as z' scores (defined in ISO 13528) and En numbers (defined in ISO 13528 and ISO/IEC 17043) are all presented, and problems and
Disclaimer: The Authors have made their best endeavours to ensure the accuracy and reliability of the data used herein, however neither they nor the IEA 4E Implementing Agreement make warranties as to the accuracy of data herein nor accept any liability for any action taken or decision made based on the contents of this report.
About the IEA 4E Solid State Lighting Annex
The SSL Annex was established in 2010 under the framework of the International Energy Agency’s Energy Efficient End-use Equipment (4E) Implementing Agreement to provide advice to its member countries seeking to implement quality assurance programs for SSL lighting. This international collaboration brings together the governments of Australia, Denmark, France, Japan, The Netherlands, Republic of Korea, Sweden, United Kingdom and United States of America. China works as an expert member of the 4E SSL Annex. The SSL Annex closed its first term in June 2014 and started on its second five-year term in July 2014. This report is part of the final reporting from the Annex’s first term. Further information on the 4E SSL Annex is available from:
http://ssl.iea-4e.org/
About the IEA Implementing Agreement on Energy Efficient End-Use Equipment (4E)
4E is an International Energy Agency (IEA) Implementing Agreement established in 2008 to support
governments to formulate effective policies that increase production and trade in efficient electrical end-use equipment. Globally, electrical equipment is one of the largest and most rapidly expanding areas of energy consumption which poses considerable challenges in terms of economic development, environmental protection and energy security. As the international trade in appliances grows, many of the reputable multilateral organisations have highlighted the role of international cooperation and the exchange of information on energy efficiency as crucial in providing cost-effective solutions to climate change. Twelve countries have joined together to form 4E as a forum to cooperate on a mixture of technical and policy issues focused on increasing the efficiency of electrical equipment. But 4E is more than a forum for sharing
information – it initiates projects designed to meet the policy needs of participants. Participants find that pooling of resources is not only an efficient use of available funds, but results in outcomes which are far more comprehensive and authoritative. The main collaborative research and development activities under 4E include:
• Electric Motor Systems (EMSA) • Mapping and Benchmarking • Solid State Lighting (SSL) • Electronic Devices and Networks
Current members of 4E are: Australia, Austria, Canada, Denmark, France, Japan, Korea, Netherlands, Switzerland, Sweden, UK and USA. Further information on the 4E Implementing Agreement is available from: www.iea-4e.org
The Solid-State Lighting (SSL) Annex was established in 2010 under the framework of the International Energy Agency’s (IEA) Energy Efficient End-Use Equipment (4E) Implementing Agreement. The IEA 4E SSL Annex (simply “SSL Annex” hereafter) works to assist governments of member countries in promoting SSL as an effective means to reduce energy consumption worldwide. The SSL Annex works internationally to develop tools and recommendations and exchange information to promote harmonised regulations and government programmes addressing challenges with SSL technologies.
Starting in 2011, the SSL Annex launched an initiative that sought to address the lack of a global laboratory performance assessment scheme. This initiative was designed to help support harmonisation of SSL testing around the world by developing an approach to compare and assess the measurement capabilities of testing laboratories, and support accreditation programs for testing laboratories measuring LED lighting products. This work of the SSL Annex provides a useful basis for an interlaboratory comparison in the absence of a common global test standard.
For these purposes, Task 2 (SSL Testing) and Task 3 (Accreditation) of SSL Annex jointly developed and conducted an interlaboratory comparison (IC) program, named IC 2013. The IC 2013 was conducted between October 2012 and August 2013. Fifty-four laboratories from 18 countries participated in this study, comparing measurements of photometric, colorimetric, and electrical quantities of several different types of SSL
products. In addition, measurement data from the proficiency testing of 35 laboratories in the National Voluntary Laboratory Accreditation Program (NVLAP) Energy Efficient Lighting Products (EELP) for SSL and in the National Institute of Standards and Technology’s (NIST) Measurement Assurance Program (MAP) are linked to IC 2013. And data from further 21 laboratories from the Asia Pacific Laboratory Accreditation Cooperation (APLAC) proficiency test T088, are linked to IC 2013, making it a comparison of test results from 110 laboratories and 123 sets of data.
Five different types of artefact were used in this IC; omnidirectional LED lamp, directional LED lamp, low-power-factor LED lamp (≈0.5 on the average), high CCT LED lamp/luminaire, and incandescent lamp operated on AC voltage, with a few optional types. Measurement of luminous flux, luminous efficacy, active power, RMS current, power factor, chromaticity x and y, correlated colour temperature, and colour rendering index were compared. IC 2013 was also designed so that the results could be recognised as proficiency testing for SSL testing accreditation programmes worldwide. The z' scores (defined in ISO 13528) and En numbers
(defined in ISO 13528 and ISO/IEC 17043) were evaluated as criteria for use by accreditation bodies. IC 2013 has been recognised so far by National Voluntary Laboratory Accreditation Program (NVLAP) in USA, International Accreditation Japan (IA-Japan), China National Accreditation Service of Conformity Assessment (CNAS, China), Korea Laboratory Accreditation Scheme (KOLAS), and International Accreditation New Zealand (IANZ), and is expected to be recognised by more accreditation bodies.
IC 2013 provided experience in PT on the measurement of SSL products, which supports SSL regulations and government programmes, and also provided useful technical findings for the SSL community. The results for total luminous flux and chromaticity x, y showed that the artefacts measured by most of the laboratories agreed to within ± 5 % in luminous flux and within ± 0.005 in x, y, overall for all artefact types, which are at expected levels of agreement. These results verified the levels of uncertainty of measurements by
without participating in such an interlaboratory comparison.
The electrical measurement results also identified some issues. The variations in measured RMS current for LED lamps were primarily within ± 3 % (omnidirectional lamp) to ± 15 % (low power-factor lamp), with some deviations much larger than expected (up to 38 %), resulting in many high values of z’ score and En number.
This result indicates that the generic uncertainty and the participants’ reported uncertainties for RMS current were significantly underestimated. However, looking at the results of luminous flux and chromaticity for low-power factor lamps, the effect of the RMS current variations on photometric and colorimetric values was found not significant, and thus it would appear that agreement in measured RMS current is not very critical. This is explained by the finding that deviations in RMS current were strongly correlated with power factor in the direction to cancel the changes in active power, though not all the cases. The variations in measured power factor were also larger than expected, mostly within ± 0.02 to ± 0.1 depending on the artefact type. These large variations in the electrical measurements may be caused by differences in the characteristics of the AC power supplies used by the participants, in particular, their output impedance. This is one of the remaining issues for the test methods in use today for LED lighting products, and future improvements are expected.
The uncertainties reported by the participants were found to be in a very large range (often more than two orders of magnitude), and were often significantly underestimated. Some laboratories reported unreasonably small uncertainties (e.g., 0.0001 in chromaticity x, y) or unreasonably large uncertainties (e.g., 10 % in luminous flux or 0.02 in chromaticity x, y). Several laboratories (not those linked) did not report uncertainties at all or did not report uncertainty of any colour quantities (i.e., chromaticity x, y, CCT, CRI). From these findings, it would appear that uncertainty evaluation, especially for colour quantities, is still very difficult for the SSL industry, and reported uncertainties are often not reliable. Practical methods and tools for
uncertainty evaluation of measurements, as well as educational documents and training for the SSL industry on practical uncertainty evaluation are urgently needed.
In addition to the differences of participants results from the reference values, both z' scores and En numbers
were calculated in IC 2013 for possible use by accreditation bodies. These results show that some
laboratories would pass on En number but fail on z’ score or vice versa. In particular, there were some cases
where laboratories claiming large uncertainties would pass on En number though the deviations in their
results were very large. Thus, the use of En number alone can be problematic when measurement variations
need to be limited by the accreditation programme. In practice, the En number is suitable for the purpose of
assessing the validity of claimed uncertainties (e.g., in calibration laboratory accreditation). The z’ score is suitable for the purpose of testing laboratory accreditation, which examines a laboratory’s competence and compliance to a test method which is developed to limit measurement variations as is often required in product certification activities. For laboratory accreditation programmes serving both purposes (i.e., serving for product certification activities as well as certifying the reported uncertainties), the use of the En number
and z’ score would be appropriate. In this study, it was found that the En number could be problematic where
laboratories had difficulty in uncertainty evaluation, as shown in IC 2013 for colour quantities. And, it was found that the z' score could be problematic if the denominator values were not appropriately specified, as was the case of RMS current measurements in this IC. The results of IC 2013 may be utilised for future SSL proficiency testing using z' score or a similar metric.
test method was needed and developed by the SSL Annex. A solution for international harmonisation of SSL testing and accreditation would be to use one international test method for SSL products, which will be published soon by the International Commission on Illumination (CIE). Countries would then choose whether to harmonise to this test method standard based on their own needs and regulatory requirements, enabling worldwide mutual recognition of SSL product testing and laboratory accreditation.
The IC 2013 provided many laboratories in many countries with new knowledge and experience in PT for the measurement of SSL products. It also established a basis to promote SSL laboratory testing accreditation world-wide in support of regulations and government programmes to further accelerate the development of SSL.
1
Introduction ... 1
2
Protocol of Comparison ... 4
3
Timetable ... 4
4
List of Participants ... 5
5
Description of the Artefacts ... 9
6
Measurands ... 12
7
Assigned Values and Data Analysis ... 12
z’ score ... 12 7.1 En number ... 13 7.2 Use of z’ and En ... 13 7.3
8
Results of Reference Laboratory Measurements ... 14
9
Results of the Participants Measurements ... 17
Differences in measurement results ... 18
9.1 9.1.1 Total luminous flux ... 19
9.1.2 Luminous efficacy ... 22
9.1.3 RMS current ... 25
9.1.4 Active Power... 28
9.1.5 Chromaticity x ... 31
9.1.6 Chromaticity y ... 34
9.1.7 Correlated Colour Temperature (CCT) ... 37
9.1.8 Colour Rendering Index (CRI) Ra ... 40
9.1.9 Power factor ... 43
9.1.10 Comparison of sphere and goniophotometer ... 46
9.1.11 Results of optional artefacts... 48
9.1.12 Discussions of the results of differences ... 51
Uncertainties reported ... 55 9.2 9.2.1 Discussion ... 59 z’ scores ... 60 9.3 9.3.1 I-AC lamp ... 61 9.3.2 LPF lamps ... 63
9.3.3 Summary and Discussion on z’ score results ... 65
En numbers ... 66
9.4 9.4.1 Incandescent – Alternating Current (I-AC) lamp ... 66
9.4.2 Low Power Factor (LPF) lamp ... 68
9.4.3 Summary and discussion on En number results ... 71
10
Conclusions ... 72
References ... 74
Appendix 1. Uncertainty Budget for σ
ˆ and
u
u
u
u
X X X Xin the calculation of z’ ... 75
i. Denominator for z’ ... 75
ii. Uncertainty budget for σˆ ... 75
Table 2-1. List of Reference Laboratories ... 4
Table 3-1. Timetable of SSL Annex IC 2013 ... 4
Table 4-1. List of Participants under AIST, NMIJ, approved to be listed ... 5
Table 4-2. List of Participants under VSL, approved to be listed ... 6
Table 4-3. List of Participants under NIST, approved to be listed (including two direct participants to IC 2013 and 35 laboratories linked from NVLAP PT or NIST MAP) ... 6
Table 4-4. List of Participants under NLTC, approved to be listed ... 8
Table 4-5. Correspondence between Laboratory Numbers and Lab Codes... 9
Table 5-1. AIST, NMIJ Artefacts and their Properties ... 10
Table 5-2. VSL Artefacts and their Properties ... 11
Table 5-3. NIST and NVLAP PT/NIST MAP Artefacts and their Properties ... 11
Table 5-4. NLTC and APLAC PT Artefacts and their Properties ... 11
Table 8-1. Measurement results of one of the artefact sets measured by NIST... 14
and after transportation, for luminous flux and RMS current ... 15
Figure 8-2. Examples of relative differences between two measurements by Reference Laboratories before and after transportation, for active power and luminous efficacy ... 16
Figure 8-3. Examples of differences between two measurements by Reference Laboratories before and after transportation, for chromaticity x and y ... 16
Figure 8-4. Examples of differences between two measurements by Reference Laboratories before and after transportation, for CCT and CRI Ra ... 17
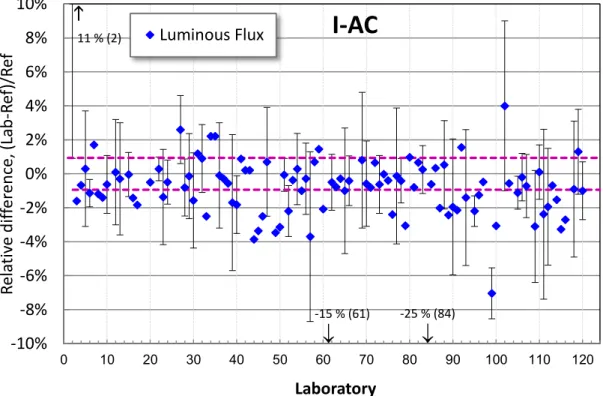
Figure 9-1. Relative differences of total luminous flux for Incandescent lamp AC operation (I-AC) ... 19
Figure 9-2. Relative differences of total luminous flux for omnidirectional LED lamp (OD) ... 19
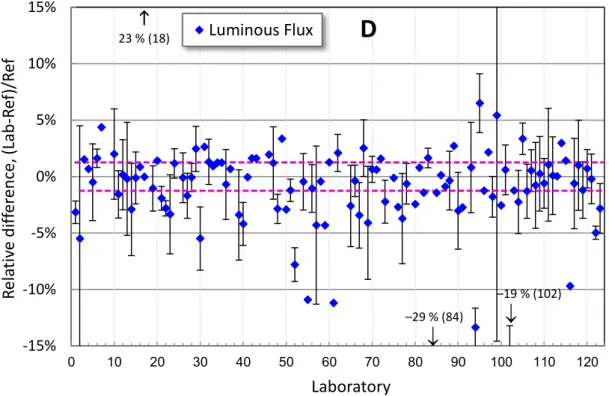
Figure 9-3. Relative differences of total luminous flux for directional LED lamp (D) ... 20
Figure 9-4. Relative differences of total luminous flux for low power factor lamp (LPF) ... 20
Figure 9-5. Relative differences of total luminous flux for high CCT lamp (HCCT) ... 21
Figure 9-6. Summary of relative differences of total luminous flux. The bars show robust standard deviations of the relative differences of all laboratories for each type of lamp. ... 21
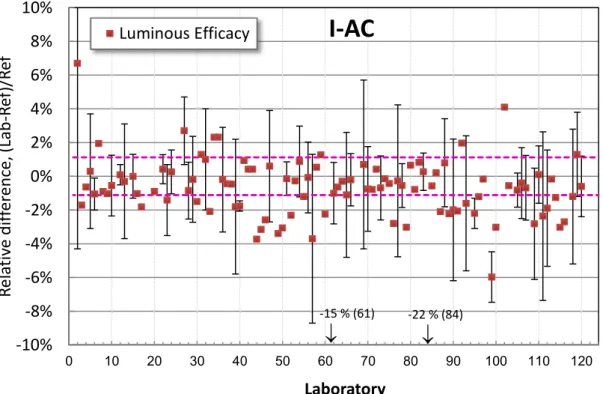
Figure 9-7. Relative differences of luminous efficacy for Incandescent lamp, AC operation (I-AC) ... 22
Figure 9-8. Relative differences of luminous efficacy for omnidirectional LED lamp (OD) ... 22
Figure 9-9. Relative differences of luminous efficacy for directional LED lamp (D) ... 23
Figure 9-10. Relative differences of luminous efficacy for low power factor lamp (LPF) ... 23
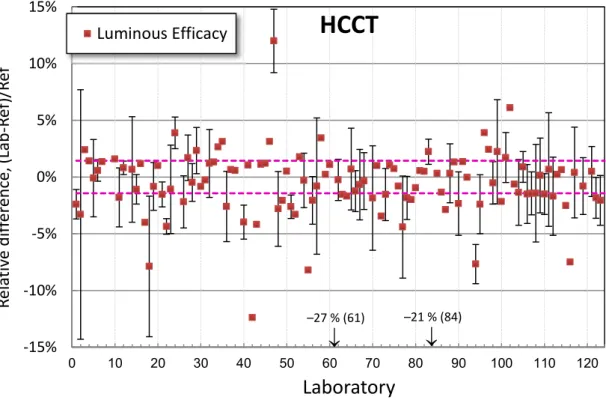
Figure 9-11. Relative differences of luminous efficacy for high CCT lamp (HCCT) ... 24
Figure 9-12. Summary of relative differences of luminous efficacy. The bars show the robust standard deviations of the relative differences of all laboratories for each type of lamp. ... 24
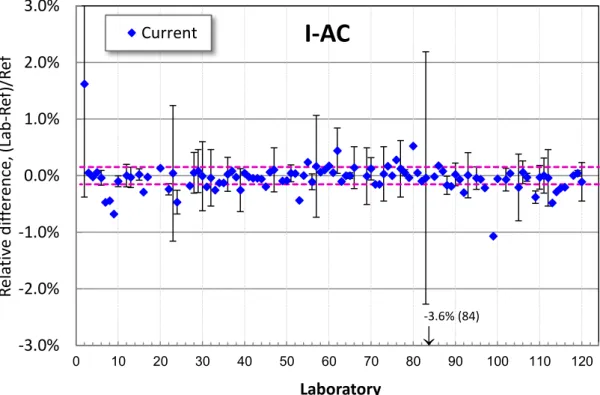
Figure 9-13. Relative differences of RMS current for Incandescent lamp AC operation (I-AC) ... 25
Figure 9-14. Relative differences of RMS current for omnidirectional LED lamp (OD) ... 25
Figure 9-15. Relative differences of RMS current for directional LED lamp (D) ... 26
Figure 9-16. Relative differences of RMS current for low power factor lamp (LPF) ... 26
Figure 9-17. Relative differences of RMS current for high CCT lamp (HCCT). The data of NIST-HCCT are excluded in this figure since current is the set parameter for NIST-HCCT ... 27
Figure 9-18. Summary of relative differences of RMS current. The bars show the robust standard deviations of the relative differences of all laboratories for each type of lamp ... 27
Figure 9-19. Relative differences of active power for Incandescent lamp AC operation (I-AC) ... 28
Figure 9-20. Relative differences of active power for omnidirectional LED lamp (OD) ... 28
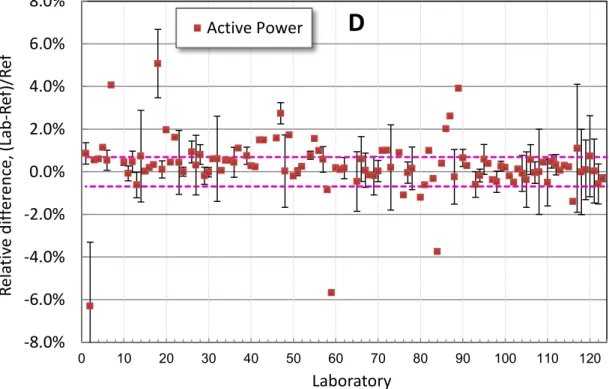
Figure 9-21. Relative differences of active power for directional LED lamp (D) ... 29
Figure 9-22. Relative differences of active power for lower power factor lamp (LPF) ... 29
Figure 9-23. Relative differences of active power for high CCT lamp (HCCT) ... 30
Figure 9-24. Summary of relative differences of active power. The bars show the robust standard deviations of the relative differences of all laboratories for each type of lamp ... 30
Figure 9-25. Differences of chromaticity x for Incandescent lamp AC operation (I-AC) ... 31
Figure 9-29. Differences of chromaticity x for high CCT lamp (HCCT) ... 33
Figure 9-30. Summary of differences of chromaticity x. The bars show the robust standard deviations of the differences of all laboratories for each type of lamp ... 33
Figure 9-31. Differences of chromaticity y for Incandescent lamp AC operation (I-AC) ... 34
Figure 9-32. Differences of chromaticity y for omnidirectional LED lamp (OD) ... 34
Figure 9-33. Differences of chromaticity y for directional LED lamp (D) ... 35
Figure 9-34. Differences of chromaticity y for low power factor lamp (LPF) ... 35
Figure 9-35. Differences of chromaticity y for high CCT lamp (HCCT) ... 36
Figure 9-36. Summary of the differences of chromaticity y. The bars show the robust standard deviations of the differences of all laboratories for each type of lamp ... 36
Figure 9-37. Differences of CCT for Incandescent lamp AC operation (I-AC) ... 37
Figure 9-38. Differences of CCT for omnidirectional LED lamp (OD)... 37
Figure 9-39. Differences of CCT for directional LED lamp (D) ... 38
Figure 9-40. Differences of CCT for low power factor lamp (LPF) ... 38
Figure 9-41. Differences of CCT for high CCT lamp (HCCT) ... 39
Figure 9-42. Summary of the differences of CCT. The bars show the robust standard deviations of the differences of all laboratories for each type of lamp ... 39
Figure 9-43. Differences of CRI Ra for Incandescent lamp AC operation (I-AC)... 40
Figure 9-44. Differences of CRI Ra for omnidirectinoal LED lamp (OD) ... 40
Figure 9-45. Differences of CRI Ra for directional LED lamp (D) ... 41
Figure 9-46. Differences of CRI Ra for low power factor lamp (LPF)... 41
Figure 9-47. Differences of CRI Ra for high CCT lamp (HCCT) ... 42
Figure 9-48. Summary of the differences of CRI Ra. The bars show the robust standard deviations of the differences of all laboratories for each type of lamp ... 42
Figure 9-49. Differences of power factor for incandescent lamps AC operation (I-AC) ... 43
Figure 9-50. Differences of power factor for omnidirectional LED lamp (OD) ... 43
Figure 9-51. Differences of power factor for directional LED lamp (D) ... 44
Figure 9-52. Differences of power factor for low power factor lamp (LPF) ... 44
Figure 9-53. Differences of power factor for high CCT lamp (HCCT). Data of NIST-HCCT lamp (DC-operated) are not included. ... 45
Figure 9-54. Summary of differences of power factor. The bars show the robust standard deviations of the differences of all laboratories for each type of lamp. ... 45
Figure 9-55. Comparison of integrating sphere and goniophotometer in luminous flux measurement for I-AC lamp. ... 46
Figure 9-56. Comparison of integrating sphere and goniophotometer in luminous flux measurement for omnidirectinal LED lamp ... 47
Figure 9-60. Comparison of goniophotometer systems and sphere systems in the measurement of luminous
flux of remote phosphor lamps ... 50
Figure 9-61. Comparison of I-AC and I-DC in luminous flux measurement ... 51
Figure 9-62. Summary of differences for all quantities and all artefact types; the robust standard deviations in Figures 9-6, 9-12, 9-18, 9-24, 9-30, 9-36, 9-42, 9-48, and 9-54 shown together ... 52
Figure 9-63. Correlations between the deviations of two quantities for OD lamp. ... 54
Figure 9-64. Uncertainties (k=2) of luminous flux reported by the laboratories ... 55
Figure 9-65. Uncertainties (k=2) of luminous efficacy reported by the laboratories ... 56
Figure 9-66. Uncertainties (k=2) of RMS current reported by the laboratories ... 56
Figure 9-67. Uncertainties (k=2) of active power reported by the laboratories ... 57
Figure 9-68. Uncertainties (k=2) of chromaticity x reported by the laboratories ... 57
Figure 9-69. Uncertainties (k=2) of chromaticity y reported by the laboratories ... 58
Figure 9-70. Uncertainties (k=2) of CCT reported by the laboratories. CCT of most of the OD lamps were 2700K to 3200K ... 58
Figure 9-71. Uncertainties (k=2) of CRI Ra reported by the laboratories. ... 59
Figure 9-72. Uncertainties (k=2) of power factor reported by the laboratories. ... 59
Figure 9-73.. z’ scores for total luminous flux and luminous efficacy for I-AC ... 61
Figure 9-74. z’ scores for RMS current and active power for I-AC ... 61
Figure 9-75. z’ scores for chromaticity x, y for I-AC ... 62
Figure 9-76. z’ scores for CCT and CRI Ra for I-AC ... 62
Figure 9-77. z’ scores for total luminous flux and luminous efficacy for LPF ... 63
Figure 9-78. z’ scores for RMS current and active power for LPF ... 63
Figure 9-79. z’ scores for chromaticity x, y for LPF ... 64
Figure 9-80. z’ scores for CCT and CRI Ra for LPF ... 64
Figure 9-81. Summary of z’ score results – Percentage of the laboratories with lz’l >3 ... 65
Figure 9-82. En numbers for luminous flux and luminous efficacy for I-AC ... 66
Figure 9-83. En numbers for RMS current and active power for I-AC ... 67
Figure 9-84. En numbers for chromaticity x, y for I-AC ... 67
Figure 9-85. En numbers for CCT and CRI Ra for I-AC ... 68
Figure 9-86. En numbers for total luminous flux and luminous efficacy for LPF ... 68
Figure 9-87. En numbers for RMS current for LPF ... 69
Figure 9-88. En numbers for Active Power for LPF ... 69
Figure 9-89. En numbers for chromaticity x, y for LPF ... 70
Figure 9-90. En numbers for CCT and CRI Ra for LPF ... 70
4E Energy Efficient End-use Equipment
A Amperes
AB Accreditation Body AC Alternating Current
AIST National Institute of Advanced Industrial Science and Technology (Japan) APLAC Asia Pacific Laboratory Accreditation Cooperation
CCT Correlated Color Temperature
CEN Comité Européen de Normalisation (European Committee for Standardisation) CIE Commission Internationale de l´Eclairage (International Commission on Illumination) CRI Color Rendering Index
D Directional (lamp) D1 Directional (downlight) DC Direct Current
HCCT High Correlated Color Temperature
Hz Hertz
IAC Incandescent Alternating Current (lamp) IANZ International Accreditation New Zealand IC Interlaboratory Comparison
IDC Incandescent Direct Current (lamp) IEA International Energy Agency
IEC International Electrotechnical Commission IES Illuminating Enginerring Society of North America ILAC International Laboratory Accreditation Cooperation ISO International Standards Organisation
K Kelvin
KOLAS Korea Laboratory Accreditation Scheme LED Light Emitting Diode
lm lumens
LPF Low Power Factor (lamp)
MAP Measurement Assurance Program (US)
NCAS National Accreditation Service of Conformity Assessment (China) NIST National Institute of Standards and Technology (US)
NLTC National Lighting Test Centre (China) NMI National Metrology Institute
NMIJ National Metrology Institute of Japan
NVLAP National Voluntary Laboratory Accreditation Program OD Omni-Directional
PRR Participants Results Report PT Proficiency Testing RP Remote Phosphor (lamp)
SDPA Standard Deviation for Proficiency Assessment SSL Solid State Lighting
TL Tubular Linear (lamp) USA United States of America
VSL Dutch Metrology Institute (The Netherlands)
1 Introduction
A large-scale, international interlaboratory comparison test of solid-state lighting (SSL) products has been conducted under the framework of the Solid State Lighting (SSL) Annex1, part of the International Energy Agency (IEA) Implementing Agreement on Energy Efficient End-use Equipment (4E)2. The SSL Annex is organised to assist country governments promoting quality assurance of LED lighting products world-wide. There are ten countries participating in the SSL Annex1. Regulations and government programmes (product certification activities) on LED lighting products are being established in many countries, and one of the urgent needs to support such government activities is to establish laboratory proficiency testing (PT) for testing accreditation programs. Establishing PT, however, is not easy because PT providers are required to have high-level knowledge and experience in measurement of SSL products and also authorisation by accreditation bodies and/or government programmes. Regulators and accreditation bodies also need knowledge of the current state of interlaboratory differences in SSL measurements when determining products specifications. For these purposes, Task 2 (SSL Testing, Leader: Y. Ohno) and Task 3 (Accreditation, Leader: K. Nara) of SSL Annex jointly developed and conducted an interlaboratory comparison (IC) program, named IC 2013.
The IC 2013 was organised to serve as a type of PT for a participant laboratory. Interlaboratory comparisons are known to be one of the most reliable tools to assess the technical competence of a participating laboratory. This programme was organised in compliance to ISO/IEC 17043 [1] to facilitate the use by accreditation bodies (ABs) as described in ILAC P9:11/2010 [2]. The present programme is expected to contribute to the accreditation of laboratories, by which, mutual recognition of the measurement results will be realised to lower technical trade barriers in the present global market.
In order to cover many participating laboratories world-wide, IC 2013 was operated by four Nucleus Laboratories; VSL BV (Dutch Metrology Institute, The Netherlands), National Lighting Test Centre (NLTC, China), National Metrology Institute of Japan - Advanced Industrial Science and Technology (AIST, NMIJ, Japan), and National Institute of Standards and Technology (NIST, USA). The participants were assigned to one of the Nucleus Laboratories so that basically, VSL covered the European region, NLTC covered China and Asia Pacific region, AIST, NMIJ covered Japan, and NIST covered Americas region. The Nucleus laboratories had formally compared test results and established equivalence amongst themselves in advance [3].
The IC 2013 in all regions was conducted in compliance with the SSL Annex IC Generic Protocol [4], which specified the basic five types of comparison artefacts including a few options, eight measurands (electrical, photometric and colorimetric quantities), assigned values, testing period and shipping instructions, measurement procedures, uncertainty calculation, evaluation of performance using z’ score (defined in ISO 13528 [8]) and En number (defined in ISO 13528 [8] and ISO/IEC 17043 [1]), reporting, and other details. Each
region was allowed to select LED lighting products commonly available in their market for the types of artefact specified in the Generic Protocol. The exact protocols including the specifications of the artefacts used in each region were documented as the SSL Annex Interlaboratory Comparison Protocol for -VSL, -NLTC,
-AIST, NMIJ, and –NIST (hereinafter called “Regional Protocols”), which were distributed to the participants in
each region, and made available to ABs and government agencies on a request basis.
The IC 2013 used a test method, SSL Annex Interlaboratory Comparison Test Method 1.0 [5], which encompassed all the requirements in the SSL test methods already available in the USA, Japan, China, and
1
http://ssl.iea-4e.org/
2
also including the draft of the SSL test method being developed jointly by International Commission on Illumination (CIE) and Comité Européen de Normalisation (CEN: European Committee for Standardisation) 3, so that the results could be considered for acceptance by ABs and regulatory programmes world-wide using these regional test methods.
The IC 2013 was launched in October 2012, and measurements were completed in August 2013. The
announcement of IC 2013 was made publicly and applications were accepted until April 2013. Registration for participants was open to all laboratories including countries that are not part of the SSL Annex. As a result, 54 laboratories from 18 countries participated in the IC. There were no participants from USA (only two from Americas region) because National Voluntary Laboratory Accreditation Program (NVLAP) has already provided an accreditation programme4 for SSL testing since 2009, for which NIST provides PT, and also NIST provides PT service for SSL testing under NIST Measurement Assurance Program (MAP) for accreditation bodies other than NVLAP. Since these PTs were conducted by NIST using a test method (IES LM-79 [6]), which is encompassed in the IC Test Method [5], and using basically the same types of comparison artefacts as those used in the IC 2013, it was agreed by the SSL Annex and NVLAP to link the test results. NIST contacted the laboratories who participated in the NVLAP PT or NIST MAP, and 35 US participants who gave permission to link their test results with IC 2013. This enabled the SSL Annex to include many USA laboratories in the comparison, as well as providing some possibility for these US laboratories to be recognised as PT in other countries. The z’ scores of these linked laboratories were re-calculated according to the IC Generic Protocol [4]. The uncertainties of measurement were not reported in these PTs in NVLAP/NIST MAP and thus En
numbers were not available in these linked data. The deviations from the IC Generic Protocol [4] and the IC Test Method [5] in these linked PTs were noted in the Participants Results Report issued to each linked laboratories, to be reviewed by ABs when it is used for an accreditation application.
After the IC was launched, Asia Pacific Laboratory Accreditation Cooperation (APLAC) launched a similar PT program (APLAC Proficiency Test T088) conducted in 2013. This programme was operated by NLTC using the same test method (i.e., the Interlaboratory Comparison Test Method 1.0 [5]) and the same artefact types used in IC 2013. For all of these reasons, it was agreed that the results of this APLAC PT programme could be linked to IC 2013, and laboratories registering for T088 were given the option of having their results linked to IC 2013. Twenty-one laboratories chose to be linked to IC 2013, which affords them the same benefits as participants in IC 2013 and allows more data to be included in the comparison. The APLAC PT used only En
number, but z’ scores according to the SSL Annex IC Generic Protocol [4] were also calculated for the laboratories with linked test results. Any other differences of the protocols used in the APLAC PT programme from the SSL Annex IC Generic Protocol [4] were noted in Participants Results Report (to be reviewed by ABs when it is used for accreditation application).
Thus, in total, the measurement data from 110 laboratories worldwide are included in this final report of IC 2013. In addition, there are 13 more sets of data included, as some laboratories submitted two or more sets of results for different measurement systems they used (e.g., integrating sphere and goniophotometer) or as a result of corrective action in the NVLAP PTs.
For comparison artefacts, at least four different LED lamps (directional, omnidirectional, low power factor, and high correlated colour temperature) and incandescent lamps (for reference purposes) were used, with one or two optional artefacts in some regions. Participants performed measurements of:
• total luminous flux, • active power,
• RMS voltage and current, • luminous efficacy, • chromaticity x and y,
• correlated colour temperature, • colour rendering index (CRI Ra), and • power factor (optional).
The differences of these measured results from the results by reference laboratory (Nucleus laboratories) were analysed, and z’ scores and En numbers (see sections 7.1 and 7.2) of these results were calculated. The
denominators in z’ scores had been pre-determined in SSL Annex IC Generic Protocol when IC 2013 was launched.
Before this final report was prepared, Participant Results Reports (PRRs), providing individual test results of each laboratory were issued. PRRs are confidential documents, and each participant received a report containing just their individual results. If that laboratory then decides to apply for SSL testing accreditation, they may choose to submit their PRR as evidence of their proficiency, if their AB recognises IC 2013.
After completing the PRRs, the SSL Annex prepared four regional Interim Reports, which presented the results of all the participating laboratories in each region. The four Interim Reports were each prepared by the Nucleus laboratories and distributed to all the participants in each region. In the Interim Reports, the participants in the data are expressed anonymously but each participant was informed (confidentially) of their unique identification number so they can assess their results relative to the other laboratories. The regional Interim Reports are also made available to ABs and government agencies if requested. The requirements of ISO/IEC 17043 in reporting the results as a PT were satisfied by the PRRs and Interim Reports.
To date, IC 2013 has been recognised as a PT by National Voluntary Laboratory Accreditation Program (NVLAP) in USA, International Accreditation Japan (IA-Japan), China National Accreditation Service of Conformity Assessment (CNAS, China), Korea Laboratory Accreditation Scheme (KOLAS), and International Accreditation New Zealand (IANZ), and is expected to be recognised by more ABs.
Another purpose of IC 2013 was to provide the information on the current state of interlaboratory differences in SSL measurements worldwide, to identify problems and possibly improve measurement practices. This final report focuses on this aspect, presenting results of a technical and scientific interest, with limited information on test results as a PT. Also, the final report does not compare the laboratory
performance in the different regions; the results of all regions are combined and presented together anonymously. Also, due to the large volume of data involving many participants, artefacts, and measurands, the data presented for z’ scores and En numbers are limited to certain representative data selected from all
the artefacts and quantities tested. Some technical issues have been identified as a result of this IC, and thus, these results may be useful for future improvements to the measurement of LED lighting products.
2 Protocol of Comparison
The details of IC 2013 are described in the SSL Annex IC Generic Protocol [4]. IC 2013 was conducted by four Nucleus laboratories which served as reference laboratories in each region, as listed in Table 2-1. All the results of the four regions were combined for the results presented in this Final Report. The test method used was the SSL Annex IC Test Method 1.0 [5]. The five common artefact types and some additional (optional) artefacts that were used in this IC were specified in Generic Protocol, and the details are described in Section 5 of this final report. IC 2013 is the star type comparison (see Annex A of ISO/IEC 17043 for the types of PT schemes). The artefacts were measured by the reference laboratory first, sent to a participant laboratory for testing, and then returned and tested again by the reference laboratory (note: a small modification to this procedure was allowed in the Regional Protocol for AIST, NMIJ in Japan). If the observed drift (difference between the first and second measurements by reference laboratory) exceeded 0.8 x SDPA (see Section 7), then the relevant results of the artefact were discarded and a replacement artefact was sent for
re-measurement. Each Nucleus laboratory developed its Regional Protocol in compliance with the SSL Annex IC Generic Protocol, with slight (regional) variations in the artefact types selected (see Section 5).
Table 2-1. List of Reference Laboratories
Nucleus Laboratory Testing Coordinator Testing Director Dutch Metrology Institute (VSL, The Netherlands) Elena REVTOVA Nellie SCHIPPER National Metrology Institute of Japan - Advanced IndustrialScience and Technology (AIST, NMIJ, Japan)
Tatsuya ZAMA Mamoru KAWAHARASAKI National Lighting Test Centre (NLTC, China) Wei ZHANG,
Shuming HUA
Hongzheng XIN
National Institute of Standards and Technology (NIST, USA) Cameron MILLER Yoshi OHNO
3 Timetable
The IC 2013 was carried out on the time table given in Table 3-1. The dates for measurements listed are valid for the labs that directly participated in IC 2013. The dates of measurements linked from NIST MAP and NVLAP PT are from May 2010 to August 2013.
Table 3-1. Timetable of SSL Annex IC 2013
Item Date
Announcement and opening of application period 22 October 2012 Closure of the application period 30 April 2013
Measurements conducted with the Participants November 2012 – August 2013 Participants Results Reports and Regional Interim
Reports issued
January 2014
4 List of Participants
The list of participants for each Nucleus laboratory are shown in Tables 4-1 to 4-4. These are not all of the participants, only laboratories who gave consent are listed. There were 26 labs under VSL, 14 labs under NLTC, 12 labs under AIST, NMIJ, and 37 labs under NIST including 35 labs linked from NVLAP/NIST MAP programmes. In addition to these, there were also 21 labs linked from APLAC PT but these labs are not listed below.
The number of laboratories who participated directly in IC 2013 in the Americas region was small because the need for a SSL PT in North America has largely been met, as NIST had already provided PT services for the NVLAP EEL-SSL program and NIST Measurement Assurance Program (MAP) for many labs in USA and Canada when IC 2013 was launched.
Table 4-1. List of Participants under AIST, NMIJ, approved to be listed
Laboratory/Institute Country
Japan Electrical Safety & Environment Technology Laboratories Japan
Hitachi Appliances, Inc. Japan
Toshiba Lighting & Technology Corporation Japan
NEC Lighting, Ltd. Japan
Otsuka Electronics Co., Ltd. Japan
Panasonic Corporation Eco Solutions Company Japan
Table 4-2. List of Participants under VSL, approved to be listed
Laboratory/Institute Country
Centre Scientifique et Technique du Bâtiment - CSTB Grenoble France
DELTA Denmark
DTU Fotonik Denmark
Instrument Systems GmbH Germany
Intertek Semko AB Sweden
Laboratorium voor Lichttechnologie / KAHO Sint-Lieven Belgium
Korea Institute of Lighting Technology (KILT) Republic of Korea
Korea Photonics Technology Institute (KOPTI) Republic of Korea
Korea Testing Certification (KTC) Republic of Korea
Korea Testing Laboratory (KTL) Republic of Korea
Korea Testing & Research Institute (KTR) Republic of Korea
LED Engineering Developments France
Laboratoire Plasma et Conversion Energie (LAPLACE)/Université P. Sabatier France
National Physical Laboratory United Kingdom
Nederlandse Voedsel- en Warenautoriteit (NVWA)/Laboratory Non-Food
Product Safety The Netherlands
NEOLUX France
OSRAM GmbH Central Laboratory for Light Measurements Germany
Philips Innovation Services The Netherlands
PISEO SAS France
Russian Lighting Research Institute named by S.I.Vavilov (VNISI) Russia
SP Technical Research Institute of Sweden Sweden
SSL Resource Finland
The Lighting Industry Association Laboratories Ltd United Kingdom
Table 4-3. List of Participants under NIST, approved to be listed (including two direct
participants to IC 2013 and 35 laboratories linked from NVLAP PT or NIST MAP)
Laboratory/Institute Country
Acuity Brands Lighting Granville Lab USA
Acuity Brands Lighting, Conyers USA
Aurora International Testing Laboratory USA
Bay Area Compliance Laboratory Corporation USA
Cooper Lighting USA
Cree Durham Technology Center (DTC) USA
CREE Engineering Services Testing Laboratory USA
CREE, Inc. USA
CSA Group USA
Laboratory/Institute Country
Halco Lighting Laboratory USA
Hubbell Lighting, Inc. USA
Independent Testing Laboratories, Incorporated USA
INMETRO Brazil
Intertek Commercial & Electrical USA
University of California, Davis USA
Intertek Testing Services USA
Juno Lighting Group USA
Kenall Performance Laboratory USA
Light Laboratory, Incorporated USA
Lighting Research Center USA
Lighting Sciences Incorporated USA
LightLab International, Incorporated USA
Lumentra Inc. USA
National Research Council of Canada Canada
Orb Optronix, Incorporated USA
Osram Sylvania Metrology & Analytics Services USA
Philips Day-Brite Lighting USA
Philips Lighting Company USA
Sapphire Technical Solutions, LLC USA
Sternberg Lighting USA
TUV SUD America USA
UL Verification Services, Inc. USA
Table 4-4. List of Participants under NLTC, approved to be listed
Laboratory/Institute Country
Foshan Electrical and Lighting Co., Ltd. China
ITRI Optoelectronic Semiconductor Measurement Laboratory Taiwan
Light Engine Limited China
Lighting Test and Evaluation Laboratory, Residential & Commercial Energy Conservation Technology Division, Energy and Environment Research Laboratories. ITRI
Taiwan
Massey University New Zealand
National Measurement Institute Australia Australia
Queensland University of Technology Australia
Shanghai Qiangling Electronic co, Ltd. China
Steve Jenkins and Associates Pty. Ltd. Australia
Swedish Energy Agency Sweden
Taiwan Electric Research & Testing Center (TERTEC) Taiwan
Zhejiang Shenghui Lighting Co., Ltd. China
Intertek Testing Services Hong Kong, Ltd. Hong Kong
Optical and Electrical Testing Laboratory, CMS, ITRI Taiwan
Each participant laboratory was given a “Lab Code” to identify them, but Lab Codes are not used in this final report due to the practical limitations on space in the figures. Therefore, Laboratory Numbers from 1 to 123 are used to present the results in this final report. Table 4-5 shows the correspondence between the Laboratory Numbers and the Lab Codes. Lab Codes that appear with a star are those of laboratories that are linked from the NVLAP/NIST PT or the APLAC PT. Each participant has been given their Lab Code, but that code is kept confidential. The Lab Codes were assigned to laboratories randomly so the participants in the four regions are all mixed together in the graphs shown in section 9.
Table 4-5. Correspondence between Laboratory Numbers and Lab Codes
Lab Num. Lab Code Lab Num. Lab Code Lab Num. Lab Code Lab Num. Lab Code Lab Num. Lab Code Lab Num. Lab Code 1 P011* 22 L168 43 L268-f* 64 L386-f* 85 L552* 106 L712 2 L045 23 L171 44 L273-S* 65 L395 86 L553* 107 L717 3 L059-S* 24 L176 45 L273-G* 66 L405 87 L567* 108 P725* 4 L059-G* 25 P185* 46 L275* 67 P416* 88 L568 109 L733 5 L061 26 P189* 47 L282 68 P424* 89 L571* 110 L734 6 L066 27 L199 48 P294* 69 L424 90 L579 111 L737 7 L082-S* 28 L208 49 L303-S* 70 L430 91 L582* 112 L758 8 L082-G* 29 L213 50 L303-G* 71 L436-S* 92 L584* 113 L764-S* 9 L082-G2* 30 L227 51 L304 72 L436-G* 93 L594 114 L764-G* 10 L087 31 L228* 52 L306 73 L438 94 P600* 115 L764-G2* 11 P097* 32 L235 53 L332* 74 L449* 95 L603 116 L774 12 L112 33 L236* 54 P342* 75 L459* 96 L607* 117 P774* 13 L130 34 L239-i* 55 L354 76 L462 97 L616* 118 L777 14 P142* 35 L239-f* 56 L359 77 L479 98 P630* 119 L797 15 L144 36 L241 57 L362 78 L488 99 L633 120 L799 16 L149-S* 37 L245* 58 L369-S* 79 L511* 100 L638* 121 P850* 17 L149-G* 38 L247* 59 L369-G* 80 L518* 101 P639* 122 P895* 18 P149* 39 L248 60 L376* 81 L521* 102 L646 123 P920* 19 P153* 40 L256 61 L379 82 L536* 103 L687* 20 L155 41 L265* 62 L385 83 L547 104 P693* 21 P158* 42 L268-i* 63 L386-i* 84 L551 105 L708Some laboratories submitted two or three sets of results using different measurement systems. In this case, a separate Lab Code (ending with -S for sphere system and -G for goniophotometer) was issued for each measurement system and those results are treated as a different laboratory. Also, for some of the
laboratories linked from NVLAP/NIST PT, results before and after a corrective action are included as separate laboratories, and are given Lab Codes ending with -i (initial test) or -f (final test).
5 Description of the Artefacts
The SSL Annex IC Generic Protocol [4] specified five different types of artefact to be used in this IC:
1) Incandescent lamp (I-AC) 2) Omnidirectional LED lamp (OD) 3) Directional LED lamp (D)
4) High CCT LED lamp or luminaire (HCCT) (> 5000 K, preferably ≈ 6500 K) 5) Low power-factor LED lamp (LPF) (PF < 0.6, preferably PF ≈ 0.5)
In addition, each region was given the option to add artefacts, including the following: 1) Incandescent lamp – DC operation (I-DC), using the same lamp as I-AC 2) Tubular type LED lamp (TL)
The abbreviations in parenthesis (e.g., I-AC, OD, etc.) for these artefact types are used in this document. The Generic Protocol allowed the Nucleus Labs to combine one of these optional artefacts with one of the four basic LED lamp types. These different products were included in IC 2013 to compare and identify differences in the results due to different artefact characteristics (e.g., differences in spectral distribution, differences in angular intensity distribution, differences in current waveform, etc.) or to possibly identify additional measurement problems with specific lamp types such as tubular and remote-phosphor lamps.
The artefacts used were selected by each Nucleus laboratory for the region according to the SSL Annex IC Generic Protocol [4] and also considering the needs in the region. The types of product used in each region are listed in the corresponding Regional Protocols, and are presented below in Tables 5-1 to 5-4. The artefacts were aged, tested and screened for stability by the Nucleus Laboratory prior to being used for comparison testing. NIST-D1 (directional LED luminaire) is not listed in the Generic Protocol but was added because this type of product is quite common in USA and it was used in the PTs in NVLAP/NIST MAP. Note that there were some variations in rated power and nominal CCT in the artefacts used in the PTs in NVLAP/NIST MAP.
Several sets of artefacts were prepared by each Nucleus laboratory and used in this comparison. Each LED lamp or luminaire sent to participants was given a unique artefact identification number. The artefacts used in each of the four regions (as described in Regional Protocols) are shown below.
Table 5-1. AIST, NMIJ Artefacts and their Properties
Identifier
Type
Rated
Voltage
Rated
Power
Nominal
CCT
Other Conditions
AIST-IDC Incandescent DC 100 V DC 200 W 2800 KUsing the same lamp as AIST-IAC AIST-IAC Incandescent
AC 100 V AC 200 W 2800 K
AC frequency:
50 Hz
Operating position: base up for all lamps.
AIST-OD
Omni-directional 100 V AC 9.0 W 3000 K
AIST-D Directional 100 V AC 5.0 W 3000 K
AIST-HCCT High CCT 100 V AC 9.0 W 5100 K
AIST-LPF Low power
Table 5-2. VSL Artefacts and their Properties
Identifier
Type
Rated
Voltage
Rated
Power
Nominal
CCT
Other
Conditions
VSL-IAC Incandescent AC 230 V AC 100 W 3000 K AC frequency: 50 Hz Operating position: base upfor all lamps except VSL-TL, which is horizontal. VSL-RP Omni-directional (and Remote Phosphor) 230 V AC 12 W 2700 K VSL-D Directional (and high CCT) 230 V AC 5 W 5000 K VSL-LPF Low power factor 230 V AC 5 W 3200 K VSL-TL* High CCT (and Tubular) 230 V AC 18 W 6000 K
* The TL lamp is 1.2 m in length.
Table 5-3. NIST and NVLAP PT/NIST MAP Artefacts and their Properties
Identifier
Type
Rated
Voltage
Rated
Power
Nominal
CCT
Other Conditions
NIST-IAC Incandescent AC 120 V AC 60 W 2900 K AC frequency: 60 Hz Operating position: base up for alllamps. NIST-OD Omni-directional 120 V AC 12.5 W 2700 K NIST-D1 Directional (downlight) 120 V AC 12.0 W 2700 K NIST-D2 Directional (lamp) 120 V AC 8.0 W 3000 K
NIST-LPF Low power
factor 120 V AC 6.0 W 4500 K
NIST-HCCT* High CCT 12 V DC 2.9 W 6500 K Constant current
0.2250 A * NIST-HCCT is an under-cabinet LED luminaire with 60 cm in length, operated on the specified DC current. Note: there were some variations of rated power and CCT of lamps used in NVLAP/NIST PT.
Table 5-4. NLTC and APLAC PT Artefacts and their Properties
Identifier
Type
Rated
Voltage
Rated
Power
Nominal
CCT
Other Conditions
NLTC-IAC Incandescent AC 220 V AC 60 W 2700 K AC frequency: 50 Hz Operating position: base up for alllamps NLTC-OD Omni-directional 220 V AC 5 W 2700 K NLTC-D Directional 220 V AC 8 W 3000 K NLTC-HCCT High CCT 220 V AC 6 W 5000 K NLTC-LPF Low power factor 220 V AC 6 W 3000 K
NLTC-IDC* Incandescent DC 12 V DC 50 W 2800 K Constant current: DC 3.9500 A. * NLTC-IDC is a tungsten halogen lamp, and was used only at APLAC PT (instead of NLTC-IAC).
6 Measurands
The following measurement quantities were measured and compared in this IC test.
1) Total luminous flux (lm)
2) RMS Voltage (V) and Current (A) 3) Electrical active power (W) 4) Luminous efficacy (lm/W) 5) Chromaticity coordinates x, y 6) Correlated Colour Temperature (K) 7) Colour Rendering Index (CRI) Ra
8) Power factor (optional)
Reporting measurement uncertainties in compliance with ISO/IEC Guide 98-3 [7] was required by the SSL Annex Test Method 1.0 [5] for all results. However, results without uncertainty values were also accepted (noted as a non-compliance to the IC test method), as such results may still qualify for certain testing accreditation programmes that do not require uncertainty values in test reports.
7 Assigned Values and Data Analysis
The assigned value is a value attributed to a particular property of a proficiency test item [1]. Assigned values in IC 2013 were given by the Nucleus Laboratories, and were calculated as the mean of the measurements by the Nucleus Laboratory taken for each quantity before sending and after return of artefacts from each participating laboratory. The criteria used to analyse and evaluate the performance are given by the z’ score (defined in ISO 13528 [8]) and En number (defined in ISO 13528 [8] and ISO/IEC 17043 [1]). However, it should be noted that the Ennumbers were not calculated if the uncertainties were not reported by a participant.
z’ score
7.1
The z’ score is calculated for all results, and is determined by:
, (1)
where is the SDPA value (Standard Deviation for Proficiency Assessment) and, in this IC test, is the generic standard uncertainty of a participant’s measurement; ux is the standard uncertainty of the reference value (average of uncertainties of measurement of the comparison artefacts by four Nucleus laboratories reported in the Nucleus Laboratory Comparison Report published in 2012 [3]). The value of udrift is the uncertainty
contribution from the expected artefact drifts (controlled to within 0.8 x SDPA, see Section 2) and calculated by: . (2) 2 drift 2 2
ˆ
'
u
u
X
x
z
X+
+
−
=
σ
ˆ
σ
u
drift=
0.8
⋅
σ
ˆ
2 3
If these equations are given in relative uncertainties
rel , , , then z’ is calculated by:, (3)
where x is the value measured by the participant and X is the assigned value measured by the reference laboratory. The values of or and
or were pre-determined, and are listed in Table 2 in theSSL Annex IC Generic Protocol [4]. The values of or were determined as the averages of the Nucleus Laboratories’ measurement uncertainties reported in the preceding comparison among the Nucleus Laboratories [3]. The values of
or were determined as expected generic uncertainties ofmeasurement of each quantity by the participants.
The determined values of these parameters used in IC 2013 and their uncertainty budget are provided in in Appendix 1 of this Report; and also in the Regional Interim Reports previously distributed in each region.
E
nnumber
7.2
En numbers are calculated, if the uncertainties of measurements are reported by the participant, according to
,
(4) where:
x: value measured by the participant
X: assigned value (average of reference laboratory measurements, before and after) Ulab: expanded uncertainty (k=2) of a participant’s result
Uref : expanded uncertainty (k=2) of the assigned value
Uref is calculated by
(5)
and
Uref = 2 uref , (6)
where X1 and X2 are measured values by the reference laboratory, before and after the participant’s
measurement, and u1 and u2 are their absolute standard uncertainties at the first and second measurements.
Equation (5) above assumes that the two measurements by the reference laboratory are fully correlated. The second term in the square root is a square of the standard uncertainty associated with the drift of the artefacts as measured by the reference laboratory (taken as a rectangular distribution [7],[9]).
Use of z’ and E
n7.3
Generally, > 1.0 is considered to be unsatisfactory. That is, the difference in the quantities measured by the Nucleus and participant laboratories is greater than the expanded uncertainty of the comparison. The
u
X, rel
u
drift, rel2 rel drift, 2 rel , 2 rel
ˆ
/
)
(
'
u
u
X
X
x
z
X+
+
−
=
σ
u
Xu
X, relu
Xu
X, rel 2 ref 2 lab nU
U
X
x
E
+
−
=
u
ref=
u
1+
u
22
2+
X
1−
X
22 3
2 nE
value of 2.0 < < 3.0 is considered to be questionable, and ≥ 3.0 is generally considered to be unsatisfactory, but the judgment as to whether the result is acceptable will depend on the AB.
The En number and z’ score are used for different purposes. The concept of the En number is to test whether
the claimed measurement uncertainties of a laboratory are valid, and this is suitable when the uncertainty is in the scope of accreditation and needs to be certified (typically the case for calibration laboratory
accreditation). The z’ score, on the other hand, is to test whether the laboratory’s results are within an
acceptable range of variation, and is suitable for testing laboratory accreditation (supporting product certification activities) which examines the laboratory’s competence and compliance to the reference test method. For laboratory accreditation programmes having both purposes (i.e., serving for product certification activities as well as certifying the reported uncertainties), the use of both the En number and z’ score would
be appropriate.
8 Results of Reference Laboratory Measurements
In this report, the participants’ results are presented in (relative) differences to the value measured by reference laboratory (presented in section 9), and the measured values of reference laboratories and of participants are not presented. To provide information of the magnitude of the absolute values of the measurement quantities of each artefact, the measurement results for one set of the artefacts measured by NIST are presented as an example in Table 8-1 and their uncertainties in Table 8-2. NIST used several artefact sets. The values for other artefact sets were similar to these.
Table 8-1. Measurement results of one of the artefact sets measured by NIST
A rt e fac t T e st e d V o lt ag e C u rr e n t A ct iv e P o w e r Lu m in o u s F lu x Lu m in o u s E ff ic ac y x y C C T C R I R a P o w e r F ac to r Unit: (V) (A) (W) (lm) (lm/W) (K) NIST-IAC 120.00 0.506 60.76 999.4 16.45 0.4482 0.4086 2855 99.6 1.000 NIST-OD 120.02 0.141 12.80 853.9 66.69 0.4580 0.4073 2701 81.3 0.755 NIST-D1 119.98 0.089 10.21 671.8 65.81 0.4613 0.4031 2622 92.3 0.960 NIST-D2 120.19 0.077 8.80 318.6 36.22 0.4295 0.3970 3070 89.0 0.951 NIST-LPF 119.94 0.066 4.61 210.4 45.79 0.3591 0.3856 4663 66.6 0.582 NIST-HCCT 11.98 0.225 2.70 115.1 42.68 0.2958 0.3116 7796 81.7 1.000
'
z
z
'
Table 8-2. (Relative) expanded uncertainties (k=2) of measurements by NIST
A rt e fac t T e st e d V o lt ag e C u rr e n t A ct iv e P o w e r Lu m in o u s F lu x Lu m in o u s E ff ic ac y x y C C T C R I R a P o w e r F ac to r Unit: % % % % % (K) NIST-IAC 0.3 0.2 0.5 0.5 0.7 0.002 0.002 20 0.5 0.002 NIST-OD 0.3 1.2 1.3 0.7 1.5 0.002 0.002 20 0.5 0.010 NIST-D1 0.3 0.8 0.9 0.7 1.1 0.002 0.002 20 0.5 0.008 NIST-D2 0.3 0.7 0.8 0.7 1.1 0.002 0.002 20 0.5 0.005 NIST-LPF 0.3 0.4 0.8 0.7 1.1 0.002 0.002 20 0.5 0.006 NIST-HCCT 0.2 0.4 0.6 0.7 0.9 0.002 0.002 50 0.5 0.018Each artefact was measured by the Nucleus laboratory before and after transportation to each participating laboratory. The observed Before-After differences indicate changes in the artefact performance, possibly due to instability of artefact, effects of transportation, and/or measurement reproducibility at the Nucleus laboratory. Figures 8-1 to 8-4 show examples of the (relative) differences between the first (before) and second (after) measurements of all quantities of 15 representative artefact sets used in this IC. In the graphs below, reference laboratories of the data are mixed and the dashed line shows 0.8 x
.
If the change exceeded ±0.8 x , the data of the artefact were discarded and additional measurements were made on a replacement artefact. These graphs show the initial data as measured in IC 2013, thus some data points exceed the limit.
Figure 8-1. Examples of relative differences between two measurements by Reference
Laboratories before and after transportation, for luminous flux and RMS current
Figure 8-2. Examples of relative differences between two measurements by Reference
Laboratories before and after transportation, for active power and luminous efficacy
Figure 8-3. Examples of differences between two measurements by Reference Laboratories before
and after transportation, for chromaticity x and y
Figure 8-4. Examples of differences between two measurements by Reference Laboratories before
and after transportation, for CCT and CRI R
a9 Results of the Participants Measurements
The results of IC 2013 were first analysed in each region with the assigned values as the values measured by the regional reference laboratory (Nucleus Laboratory), then the results of all the regions were combined based on the equivalence among the Nucleus Laboratories [3]. The differences between the participants’ measurement values and the assigned values, z’ scores and En numbers, of all measured quantities of all the artefacts, for all participants, were determined. The numerical results of these values for all conditions were reported in the Participants Results Reports, and the graphical presentations of all these results in each region were reported in the Regional Interim Reports (issued by each Nucleus Laboratory) for accreditation purposes. This Final Report presents graphical results of the differences in all conditions, but the z’ scores and En numbers are presented only for certain conditions for technical discussions.
Please note that results of RMS voltage are not included in these analyses, as this is a set parameter (in most cases) and it would not make sense to compare a set parameter. If the set parameter of an artefact is current (NLTC-IDC, NIST-HCCT), the results of current measurements of such artefacts are excluded from the
analyses. Also, the results of DC-operated artefacts (AIST-IDC, NLTC-IDC, NIST-HCCT) are excluded from the power factor analyses.
In Section 9.1, the differences between the participant’s measurement values and the assigned values are presented, with participants’ reported uncertainties (if these are reported) shown for all participants. The results for all quantities and all types of artefact are reported. The relative differences in percentage are presented for all photometric and electrical quantities except for power factor (reported in absolute difference) and colorimetric quantities (presented in absolute units).
Section 9.2 presents the uncertainties of measurements of all quantities and all artefacts reported by the participants, and some analyses are provided.
In Sections 9.3 and 9.4, the z’ scores and En numbers are presented for selected types of artefact
(incandescent-AC and low power factor lamp). Each laboratory number (1 to 123) corresponds to each participant or, in some cases, each measurement system of a participant.
Note that not all data points are plotted for all laboratory numbers in each figure. For example, the APLAC PT used incandescent lamps with DC operation, so their data are not included in “I-AC” figures. Some
laboratories did not measure colorimetric quantities and reported only photometric and electrical quantities. When a participant submitted two or more sets of results for different measurement systems (identified by separate laboratory numbers), only a partial set of quantities and artefacts were measured by the additional measurement system(s) (e.g., additional goniophotometer results often reported only photometric and electrical quantities, not colorimetric quantities.) Also, only a limited number of laboratories reported power factor, as it was an optional measurand.
All laboratories reported which measurement system (sphere or goniophotometer) they used. In some cases, a laboratory used both systems, e.g., photometric quantities by a goniophotometer and colorimetric
quantities by a sphere system. Comparisons of results using different instruments are reported in Section 9.1.10.
The results of optional artefact types (remote phosphor, tubular type, and incandescent lamp by DC operation) are presented in Section 9.1.11.
Differences in measurement results
9.1
The (relative) differences of results between the participant (Lab) and the Nucleus laboratory (Ref), defined by (Lab - Ref) or (Lab - Ref)/Ref, for all quantities, all participants, and all artefact types are presented in graphic forms in the following subsections. The horizontal axis (from 1 to 123) indicates individual participant laboratories (laboratory numbers), where the order of laboratories from the four different regions has been mixed.
The error bars in the figures show the uncertainties of measurement (expanded uncertainty with a coverage factor, k=2) by the participants, and are shown only when the uncertainties were reported. Note that all NVLAP-linked results do not include uncertainties. There are a few cases where laboratories reported uncertainties but not for colour quantities. Note that when a data point does not have an error bar, it means, in most cases, no uncertainty was reported, but in some cases, the reported uncertainty value is so small that bar is hidden behind data point. To clarify this, see section 9.2 for separate presentations of reported
uncertainties.
The dashed lines in the figures (in pink) show the average values of the uncertainties (k=2) by the reference (Nucleus) laboratories for all the points plotted in each figure. The reference laboratory uncertainty values are similar to but not necessarily the same as those reported in the Nucleus Laboratory Comparison Report [3] and in the IC Generic Protocol [4] due to slightly different products used in the IC 2013 in each region.
9.1.1 Total luminous flux
Figure 9-1. Relative differences of total luminous flux for Incandescent lamp AC operation (I-AC)
Figure 9-2. Relative differences of total luminous flux for omnidirectional LED lamp (OD)
-10%
-8%
-6%
-4%
-2%
0%
2%
4%
6%
8%
10%
0 10 20 30 40 50 60 70 80 90 100 110 120R
e
la
ti
ve
d
if
fe
re
n
ce
,
(L
a
b
-R
e
f)
/R
e
f
Laboratory
I-AC
Luminous Flux
-15 % (61)↓
11 % (2) -25 % (84)↓
-10%
-8%
-6%
-4%
-2%
0%
2%
4%
6%
8%
10%
0 10 20 30 40 50 60 70 80 90 100 110 120R
e
la
ti
ve
d
if
fe
re
n
ce
,
(L
a
b
-R
e
f)
/R
e
f
Laboratory
OD
Luminous Flux
-21 % (61)↓
-26 % (84)↓
Figure 9-3. Relative differences of total luminous flux for directional LED lamp (D)
Figure 9-4. Relative differences of total luminous flux for low power factor lamp (LPF)
-15%
-10%
-5%
0%
5%
10%
15%
0 10 20 30 40 50 60 70 80 90 100 110 120R
e
la
ti
ve
d
if
fe
re
n
ce
,
(L
a
b
-R
e
f)
/R
e
f
Laboratory
D
Luminous Flux
23 % (18) –29 % (84)↓
–19 % (102)↓
-15%
-10%
-5%
0%
5%
10%
15%
0 10 20 30 40 50 60 70 80 90 100 110 120R
e
la
ti
ve
d
if
fe
re
n
ce
,
(L
a
b
-R
e
f)
/R
e
f
Laboratory
LPF
Luminous Flux
18 % (42) –28 % (84)↓
–29 % (92)↓
Figure 9-5. Relative differences of total luminous flux for high CCT lamp (HCCT)