Durham Research Online
Deposited in DRO:
01 March 2017
Version of attached le:
Published VersionPeer-review status of attached le:
Peer-reviewedCitation for published item:
Makaske, B. and Lavooi, E. and De Haas, T. and Kleinhans, M. G. and Smith, D. G. (2017) 'Upstream control of river anastomosis by sediment overloading, upper Columbia River, British Columbia, Canada.', Sedimentology .
Further information on publisher's website:
https://doi.org/10.1111/sed.12361Publisher's copyright statement:
c
2017 The Authors. Sedimentology published by John Wiley Sons Ltd on behalf of International Association of
Sedimentologists This is an open access article under the terms of the Creative Commons Attribution License, which permits use, distribution and reproduction in any medium, provided the original work is properly cited.
Additional information:
Use policy
The full-text may be used and/or reproduced, and given to third parties in any format or medium, without prior permission or charge, for personal research or study, educational, or not-for-prot purposes provided that:
• a full bibliographic reference is made to the original source
• alinkis made to the metadata record in DRO
• the full-text is not changed in any way
The full-text must not be sold in any format or medium without the formal permission of the copyright holders. Please consult thefull DRO policyfor further details.
Durham University Library, Stockton Road, Durham DH1 3LY, United Kingdom Tel : +44 (0)191 334 3042 | Fax : +44 (0)191 334 2971
Upstream control of river anastomosis by sediment
overloading, upper Columbia River, British Columbia, Canada
B A R T M A K A S K E * , E V A L A V O O I†, T J A L L I N G D E H A A S†,M A A R T E N G . K L E I N H A N S† and D E R A L D G . S M I T H‡1
*Soil Geography and Landscape group, Wageningen University, P.O. Box 47, 6700 AA Wageningen, The Netherlands (E-mail: bart.makaske@wur.nl)
†Department of Physical Geography, Faculty of Geosciences, Utrecht University, P.O. Box 80115, 3508 TC Utrecht, The Netherlands
‡Department of Geography, University of Calgary, Calgary, Alberta T2N 1N4, Canada
Associate Editor – Vern Manville ABSTRACT
Anastomosing rivers, systems of multiple interconnected channels that enclose floodbasins, constitute a major category of rivers for which various sedimentary facies models have been developed. While the sedimentary products of anastomosing rivers are relatively well-known, their genesis is still debated. A rapidly growing number of ancient alluvial successions being interpreted as of anastomosing river origin, including important hydro-carbon reservoirs, urge the development of robust models for the genesis of anastomosis, to facilitate better interpretation of ancient depositional settings and controls. The upper Columbia River, British Columbia, Canada, is the most-studied anastomosing river and has played a key role in the develop-ment of an anastomosing river facies model. Two hypotheses for the origin of upper Columbia River anastomosis include the following: (i) downstream control by aggrading cross-valley alluvial fans; and (ii) upstream control by excessive bedload input from tributaries. Both upstream and downstream control may force aggradation and avulsions in the upper Columbia River. In order to test both hypotheses, long-term (millennia-scale) floodplain sedi-mentation rates and avulsion frequencies are calculated using 14C-dated deeply buried organic floodplain material from cross-valley borehole transects. The results indicate a downstream decrease in floodplain sedimentation rate and avulsion frequency along the anastomosed reach, which is consistent with dominant upstream control by sediment overloading. The data here link recent avulsion activity to increased sediment supply during the Little Ice Age (ca
1100 to 1950 AD). This link is supported by data showing that sediment supply to the upper Columbia study reach fluctuated in response to Holocene glacial advances and retreats in the hinterland. Upstream control of anastomosis has considerable implications for the reconstruction of the setting of interpreted ancient anastomosing systems. The present research underscores that anasto-mosing systems typically occur in relatively proximal settings with abundant sediment supplied to low-gradient floodplains, a situation commonly found in intermontane and foreland basins.
Keywords Anastomosing river, avulsion, floodplain sedimentation, fluctu-ating sediment supply, foreland basin, intermontane basin, radiocarbon age determination.
1Derald G. Smith passed away on 18 June 2014.
1 ©2017 The Authors. Sedimentology published by John Wiley & Sons Ltd on behalf of
INTRODUCTION
An anastomosing river can be defined as a river having multiple interconnected channels that enclose floodbasins (Makaske, 2001). Anasto-mosing rivers are commonly formed by avul-sions, flow diversions that cause the formation of new channels on the floodplain. When the new channels rejoin the parent channel down-stream, islands are formed, which consist of iso-lated portions of the floodplain. Over time, these islands develop central depressions because of natural levee accretion along the bounding channels (Adams et al., 2004). With their concave-up morphology, the islands of anastomosing rivers function as floodbasins (Makaske, 2001, fig. 2), trapping fine sediments and commonly hosting wetlands (Smith, 1983). The typical morphology of their islands is a fundamental characteristic of anastomosing ers, which makes them different from other riv-ers with multiple channels/thalwegs that exhibit convex-up islands or bars (Makaske, 2001). While the latter rivers may be classified as anabranching rivers, i.e. multichannel rivers with more or less stable islands or bars that reach up to bankfull or floodplain level (Nanson & Knighton, 1996), they are not anastomosing. Thus, anastomosing rivers constitute a subcate-gory of the larger catesubcate-gory of anabranching riv-ers and can be distinguished on the basis of their specific island morphology. In addition to a unique geomorphology, anastomosing rivers share a typical assemblage of sedimentary prod-ucts, which has been summarized in widely applied facies models (Smith, 1983; Makaske, 1998, 2001).
While the geomorphology and sedimentary products of anastomosing rivers are relatively well-known, the causes of their formation are not yet fully understood. In general, the forma-tion of anastomosing rivers is attributed to two factors: (i) high bank stability, often influenced by riparian (tree) vegetation (e.g. Smith, 1973; Harwood & Brown, 1993; Davies & Gibling, 2011); and (ii) net aggradation, driving the cre-ation of new channels by avulsion (Makaske
et al., 2009). The current debate on the origin of anastomosing rivers focuses on the controls of aggradation, being upstream or downstream (e.g. Abbadoet al., 2005; Kleinhans et al., 2012). The identification of dominant upstream or, alterna-tively, dominant downstream control of aggrada-tion is fundamental to modelling the depositional setting in which anastomosing
rivers occur. Associated with dominant upstream control (by excessive sediment sup-ply) is the occurrence of well-developed anasto-mosis in relatively proximal positions near sediment source areas. In contrast, dominant downstream control (by base-level rise) implies that well-developed anastomosis will occur in relatively distal positions near a (local) base level. Therefore, more insight into the nature of the controls on aggradation in modern anasto-mosing systems is needed to facilitate better interpretation of ancient depositional settings and controls.
Over the past three decades, the upper Colum-bia River, British ColumColum-bia, Canada, has played a prominent role in a series of studies of anasto-mosing river geomorphology and sedimentology (Smith, 1983; Makaske, 1998, 2001; Makaske
et al., 2002, 2009; Tabata & Hickin, 2003; Abbado et al., 2005; Kleinhans et al., 2012). Concepts derived from the upper Columbia River have been applied to modern, subrecent and ancient interpreted anastomosing systems, worldwide (many references in Makaske, 2001). The pioneering work in the upper Columbia River by Smith (1983) resulted in a well-estab-lished anastomosing river facies model that was later refined by Makaske (1998, 2001).
Upper Columbia anastomosis was initially believed to be caused by a rise in base level due to aggrading cross-valley alluvial fans (Smith, 1983). These cross-valley alluvial fans blocking the axial upper Columbia River were supposed to create backwater effects inducing low gradients and frequent overbank flooding, leading to high sedimentation rates in the val-ley upstream of the fans. The associated chan-nel-belt aggradation was taken as a driving force of frequent avulsions creating the anasto-mosing river. Upper Columbia River anastomo-sis was thus considered as a product of downstream control. Abbado et al. (2005) chal-lenged this notion of downstream control of upper Columbia River anastomosis and, mainly based on a morphological and river gradient analysis, proposed upstream control by sedi-ment overloading from important tributaries. This hypothesis was confirmed in a sediment budget analysis by Makaske et al. (2009) and in a modelling study by Kleinhans et al. (2012). These studies, however, are based on an analy-sis of present-day morphology and hydraulic and sedimentary processes, and therefore are of little use for evaluating the long-term controls of anastomosis. Makaske et al. (2002)
demonstrated that upper Columbia anastomosis has existed for at least 3000 years and, conse-quently, an evaluation of its controls should ideally cover the same period of time. Another issue that demands a long-term perspective is that upstream control would require unsteady sediment supply from the hinterland, for which causes have not been investigated (Kleinhans
et al., 2012).
In this study, long-term floodplain sedimenta-tion rates of the upper Columbia River have been determined in order to investigate the rela-tive importance of upstream and downstream control on the millennia timescale. It is expected that in the case of dominant upstream control long-term floodplain sedimentation rate decreases downstream from important tribu-taries. The opposite is expected for the case of dominant downstream control through backwa-ter effects induced by alluvial fans. A third option is that upstream and downstream control both equally influence upper Columbia River dynamics, in which case there would be no increase or decrease in long-term floodplain sed-imentation rate along the system. An additional issue addressed in this paper is the timing of tributary sediment input in relation to catch-ment processes.
STUDY REACH AND PREVIOUS WORK
The upper Columbia River (bankfull discharge
ca220 m3 sec 1 in the study reach) flows north-west through the Columbia Valley, which is part of the Rocky Mountain Trench in south-eastern British Columbia (Figs 1 and 2). The anastomos-ing reach is ca 100 km long and has developed in a tens of metres-thick unconsolidated valley fill. The upper Columbia floodplain in this reach is ca 15 km wide and flanked by mountain slopes and tributary valleys from which alluvial fans protrude into the Columbia Valley. One of the main cross-valley fans was formed by the Spillimacheen River, an important tributary draining the Purcell Mountains west of the Columbia Valley. Downstream of this fan, upper Columbia anastomosis is particularly well-devel-oped with three to five parallel channels (Fig. 3A). This ca20 km long reach (main chan-nel distance) is characterized by high crevasse activity and a relatively steep average river channel slope of ca 16 cm km 1 (Abbado et al., 2005). The lowerca10 km of this reach is steep-est with a channel slope of 215 cm km 1 (Fig. 4). Downstream of this reach, anastomosis is weakly developed with typically two to three parallel channels (Fig. 3B). This reach is ca
Fig. 1. The Rocky Mountain Trench with the anastomosing upper Columbia River, British Columbia, Canada. View looking ESE and up-valley from the Purcell Mountains with the Brisco Range of the Rocky Mountains in the background. Valley floor width in the middle of the photograph isca2 km.
40 km long (main channel distance) and bounded on the lower end by a large cross-val-ley alluvial fan at Nicholson. Few crevasses exist in this weakly anastomosing reach with an average channel slope of 68 cm km 1 (Abbado
et al., 2005).
Based on the morphological and slope differ-ences between the upper and lower reaches, and downstream fining of river bed material over the two reaches, Abbado et al. (2005) suggested higher aggradation rates in the upper reach as a driving force of more frequent crevassing and avulsion. These higher aggradation rates would be caused by high sediment input by the Spilli-macheen River overloading the upper Columbia. High in-channel alluviation rates in the upper reach would cause loss of channel flow capacity, levee overtopping and crevassing and, eventu-ally, avulsion and secondary channel formation. Thus, sediment overloading could be an upstream control of anastomosis, alternative to downstream control by aggrading cross-valley alluvial fans as proposed by Smith (1983).
Makaske et al. (2009) tested the idea of upstream control for the present-day anastomos-ing system, usanastomos-ing sediment transport measure-ments and calculations that cover two recent flood seasons, and showed that much more bed-load is trapped in the upper anastomosing reach than in the lower anastomosing reach (Fig. 4). Bedload storage in the channel leads to bed aggradation and loss of channel flow capacity (Makaske et al., 2009). Numerical modelling of the channel network confirmed this and addi-tionally predicted that the tendency to anasto-mose will disappear over time when upstream sediment supply equals the transport capacity (Kleinhans et al., 2012). The latter suggests that sustained anastomosis requires a forcing mecha-nism for in-channel bed aggradation.
In-channel bed aggradation is strongly linked to floodplain aggradation. With loss of channel flow capacity, channels will spill overbank more frequently and for longer periods causing an increase in floodplain sedimentation rates. In the short-term, sedimentation rates across the Fig. 2. The location of the upper Columbia River in south-eastern British Columbia, Canada. The dark grey zone indicates the upper, strongly anastomosing, reach; the light grey zone indicates the lower, weakly anastomosing, reach. Locations of the Harrogate (A) and Parson (B) borehole cross-sections (Fig. 6), and the Castledale cross-sec-tion (C) studied by Makaskeet al.(2002) (Fig. 5) are also shown.
floodplain are strongly variable, with natural levee sedimentation rates exceeding floodbasin sedimentation rates some distance away from the channel belt (T€ornqvist & Bridge, 2002). In the long-term, however, sedimentation associ-ated with crevassing and avulsion will cause filling of the accommodation space created in the floodbasins (Farrell, 2001). Therefore, aver-age long-term floodplain sedimentation rates for sedimentary sequences including deposits of multiple crevassing and avulsion cycles will not differ strongly across the floodplain.
An upstream or downstream forcing implies that floodplain sedimentation shows a down-stream or updown-stream trend, which is investigated here relative to an earlier estimate. An average long-term floodplain sedimentation rate of 175 mm year 1 for the upper Columbia River was calculated for location C (Fig. 2) by Makaske et al. (2002). This rate was based on a radiocarbon date of seven Scirpus lacustrisnuts buried by 79 m of upper Columbia floodplain deposits (Sample 3c in Fig. 5; Makaske et al.,
2002) and a time-depth analysis of many more, shallower, radiocarbon data (Makaske et al., 2002, fig. 8) from a floodplain-wide borehole cross-section (Fig. 5). Besides dateable beds of peat and humic clay, this cross-section shows a number of channel sand bodies with associated natural levee and crevasse splay deposits (domi-nantly silty clay and sandy silt/clay in Fig. 5) in the subsurface testifying to at least nine avulsion events in the past 3000 years. Because the sam-pling site of Sample 3c of Makaske et al. (2002) is located in the middle of the valley and may be underlain by organic-rich beds of a substan-tial thickness, compaction may have influenced its vertical position. Therefore, the average long-term floodplain sedimentation rate for this loca-tion will be reconsidered in this paper.
METHODS
Fieldwork was carried out in the Columbia Valley in August and September 2009. Two floodplain-A
B
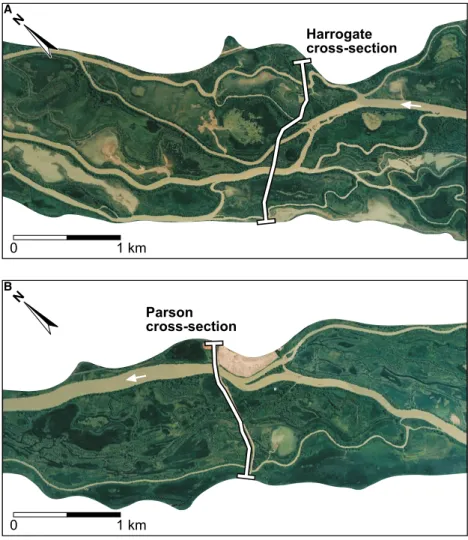
Fig. 3. The anastomosing river floodplain around the Harrogate (A) and Parson (B) cross-sections (panels A and B do not link up, but areca13 km apart). White areas along the floodplain represent mountain slopes and alluvial fans. Images from Google Earth (accessed in December 2010).
wide transects were investigated. One transect was located near Harrogate (Fig. 2), in the upper anas-tomosing reach; a second transect was located in the lower anastomosing reach near Parson (Fig. 2),
ca 17 km downstream (valley distance). The tran-sect previously studied by Makaskeet al.(2002) is located near Castledale about halfway between both transects of this study, near the transition between the upper and lower anastomosing reaches (Fig. 4). In order to find suitable, deeply buried, floodplain organic material for radiocarbon dating to enable calculation of long-term sedimen-tation rates, 52 borings and two vibracorings were carried out. Borings were carried out using an Edel-man auger and a gouge (Oeleet al., 1983). Because this equipment performs poorly in water-saturated sandy sediments, two vibracores were collected from the sandy fill of Channel 3 in the Harrogate transect using the equipment described by Smith (1984). The borings were spaced such that all natu-ral levees, crevasse splays and floodbasins in the transects were sampled. Maximum boring depth was 87 m below the surface and sediment proper-ties from the cores were described every 10 cm. Borehole locations were levelled relative to a local datum. The Harrogate cross-section was visited by boat, and the depth of navigable channels in this cross-section was determined by echo-sounding.
The Parson cross-section was accessed by car, and the channel depth of channels 1 to 3 in this cross-section was measured with a rod. The depth of the main channel in this cross-section (Channel 4) could not be measured in this way. Lithological cross-sections (Fig. 6) were obtained by plotting and stratigraphic correlation of borehole logs. The minimum thickness of the beds depicted in Fig. 6 is 20 cm, for the sake of clarity.
Seven peat samples were collected for selec-tion of material for radiocarbon dating. Sampling depth ranged from 42 to 67 m below the sur-face; sampling sites are indicated in Fig. 6. Seven sets of carefully selected terrestrial botan-ical macrofossils (such as Carex nuts) were sub-mitted for AMS 14C dating at the Centre for Isotope Research (Groningen, The Netherlands). Makaske et al. (2002) dated various fractions of organic-rich samples recovered from their bore-holes and concluded that selected terrestrial macrofossils yielded the most reliable results. Therefore, in this study, only selected terrestrial macrofossils have been dated. The selection pro-cedure described by T€ornqvist et al. (1992) was followed, using a 150 lm mesh sieve. In this study, only botanical macrofossils were selected. Radiocarbon ages (Table 1) were calibrated using OxCal 42 (Table 2).
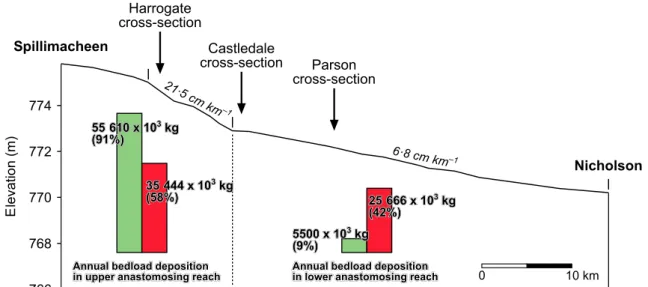
Fig. 4. Longitudinal profile of the upper Columbia River main channel between Spillimacheen and Nicholson (Fig. 2). Locations of the Harrogate, Castledale and Parson borehole cross-sections are indicated. Channel gradient data from Abbado et al.(2005) show a relatively steep upper reach and a relatively gentle lower reach. Vertical bars indicate estimates of the minimum and maximum amounts of bedload annually deposited in each reach, as calculated by Makaske et al.(2009) based on recent measurements. The green bars indicate a scenario in which 91% of the total amount of bedload deposited in the anastomosing reach is trapped in the upper reach, with the remaining 9% being deposited in the lower reach. The red bars indicate a more balanced scenario in which these values are 58% and 42%, respectively.
In order to minimize the influence of differ-ences in compaction on long-term floodplain sedi-mentation rates, more or less compaction-free sampling sites were preferred. Along the valley sides, organic-rich beds rest on top of bedrock or coarse and/or consolidated alluvial fan deposits that can be considered as the compaction-free substratum. Sampling of these beds was preferred to sampling of organic beds underlain, or poten-tially underlain, by thick Holocene soft sediments and organic-rich beds (such as the site of Sample
3c in Fig. 5). This sampling strategy is analogous to the sampling strategy commonly followed in coastal areas for the reconstruction of Holocene relative sea-level rise, where basal peat on top of a steeply sloping sandy Pleistocene surface is sam-pled (e.g. Cohen, 2005; Berendsenet al., 2007).
In addition to compaction, present floodplain topography may also influence calculated long-term average floodplain sedimentation rates, because sediment thickness to a radiocarbon-dated stratigraphic level tends to be greater Fig. 5. The Castledale borehole cross-section of the upper Columbia River floodplain made by Makaske et al. (2002). Location of the cross-section is shown in Fig. 2. The stippled line in the subsurface represents the approx-imate position of theca3850 cal yrBPtimeline. Positions of two14C-dated samples with ages (calibrated ages for the 2rage interval) described by Makaskeet al.(2002) are also shown. The black arrow in the upper panel (below sand body A) indicates a thin peat bed discussed in the text. The right-hand side of the upper panel links up to the left-hand side of the lower panel.
A B Fig. 6. Borehole cross-sections of the upper Columbia River flood plain made for this study showing subsurface lithology and stratigraphy and positions of 14 C-dated samples. Location of the cross-sections is shown in Fig. 2. The stippled line in the subsurface is the ca 3850 cal yr BP time-line. (A) The Harrogate cross-section of the upper study reach. (B) The Parson cross-section of the lower study reach.
beneath a natural levee than beneath a flood-basin. Therefore, in both cross-sections, sam-pling sites were located beneath natural levees and floodbasins.
FLOODPLAIN STRATIGRAPHY AND RADIOCARBON AGE DETERMINATIONS
The stratigraphy in the Harrogate and Parson cross-sections made for this study (Fig. 6) is broadly comparable to that of the Castledale cross-section (Fig. 5; Makaskeet al., 2002). Rela-tively narrow and thick channel-fill sand bodies occur in the subsurface of the upper Columbia floodplain and are associated with the present channels or are palaeochannel fills. Commonly, as a result of channel scour into palaeochannel fills in the subsurface, stacking of channel-fill
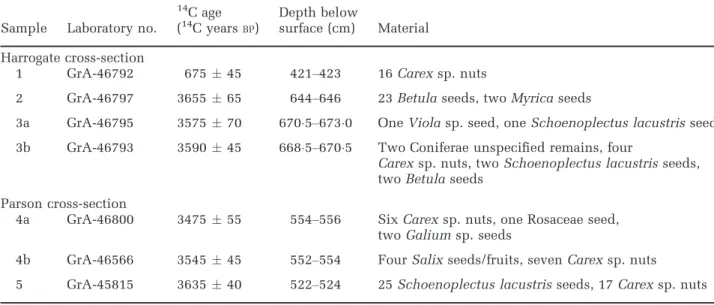
sand bodies occurs (e.g. Makaske et al., 2002, fig. 15). Wedge-shaped ‘wings’ of sandy clay and sandy silt are generally found on both sides of the present channels and are natural levee deposits. Often thick packages of sandy clay and sandy silt cover the top of palaeochannel-fill sand bodies, wedging out laterally on one or both sides of the sand body. These are final-stage channel and natural levee deposits, and may occasionally consist of sand and often grade laterally into silty clay. Channel-fill sand bodies and wedges of sandy clay and sandy silt are generally encased in a matrix of silty clay and clay, which are the floodbasin deposits. Occasionally, floodbasin deposits are split by laterally restricted peat and humic clay beds. Isolated, variously shaped, bodies of sand or sandy clay are interpreted as crevasse splay deposits. Below, the facies architecture of the Table 1. Radiocarbon age determinations from upper Columbia River floodplain material from the Harrogate and Parson cross-sections.
Sample Laboratory no.
14C age (14C yearsBP)
Depth below
surface (cm) Material Harrogate cross-section
1 GrA-46792 67545 421–423 16Carexsp. nuts
2 GrA-46797 365565 644–646 23Betulaseeds, twoMyricaseeds
3a GrA-46795 357570 6705–6730 OneViolasp. seed, oneSchoenoplectus lacustrisseed 3b GrA-46793 359045 6685–6705 Two Coniferae unspecified remains, four
Carexsp. nuts, twoSchoenoplectus lacustrisseeds, twoBetulaseeds
Parson cross-section
4a GrA-46800 347555 554–556 SixCarexsp. nuts, one Rosaceae seed, twoGaliumsp. seeds
4b GrA-46566 354545 552–554 FourSalixseeds/fruits, sevenCarexsp. nuts 5 GrA-45815 363540 522–524 25Schoenoplectus lacustrisseeds, 17Carexsp. nuts
Table 2. Calibration of radiocarbon ages.
Sample Laboratory no. 14C age (14C yearsBP) 1rage (cal yearsBP) 2rage (cal yearsBP) Harrogate cross-section 1 GrA-46792 67545 674–564 688–553 2 GrA-46797 365565 4084–3895 4222–3784 3a GrA-46795 357570 3976–3731 4085–3654 3b GrA-46793 359045 3966–3840 4074–3726 Parson cross-section 4a GrA-46800 347555 3831–3651 3886–3610 4b GrA-46566 354545 3898–3726 3966–3700 5 GrA-45815 363540 4064–3891 4084–3846
Harrogate and Parson cross-sections will be described and interpreted, building on the gen-eral picture sketched above. The 14C sampling sites and age determinations will also be described for each cross-section.
Harrogate cross-section
In the Harrogate cross-section (Fig. 6A), Channel 1 is a small secondary channel that has bypassed the now abandoned Palaeochannel A. The sand bodies associated with Channel 1 and Palaeochannel A seem relatively small, although borehole information below Channel 1 is lack-ing. The sand bodies are encased in a ca 5 m thick and ca 250 m wide (width/thickness ratio of 50) lens-shaped body of sandy silt/clay (L1/A in Fig. 6A), of which the upper part dominantly consists of natural levee deposits, but of which the deeper parts probably consist of crevasse splay deposits related to the avulsive formation of Palaeochannel A. Palaeochannel A and its natural levees can still be recognized morpho-logically at the surface. Below lens L1/A, multi-ple organic beds occur in the subsurface. The upper organic bed seems strongly deformed by the overlying clastic lens.
Channel 2 is the main channel of the Harrogate cross-section. It has a width/depth ratio of about 18 (width ca 70 m, depth ca 4 m) and pro-nounced, but narrow, natural levees. Channel 2 has scoured into palaeochannel-fill C, which on its turn seems to have scoured into sand body B
that is interpreted to be another palaeochannel fill. The stacking of channel-fill sand bodies is also recorded by a succession of lateral sandy silt/clay wedges that are separated by clay and organic beds. On the south-west side of Channel 2, the natural levee deposits of Palaeochannel C are represented by aca2 m thick sandy silt/clay wedge (LC) about 1 m below the recent natural levee deposits of Channel 2 (L2). A few metres lower, at the base of the section, the partly sandy upper part of a thick package of sandy silt/clay (LB) is interpreted to represent the natural levee deposits of Palaeochannel B.
Channel 3 is almost abandoned and filled with sand (Fig. 7). Its width of ca 40 m suggests that it is a former main channel, which probably started filling after the avulsive formation of Channel 2. Channel 3 has scoured into palaeochannel-fill D, which has its own lateral wedges of sandy silt/clay (LD) below the recent natural levee deposits of Channel 3 (L3). Vibra-coring showed a 6 m thick sand fill below Chan-nel 3, but it was not possible to distinguish the fill of Channel 3 from the fill of Palaeochannel D. A width/thickness ratio of ≤7 would apply if all vibracored sand is part of the fill of Channel 3.
Channel 4 is a small channel on top of a later-ally extensive sand body that has a width/thick-ness ratio of about 140 (width ca 400 m, thickness 29 m). This sand body is interpreted as a large complex of crevasse splay deposits (Fig. 8 shows a presently active crevasse splay of comparable size). Channel 4 has probably
Fig. 7. Channel 3 in the Harrogate cross-section, which has almost completely filled with sand. Channel width isca40 m.
developed from one of the crevasse channels on this splay. Due to a lack of deep borehole infor-mation below and near Channel 4, the depth of channel scour could not be determined. It is conjectured that Channel 4 is a relatively young channel that has not scoured through the under-lying sand sheet. The natural levee deposits of Channel 4 on top of the sand sheet (L4) consist of sandy silt/clay and are 2 m thick on average.
Channel 5 is an abandoned channel that was partially reoccupied by a recent crevasse from Channel 6. Its modest size indicates that it was a secondary channel. A borehole on its pro-nounced south-western natural levee shows a 27 m thick wedge of mainly sandy silt/clay (L5), but gives no information about its potential channel-fill sand body. An older sand body (F) with separate, partly sandy, lateral wedges (LF) exists below Channel 5. Its base could not be reached, but based on its considerable minimum thickness it is interpreted as a palaeochannel fill. Another sand body (E) of unknown extent occurs in the deeper subsurface south-west of sand body F. A lateral wedge of sandy silt/clay (LE) extends from sand body F to the north-east. The geometry of sand body E could not be deter-mined, but the limited borehole information already suggests a fairly substantial size and an associated palaeochannel.
The Harrogate section crosses Channel 6 directly downstream of the apex of a sharp bend, which is the downstream one of a couple of sharp bends (Fig. 3A). The channel is ca
35 m wide (the channel appears wider in Fig. 6 because of oblique crossing) and ca 3 m deep, giving a width/depth ratio of 12. The asymmetri-cal cross-sectional geometry of Channel 6, with the deepest part in the outer bend (i.e. south-west), is probably related to bend processes. Lat-eral as well as vertical migration of Channel 6 to the south-west is suggested by sandy channel deposits below the north-eastern (inner bend) natural levee. A ca 2 m thick package of sandy silt/clay (L6) extends from the natural levee of Channel 6 to the north-east. Two organic beds wedging out to the south-west were found below this package in the most north-eastern part of the cross-section. A 17 m thick bed of humic clay occurs at medium depth. At the base of the cross-section, a 02 m thick peat bed rests on the alluvial fan surface that rises to the north-east. The two organic beds are separated by a ca3 m thick, laterally extensive, package of sandy silt/ clay and silty clay that could represent either a crevasse splay or a natural levee of an unknown palaeochannel. Due to very poor accessibility, a narrow zone (about 100 m wide) on the edge of the floodplain was not included in the cross-sec-tion. Surface geomorphology in this zone and subsurface lithology in the most north-eastern part of the cross-section do not indicate palaeochannels running along the floodplain margin outside the cross-section.
In the Harrogate cross-section, dateable peat and humic clay beds occur along the valley sides (Fig. 6A), whereas large channels and Fig. 8. A large sandy crevasse splay
in the upper part of the upper Columbia River study reach,ca 5 km upstream of the Harrogate cross-section andca1 km downstream of the large
Spillimacheen River tributary. In the proximal part of the splay, a crevasse channel has formed. In the distal part of the splay, a narrow sandy lobe crosses an abandoned channel (lined with trees) and has prograded into a floodbasin. Approximate view width in the middle of the photograph is 09 km.
palaeochannel fills and related overbank depo-sits cluster in the central part of the cross-sec-tion. One sample for 14C dating was taken from sampling site 1 (Fig. 6A), in the top of a rela-tively thick organic bed directly below a 4 m thick complex of mainly sandy clay and sandy silt. This sample yielded a relatively young 14C age of 675 45 years BP (Table 1). Three other samples in the Harrogate cross-section were col-lected from two deeper sampling sites between 644 m and 673 m below the surface on both sides of the floodplain (sampling sites 2 and 3, Fig. 6A). These samples yielded 14C ages near 3600 years BP (Table 1). The two samples from sampling site 3 were taken from a thin peat bed directly overlying the alluvial fan surface. The sample from sampling site 2 represents the base of a peat bed covering a 2 m thick package of consolidated, laminated clay and silty clay, which onlaps the south-western valley side. Parson cross-section
In the Parson cross-section (Fig. 6B), Channel 1 is a secondary channel with an asymmetrical cross-sectional geometry, related to bend processes. The section crosses Channel 1 downstream of the apex of a bend (Fig. 3B). A sand body was found below the north-eastern (inner bend) natural levee of Channel 1, which is interpreted as chan-nel deposits of Chanchan-nel 1 that have migrated lat-erally to the south-west (comparable to Channel 6 in the Harrogate cross-section). The outer bend natural levee deposits of Channel 1 consist of a 23 m thick wedge of silty clay and sandy silt/ clay (L1 in Fig. 6B) resting on an organic bed that seems to have been cut by scour of Channel 1. North-east of Channel 1 aca2 m thick package of sandy silt/clay (L/C1) overlying the organic bed is probably natural levee and crevasse splay depo-sits. Underlying the organic bed is a palaeochannel sand body (A) capped by a 23 m thick package of sandy silt/clay (LA) wedging out and grading into silty clay laterally on both sides of the sand body. This package is interpreted as final-stage channel and natural levee deposits of Palaeochannel A. On both sides of sand body A, the lateral wedges (LA) are underlain by a clay bed, including a lens of organics to the south-west.
Channel 2 in the Parson cross-section is a small abandoned channel, which, judging from the floodplain geomorphology, seems to have been a crevasse channel branching from Channel 1 upstream of the cross-section. Channel 2 has scoured into theca 2 m thick laterally extensive
package of sandy silt/clay and silty clay (L/C1) that merges to the south-west with the natural levee deposits of Channel 1. This package is interpreted as a large complex of crevasse splay deposits existing between channels 1 and 3. Maximum scour depth of Channel 2 could not be determined, but its small size suggests very limited scour and only thin sandy channel deposits below the present channel base. The crevasse splay complex is underlain by a rela-tively thick (up to 16 m) organic bed that over-lies the lateral silty clay wedge of Palaeochannel A (LA). At the base of the cross-section below Channel 2, an extensive metres-thick package of silty clay and sandy clay/silt exists that may be floodbasin, crevasse splay and natural levee deposits of an unidentified palaeochannel.
Channel 3 is a secondary channel that is pre-sently abandoned. It has well-developed lateral wedges of sandy silt/clay (L3), partly underlying prominent, but narrow, natural levees. A bore-hole in the middle of the channel revealed a fine-grained channel-fill succession and no sand body associated with Channel 3. A large sand body (B), however, was found in the deeper sub-surface and is interpreted as palaeochannel fill. It is covered by a sandy silt/clay bed that is sep-arated from the lateral wedges of Channel 3 by a discontinuous clay bed. A clay plug in the top of sand body B can be interpreted as residual channel deposits, and it seems that Channel 3 has scoured into this clay plug, indicating chan-nel reoccupation. Palaeochanchan-nel B has partly scoured into sand body C that represents an older palaeochannel. Sand body C seems rela-tively wide, but its actual width may be less because the section may obliquely cross the sand body that has no morphological expression at the surface. A metres-thick package of sandy silt/clay (LB/C) covers sand body C and wedges out laterally to the north-east. These are the final-stage channel deposits and natural levee deposits of Palaeochannel C that seem to have merged with the natural levee deposits of Palaeochannel B. South-west of sand body B multiple wedges of sandy silt/clay occur, with the ones at medium depth (LC) interpreted as belonging to sand body C.
Channel 4 is the main channel in the Parson cross-section. Its depth was not measured in the field, but estimated at 3 m based on a hydraulic geometry relationship established for the upper Columbia River by Tabata & Hickin (2003). With a width ofca90 m, its width/depth ratio would be about 30. Channel 4 has 10 to 15 m high natural
levees with associated lateral wedges of sandy silt/clay (L4) in the subsurface. No channel-fill sand body was found near Channel 4, but this may be due to lack of borehole information below Channel 4. A lateral wedge of sandy silt/clay (L?; Fig. 6B) at medium depth below the south-west bank of Channel 4 may be natural levee deposits of a palaeochannel that was a predecessor of Channel 4. An organic bed runs beneath this wedge on both sides of Channel 4. Another organic bed occurs directly below the recent natu-ral levee deposits of Channel 4 and drapes the alluvial fan surface constituting the valley side.
In the Parson cross-section, three samples were extracted from two sampling sites at 522 to 556 m below the surface (Fig. 6B). Sampling site 4 is situated in a thin peat bed near the underlying north-eastern valley slope, which consists of heterogeneous coarse alluvial fan deposits covered by a 06 m thick succession of sandy clay/silt, silty clay and humic clay. Sam-pling site 5 represents the base of a humic clay bed overlying a metres-thick package of clay and silty clay, at an unknown distance above the base of the valley fill. The 14C ages of the three samples from the Parson cross-section are near 3550 yearsBP(Table 1).
SEDIMENTATION RATES
Floodplain sedimentation rates were calculated for the sediments overlying all 14C-dated sam-ples based on sample depth below the surface and calibrated age ranges (Table 3). Minimum and maximum rates were calculated based on different combinations of the extremes of the depth and age ranges.
Sedimentation rates calculated for the rela-tively young sample from sampling site 1 in the Harrogate cross-section are much higher than rates calculated for the other samples. This difference is attributed to lowering of sam-pling site 1 due to compaction of the underly-ing peat bed, upon rapid deposition of the clastic sediment wedge, associated with the avulsive formation of Channel 1 and/or Palaeochannel A (e.g. Van Asselen et al., 2010). Sampling sites 2 and 3, however, are located near the compaction-free substratum, being either coarse and consolidated alluvial fan deposits or the bedrock valley side. It can be expected that compaction effects on the vertical position of samples from these sites are mini-mal. Therefore, these samples are considered suitable for calculation of long-term average floodplain sedimentation rates that are not dis-torted by local compaction effects. Long-term average sedimentation rates in the Harrogate cross-section amount to 150 to 181 mm year 1 (Table 3), with sampling site 3 yielding slightly higher rates than sampling site 2.
In the Parson cross-section, long-term average sedimentation rates of 126 to 152 mm year 1 were calculated for the sediment intervals above sampling sites 4 and 5. Because sampling site 5 is not located on the valley side near the com-paction-free substratum, compaction of potential unknown organic-rich beds and soft sediments below the cross-section may have increased accommodation space above sampling site 5 rel-ative to sampling site 4, and may have increased sedimentation rates relative to a situation with-out compaction. Nevertheless, long-term average sedimentation rates for sampling site 5 are slightly lower than for sampling site 4, which
Table 3. Long-term sedimentation rates in the Harrogate and Parson cross-sections.
Sample
Depth below surface (cm)
2rage* (cal yearsBP)
Minimum sed. rate† (mm cal year 1)
Maximum sed. rate‡ (mm cal year 1) Harrogate cross-section 1 421–423 747–612 564 691 2 644–646 4281–3843 150 168 3a 6705–6730 4144–3713 162 181 3b 6685–6705 4133–3785 162 177 Parson cross-section 4a 554–556 3945–3669 140 152 4b 552–554 4025–3759 137 147 5 522–524 4143–3905 126 134
*In this case: BP=before 2009. †Based on minimum depth and maximum (2r) age. ‡Based on maximum depth and minimum (2r) age.
may be due to the thick natural levee of Channel 4 overlying sampling site 4.
EVALUATION OF THE HYPOTHESES
Longitudinal trend in sedimentation rate The calculated sedimentation rates suggest that long-term average sedimentation rates over the pastca4000 years in the Harrogate cross-section are higher than in the Parson cross-section (Table 3; Fig. 9), with the minimum calculated sedimentation rate for Harrogate being slightly lower than the maximum calculated sedimenta-tion rate for Parson. This result implies a down-stream decrease in long-term average floodplain sedimentation rates and a validation of the hypothesis of dominant upstream control.
The Castledale cross-section (Fig. 5) studied by Makaskeet al.(2002) is located about halfway
between the Harrogate and Parson cross-sections (Fig. 2). With the hypothesis of upstream control in mind, it may be expected that the long-term average sedimentation rate at Castledale will be intermediate between the rates determined for Harrogate and Parson. The long-term average sedimentation rate calculated for the Castledale cross-section is 175 mm year 1 (time interval 4550 years), which is relatively high compared to the rates calculated in this study. The high rate of Makaske et al. (2002) heavily relies on a deep 14C-dated sample, which was collected from the top a peat bed of unknown thickness in the middle of the valley (Sample 3c in Fig. 5). Unlike most of the sampling sites in this study, the vertical position of Sample 3c probably has been lowered by compaction of underlying peat. The strong deformation of the peat bed directly below clastic wedge L1/A in Fig. 6A demon-strates that clastic overburden may result in con-siderable compaction of underlying softer strata. Assuming that the peat bed formed nearly hori-zontal, because peat swamps are essentially flat topographic features, 15 m of compaction lower-ing of sampllower-ing site 1 seems to have occurred. In Fig. 5, it can be seen that Sample 3c is overlain by a ca 15 m thick clastic wedge of sandy silt/ clay that thins to the south-west. A thin peat bed occurs below the wedge where it pinches out to the south-west (arrow in Fig. 5). The top of this of these peat bed is 04 m higher than the top of the peat bed from which Sample 3c was taken. If both of these peat beds are connected and under-lie the clastic wedge similar to the bed below wedge L1/A in Fig. 6A, then at least 04 m of compaction lowering of the sampling site of Sample 3c seems to have occurred. However, the thin peat bed below the margin of the clastic wedge will also have been lowered by com-paction since its formation, for example because of the overburden of palaeochannel-fill A. Esti-mating this compaction lowering conservatively at 01 m, a realistic estimate of compaction low-ering of the sampling site of Sample 3c could be 05 m. Correction for this compaction lowering would result in a sedimentation rate of 163 mm year 1, which would be close to that in the Harrogate cross-section, but even this cor-rected value probably overrates the long-term average sedimentation rate at Castledale. Based on the Makaske et al. (2002) data set, Makaske
et al. (2009, fig. 10) inferred an average natural levee sedimentation rate of 165 mm year 1 for the Castledale cross-section. This value excludes rapid crevasse splay deposition associated with Fig. 9. Age–depth diagram with radiocarbon data
from this study. Calibrated age of 14C-dated samples is plotted against their depth below the surface at the borehole location. Width of the black bars represents the 2r error range of the calibrated age. Age is given in calendar yearsBP, which in this case is before 2009 (the year of sampling). For the purpose of clarity, the thickness of the bars is slightly greater than needed to correctly represent the sample thickness. The red zone indicates the range of long-term sedimentation rates calculated for the Harrogate cross-section (Table 3). The green zone indicates the range of long-term sedimentation rates calculated for the Parson cross-section (Table 3). Note the divergent position of the bar representing Sample 1 associated with com-paction (discussed in the text).
avulsive channel formation, which was taken as an explanation for the fact that the average natu-ral levee sedimentation rate was slightly lower than the long-term average floodplain sedimenta-tion rate of 175 mm year 1. With the latter rate now being considered too high because of com-paction effects, it seems much more likely that the real long-term average floodplain sedimenta-tion rate in the Castledale cross-secsedimenta-tion is lower than the average natural levee sedimentation rate, because natural levees are relatively rapidly aggrading environments. Taking into account this additional information, a long-term average floodplain sedimentation rate, uninfluenced by compaction effects, of ca 15 mm year 1 for the Castledale cross-section, which would be inter-mediate between the rates for Harrogate and Par-son, seems realistic.
Longitudinal trend in avulsion frequency Part of the hypothesis of dominant upstream control of upper Columbia River anastomosis is the notion that high bedload input into the anas-tomosing reach could lead to bed aggradation, loss of channel flow capacity and an increased frequency of crevassing and avulsions. In this chain of events, high floodplain sedimentation rates are a final effect, resulting from an increase in avulsion frequency. If this notion is correct, the avulsion frequency in the Harrogate cross-section should be higher than in the Parson cross-section. Below, this part of the hypothesis will be evaluated.
Based on the 14C dates for sampling sites 2 to 5, which are in the range of approximately 4000 to 3750 cal yrBP, and stratigraphic interpretation of the borehole data, the ca 3850 cal yr BP time-line has been drawn in the cross-sections herein, following the method of Gouw & Erkens (2007). In the Harrogate cross-section (Fig. 6A), the 3850 cal yr BP timeline runs directly above sam-pling site 2 (2r range of 14C date 4222 to 3784 cal yrBP). It then follows the organic bed to the north-east, where the stratigraphy suggests that it continues directly above sand body B, whereas it probably passes below the lateral clas-tic wedges of sand body D. In the north-east part of the cross-section, the 14C dates for sampling site 3 (maximum 2rrange 4085 to 3654 cal yrBP) indicate that it will run more or less through this sampling site following the general stratigraphy to the south-west and therefore presumably pass-ing beneath the lateral clastic wedge of sand body E. Its position beneath Channel 4 is
unknown due to a lack of deep borehole infor-mation showing stratigraphy. In the Parson cross-section (Fig. 6B), the 14C dates for sam-pling sites 4 and 5 (2r range of all 14C dates 4084 to 3610 cal yr BP) indicate that the 3850 cal yr BP timeline follows the peat bed underlying the lower clastic wedges below the natural levees of Channel 4, which also implies that the timeline runs below the lateral clastic wedges of Palaeochannel C. In absence of dating evidence, the stratigraphy to the south-west suggests that the 3850 cal yr BP timeline passes below the lat-eral clastic wedges of Palaeochannel A.
In order to determine the avulsion frequency in each cross-section, the number of channels formed since 3850 cal yr BP was determined by counting the number of channels and palaeochannel sand bodies having lateral wedges of overbank deposits above the timeline. In the Harrogate cross-section (Fig. 6A), the six present channels and palaeochannels A, C, D, E and F all have the base of their natural levee deposits above the timeline, which would imply that eleven avulsions have occurred in the past
ca 3900 years. Eleven avulsions is considered a minimum value, because palaeochannel sand bodies may have been missed, due to low bore-hole density in the floodbasin between Palaeochannel A and Channel 2, and limited boring depth below the wide sand body below Channel 4. Also there is a slight chance that avulsions by reoccupation of abandoned chan-nels have been overlooked, although a channel reoccupation usually leads to a clearly recogniz-able double pair of lateral clastic wedges. Avul-sion frequency in the Harrogate cross-section can thus be estimated at ≥28 avulsions kyr 1 (Table 4). In the Parson cross-section (Fig. 6B), the four present channels and the three
Table 4. Avulsion frequency and average long-term floodplain sedimentation rate in three cross-sections of the upper Columbia River floodplain.
Cross-section Avulsion frequency (avulsions kyr 1) Sedimentation rate* (mm cal year 1) Harrogate ≥28 150–181 Castledale 21 to≥28 ≤175† Parson 13–21 126–152
*Average long-term floodplain sedimentation rate. †The value of 175 mm cal year 1 (Makaske et al., 2002) is probably influenced by peat compaction and therefore may be too high; see text for discussion. ©2017 The Authors. Sedimentology published by John Wiley & Sons Ltd on behalf of
palaeochannels A, B and C have lateral clastic wedges above the 3850 cal yrBP timeline, which would mean that seven avulsions have occurred in ca 3900 years. It may be argued, however, that Channel 2, which debouches in a floodbasin
ca 05 km downstream of the cross-section, is a crevasse rather than an avulsion channel. Also the somewhat larger Channel 3 could be reinter-preted as a crevasse channel, because it debouches in a floodbasin 1 to 2 km down-stream of the cross-section. On the other hand, a separate lateral wedge (L?; Fig. 6B) below the natural levee deposits of Channel 4 suggests a fourth palaeochannel that should be taken into account, with Channel 4 possibly having been formed by reoccupation of this earlier channel. Thus, the number of avulsions since 3850 cal yr BP is five at minimum and eight at maximum, which gives a frequency between 13 and 21 avulsions kyr 1 for the Parson cross-section (Table 4). These figures indicate that avulsion frequency in the past ca 3900 years has been significantly higher at Harrogate than at Parson, which fits with higher sedimentation rates at Harrogate and the hypothesis of upstream con-trol of anastomosis by high bedload input.
In the Castledale section, the 3850 cal yr BP timeline runs between the sampling sites of Sample 3c (2r range of14C date 4620 to 4380 cal yr BP) and Sample 6a (2r range of 14C date 2820 to 2580 cal yr BP) and thus above the sand body of Palaeochannel C. To the south-west,14C dates bracketing the timeline are lacking but strati-graphically the 3850 cal yr BP timeline can be expected to more or less overlie the sandy silt/ clay and silty clay deposits in the deeper sub-surface. To the north-east, stratigraphy suggests that the timeline cuts through palaeochannel sand body E and its lateral silty clay wedges. Channels 1 to 6 and palaeochannels A, B, D and possibly E have lateral wedges of overbank deposits above the timeline, indicating that ten avulsions may have occurred in this section since 3850 cal yr BP. The double pairs of clastic wedges associated with Palaeochannel A, how-ever, suggest a reoccupation event of this chan-nel, which would mean that the maximum number of avulsions since 3850 cal yr BP is ele-ven. This number may even be higher if channel sand bodies in the subsurface have been missed, for example below the large floodbasin between channels 4 and 5. The maximum avulsion fre-quency in the Castledale section therefore is
≥28 avulsions kyr 1, which would be equal to the frequency in the Harrogate section. However,
Channel 2 is a crevasse channel that may not develop into an avulsion, and the reoccupation of Palaeochannel A may also represent crevasse activity rather than avulsion. Additionally, the base of the clastic wedges of Palaeochannel E may be below the timeline, which would mean that the avulsion predates 3850 cal yrBP. A min-imum number of avulsions in the past ca
3900 years can be estimated at eight, giving a frequency of 21 avulsions kyr 1. In conclusion, the avulsion frequency for the Castledale section is unlikely to be higher than for the Harrogate section and almost certainly not lower than the avulsion frequency for the Parson section (Table 4), which is consistent with a down-stream decrease in avulsion frequency and dom-inant upstream control of anastomosis.
FLUCTUATIONS IN SEDIMENT SUPPLY
Remarkably, the 14C ages collected here are all near 3550 years BP. Because the four sampling sites in organic beds in two cross-sections areca
17 km apart, this suggests a period of wide-spread peat formation in the upper Columbia Valley just after 4000 cal yr BP. Peat growth in this environment can be expected to occur dur-ing periods of reduced suspended sediment input. The stratigraphy in the cross-sections thus suggests a period of increased sediment input to have followed the period of widespread peat growth. A shallower level with more exten-sive organic beds occurs at about medium depth in both cross-sections. This level was dated only in the Harrogate cross-section at 675 45 BP (Fig. 6, sampling site 1). This date agrees fairly well with two dates from organic beds in the Castledale cross-section yielding 430 80 BP and 500 50 BP (samples 4c and 5c from Makaske et al., 2002). These organic beds at medium depth generally underlie natural levee and crevasse splay deposits of the modern chan-nels. A comparable architecture of a recent clas-tic bed covering widespread peat beds was documented for the Rhine-Meuse delta by Gouw & Erkens (2007) and was shown to result from increased sediment supply due to deforestation in the hinterland (Erkens, 2009; Middelkoop
et al., 2010). In summary, the radiocarbon-dated stratigraphy suggests fluctuating sediment sup-ply to the Columbia Valley.
Such fluctuations would lead to overfeeding and underfeeding of the river, which would explain the upstream control. The present study
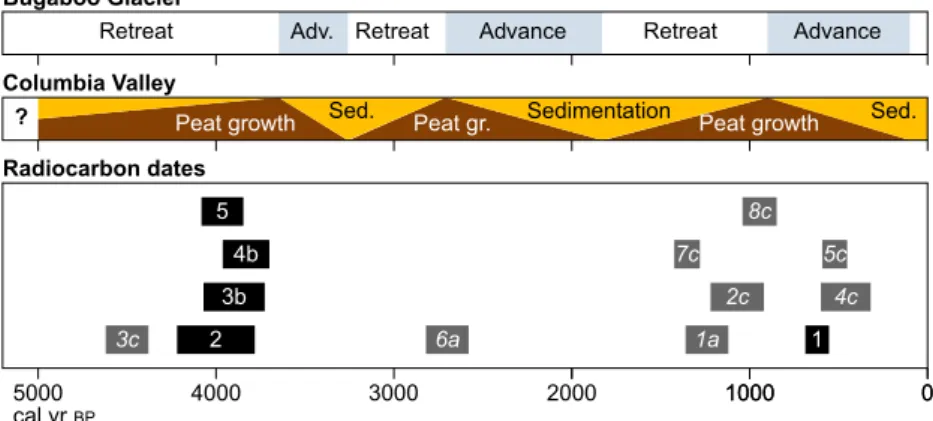
identifies a possible cause in the hinterland for the fluctuations. At present, the main sediment-feeding system to the study reach is the Spilli-macheen River, which drains a montane and partially glaciated catchment in the Purcell Mountains. On the millennia timescale, climatic fluctuations affecting the glaciated Spilli-macheen catchment seem the prime driving force of fluctuations in sediment supply. The Bugaboo Glacier drains to the upper Columbia Valley via Bugaboo Creek (Fig. 2), which debouches into the upper Columbia River a few kilometres upstream of the Spillimacheen River. For the Bugaboo Glacier in the Purcell Moun-tains, a history of Holocene advances and retreats is documented by Osborn (1986) and Osborn & Karlstrom (1988). Neighbouring gla-ciers to the north-west of the Bugaboo Glacier are located in the Spillimacheen catchment, and their Holocene history can be expected to be very similar to that of the Bugaboo Glacier. Three distinct periods of middle to late Holo-cene glacial expansion have been reported for the Bugaboo Glacier, the last one being known as the Little Ice Age (ca 1100 to 1950 AD). The 14C dates of organic beds in the upper Columbia Valley carried out for this study and by Makaske
et al. (2002), plotted along with the glacial chronology, largely fall in intervening periods, but often near the transition to glacial expansion (Fig. 10). This pattern suggests that periods of increased sediment supply to the upper Colum-bia Valley are linked to periods of glacial
expansion. In general, near glaciers most sedi-ment becomes available for transport in periods of moraine deposition (i.e. during maximum ice cover) and in periods of ice retreat directly fol-lowing maximum ice cover, because of exposure of large areas of unstable glacial deposits to flu-vial erosion (e.g. Leonard, 1986). Such (acceler-ated) reworking of glacial deposits following deglaciation has been described as paraglacial processes (see Ballantyne, 2002, for a review). Additionally, periods of glacial expansion are likely to be colder, with reduced vegetation cover resulting in more unstable scree slopes in high altitude catchments and therefore higher sediment supply to rivers.
It seems very likely that floodplain sedimenta-tion rates in the upper Columbia Valley have fluctuated on the millennia timescale in response to Holocene glacial cycles. During peri-ods of reduced ice cover and glacial activity, sediment supply to the Columbia Valley must have been relatively low, allowing peat beds to develop in wet floodbasins further away from the channels, near the edges of the floodplain. Because peat growth probably was slow (in the absence of rapid base-level rise) and sedimenta-tion continued near the channels, cross-levee gradients gradually increased and favourable conditions for avulsion developed during these periods. With the channels having been pre-pared for avulsion, increased sediment supply during and following glacial advances will prob-ably have induced crevassing and avulsion
Fig. 10. The relationship between Neoglacial periods and Columbia Valley peat chronology. The upper panel shows periods of glacial advance (blue) and retreat (white) for the Bugaboo Glacier (Osborn, 1986; Osborn & Karl-strom, 1988). The middle panel shows inferred periods of glacially induced sedimentation in the Columbia Valley and intervening periods of increased peat growth. The lower panel shows 14C dates of upper Columbia River floodplain organic beds, plotted as boxes indicating the 2rage interval. When more dates from the same sampling site were available, the date with minimum standard deviation was chosen. Dark grey boxes indicate 14C dates from Makaskeet al.(2002, table 2); black boxes indicate14C dates from this study.
activity. A recent increase of avulsion activity can be recognized in the stratigraphy of the Har-rogate cross-section (Fig. 6A) where lateral clas-tic wedges associated with a substantial number of present and recently abandoned channels (for example, channels 1 and 4 and Palaeochannel A) dominate the shallow stratigraphy, whereas at medium depth more extensive peat, humic clay and clay beds occur. The same holds for the Castledale cross-section (Fig. 5), although laterally extensive sand bodies, such as the one below Channel 4 in Fig. 6A, are absent here. In the Parson cross-section (Fig. 6B), the same phe-nomenon can be recognized, but with a reduced number of active channels. Radiocarbon-dated channel ages from the Castledale cross-section (Makaske et al., 2002, fig. 9) indicate that chan-nels 1, 2, 3 and 6 and Palaeochannel D all have been formed in the past millennium, i.e. the Lit-tle Ice Age, whereas stratigraphy suggests that Palaeochannel A has been reoccupied and a cre-vasse channel has been formed north-east of Channel 6 in the same period. Comparable dat-ing evidence is not available for the Harrogate cross-section, but the 14C date from sampling site 1 suggests that the majority of the relatively coarse-grained sediment bodies, and the associ-ated channels and palaeochannels in the upper part of the section can also be linked to the Lit-tle Ice Age.
It may be that human activities in the catch-ment, such as deforestation and development of infrastructure, have also increased sediment supply in the 19th and 20th Centuries and therefore may in part be responsible for an increase in crevassing and avulsion activity. Because expansion of (European) human activi-ties in the area largely coincided with the final stages of the Little Ice Age, in which sediment supply is believed to have greatly increased because of deglaciation, the potential human influence for this period cannot be separated from the glacial influence. The presently high sediment supply rates reported by Makaske
et al. (2009) appear to be a logical phenomenon in the aftermath of both the Little Ice Age and a period of strong expansion of human activities. Consistent channel changes in the period since European settlement have been observed in other rivers in North America, but there too it has been difficult to unambiguously relate these changes to human impact (e.g. Joeckel & Hene-bry, 2008).
The recent sediment pulse associated with the Little Ice Age is likely to have affected the upper
Columbia gradient line. The steep section in the upper anastomosing reach (Fig. 4) was inter-preted by Kleinhans et al. (2012) as a result of sediment overfeeding in the past, which caused steepening to propagate into the anastomosing reach from the upstream boundary, i.e. the Spil-limacheen–Columbia confluence. Their morpho-dynamic modelling could only reproduce the present-day longitudinal profile by temporary bed sediment overfeeding for a century. These authors concluded that increased avulsion fre-quency in the recent past may have been caused by a temporary disequilibrium between sedi-ment feed and transport capacity. With the data presently available, it can be concluded that this period of temporary sediment overfeeding is very likely to coincide with the optimum and the final stages of the Little Ice Age. The steep section in the present-day longitudinal profile is approximately between the Harrogate and the Castledale cross-sections (Fig. 4), which means that the wedge of coarse sediment prograding into the reach from the Spillimacheen River is present in the Harrogate cross-section, but not in the Castledale cross-section. This recent sedi-ment overfeeding could be reflected in the rela-tively coarse-grained and laterally quite extensive clastic wedges in the upper part of the Harrogate cross-section. It cannot be excluded, however, that the long profile also reflects sedi-ment pulses from before the Little Ice Age, and that the present-day steep section thus has a composite nature.
IMPLICATIONS FOR DEPOSITIONAL SETTINGS AND FACIES MODELLING
The sedimentation rates and avulsion frequen-cies presented above support the hypothesis of dominant upstream control of upper Columbia anastomosis by long-term sediment overloading. Although this finding does not exclude the validity of downstream control by base-level rise for other anastomosing systems, it means a para-digm shift because the upper Columbia with its supposed downstream control has been influen-tial as a modern example of anastomosis, fre-quently used to interpret ancient alluvial sequences. Upstream control of anastomosis fits with the foreland basin (e.g. Smith & Putnam, 1980; Kirschbaum & McCabe, 1992; Nadon, 1994; Plint & Wadsworth, 2003; Cuiti~no et al., 2015) and intramontane and intermontane basin settings (e.g. Bakker et al., 1989; Dill et al.,
2003) of many interpreted subrecent/ancient anastomosing systems much better than down-stream control. The present study indicates that the prime driving force of anastomosis in these settings is upstream control (sediment overload-ing) of the rivers entering the low-gradient fore-land or intramontane basin, rather than downstream control associated with strong basin subsidence, as proposed earlier (Smith & Put-nam, 1980; Smith, 1986; Makaske, 2001). Domi-nant upstream control implies that within such basins anastomosing systems tend to be best developed in the more proximal parts, instead of in the distal parts near the (local) base level. It also implies that anastomosing systems are
akin to what have recently been called ‘distribu-tive fluvial systems’ (Weissmannet al., 2010).
However, with continued higher aggradation upstream, relative to downstream, anastomosing rivers will build up a higher gradient and, as a response, will acquire more energy to erode their banks and maintain channel flow capacity, in spite of high sediment loads. Consequently, the rivers will become less prone to avulsions and anastomosis will fade out.
Downstream control by base-level rise pro-vides a mechanism to restore and maintain a low gradient in the basin under a high sediment deposition rate. Therefore, in the long-term, an anastomosing river can only continue to exist if
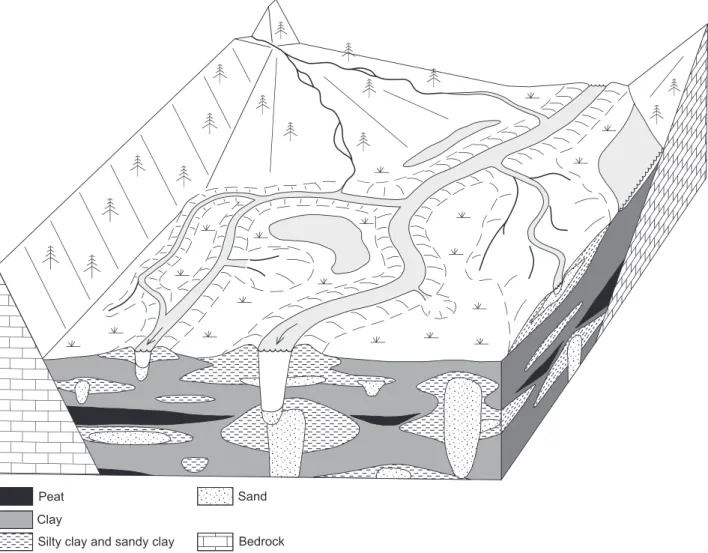
Fig. 11. Schematic block diagram of an anastomosing river in a temperate humid, intramontane (valley) setting (after Makaske, 1998, 2001) showing geomorphological elements and associated textural facies. The diagram shows the proximal part of the system directly downstream of a large alluvial fan, where anastomosis is well-developed. Because of high sediment loads entering the anastomosing river through the alluvial fan system, crevassing and avulsion is occurring in the proximal reach of the anastomosing system. Peat beds at medium depth of the exposed valley fill represent a period of reduced sediment supply and fluvial activity.
both upstream and downstream controls are involved. Thus, while high sediment supply is a primary cause of anastomosis, downstream con-trol of relative base-level rise remains important as a secondary condition to maintain anastomo-sis over long periods of time. In the upper Columbia River, downstream control by base-level rise is probably attained as follows. Gla-cially driven enhanced sediment supply rates force anastomosis from upstream, but simultane-ously increase the aggradation rates of the large cross-valley alluvial fan acting as a downstream boundary of the anastomosing reach. This mechanism helps to maintain a dynamic equi-librium between upstream sediment overloading as a primary control on anastomosis, and down-stream base-level rise as a secondary control on anastomosis.
The results from this study on the controls of anastomosing systems, if valid for anastomosing rivers in general (which still needs to be investi-gated) have two important implications for facies modelling of anastomosing river basin
fills. Firstly, with dominant upstream control anastomosing river deposits will show a distinct longitudinal facies-architectural trend. The prox-imal anastomosing river sequence will show a high proportion of channel and crevasse splay sand bodies and relatively thick and wide com-plexes of silty/sandy avulsion-related deposits encased in a clayey, possibly organic, matrix. The distal anastomosing river sequence will show a lower proportion of the coarse architec-tural elements, because of fewer avulsions and channels here. Secondly, with anastomosis being a disequilibrium form forced by fluctua-tions in sediment supply, thicker sequences of anastomosing river deposits will show an alter-nation of intervals dominated by fine, possibly organic, deposits and intervals with more abun-dant coarse-grained architectural elements. Depending on the forcing mechanisms, this alternation may be more or less regular. For example, Abels et al. (2013) demonstrated cyclicity of a fluvial intermontane basin fill caused by astronomically forced climate changes
Fig. 12. Schematic block diagram of an anastomosing river system in a foreland basin showing geomorphological elements and associated textural facies. The diagram shows well-developed anastomosis in the proximal part of the basin, directly downstream of a fluvial fan, where sediment supply rates are relatively high. The system is fed from an uplifted and glaciated mountain catchment. An alternation of clastic and organic packages in the (distal) subsurface of the basin has formed in response to glacial fluctuations in sediment supply. Laterally extensive and predominantly clayey packages enclose variously shaped sand bodies being channel fills and crevasse splay deposits. Within the foreland basin, there is a downstream decrease in grain size, rate of basin subsidence and intensity of fluvial morphodynamics (including crevassing and avulsion activity within the anastomosing river system).
that led to recurrent large-scale reorganizations of the fluvial system. A less regular cyclicity in a montane setting may be caused by tectonics (e.g. Dillet al., 2003).
In Fig. 11, the existing textural facies model for the upper Columbia River (Makaske, 1998, 2001) has been modified, taking into account the find-ings from this study. This figure only shows the proximal part of the anastomosing system, directly downstream of the alluvial fan system through which much sediment is supplied to the anasto-mosing reach. Downstream of the anastoanasto-mosing reach a similar alluvial fan may provide a local base level. Based on the findings here in the intra-montane upper Columbia River, a tentative textu-ral facies model for anastomosing rivers in a large (foreland) basin can be worked out (Fig. 12), refin-ing the early models for such settrefin-ings as described by Smith & Putnam (1980) and Smith (1986). The model in Fig. 12 shows the longitudinal trend in sedimentary environments and related facies architectures in a glacially fed anastomosing sys-tem in a foreland basin. Both diagrams (Figs 11 and 12) apply to a temperate humid climatic set-ting, with glacially controlled sediment supply and potential for peat formation.
CONCLUSIONS
Anastomosing rivers are a major category of allu-vial river systems of which the facies and sedi-mentary architecture are well-studied and understood. Much less clear and still a matter of debate are the controlling factors of the genesis of anastomosing rivers and the settings in which these controlling factors develop. Three conclu-sions following from this work contribute to a bet-ter understanding of controlling factors and settings and therefore have geological significance.
1 Upper Columbia River anastomosis is likely to be upstream controlled on the millennia time-scale, as evidenced by downstream decreasing average floodplain sedimentation rates and avul-sion frequencies over the past ca 3900 years. The underlying mechanism is that high bedload supply causes bed aggradation, loss of channel flow capacity and increased overbank flooding and floodplain sedimentation, as well as abun-dant crevassing and avulsions leading to forma-tion of new channels. This mechanism of upstream control may apply to many other anas-tomosing rivers.
2 Sediment supply to the upper Columbia flood-plain probably fluctuated in response to Holocene
glacial advances and retreats in the hinterland, as indicated by extensive organic beds that formed during the final stages of glacial retreat. Increased supply of clastic sediments (and hardly any devel-opment of organic beds) is inferred for the final stages of glacial expansion and the early stages of glacial retreat. Raised avulsion activity, presum-ably because of increased sediment supply, occurred, for example, during the Little Ice Age (1100 to 1950 AD). Fluctuations in sediment sup-ply and avulsion frequency strongly suggest that upper Columbia anastomosis is a disequilibrium feature caused by repeated disturbance of the flu-vial system. In other systems, such fluctuations in sediment supply could be generated by non-gla-cial climatic fluctuations, tectonics and human interference.
3 Relatively proximal settings where abundant sediment is supplied to low-gradient floodplains appear to be favourable for development of anas-tomosing systems. These settings comprise inter-montane and foreland basins. Thick sequences of anastomosing river deposits require prolonged low-gradient conditions, which can be achieved by base-level rise. Therefore, in addition to upstream control, downstream control remains an important secondary condition that can explain the occurrence of anastomosing systems over very long periods of time.
ACKNOWLEDGEMENTS
We appreciated the help of Hanneke Bos and Wim Hoek with selecting botanical terrestrial macrofossils. Financial support for this research was granted by the Netherlands Organisation for Scientific Research (NWO), Utrecht University and the Molengraaff Foundation. Funding by Alterra (Wageningen University and Research Centre), enabling presentation of this paper at the 10th International Conference on Fluvial Sedimentology (Leeds, July 2013), is gratefully acknowledged. The constructive reviews of Alessandro Ielpi and Vern Manville helped us to substantially improve this paper.
REFERENCES
Abbado, D.,Slingerland, R.andSmith, N.D(2005) Origin of anastomosis in the upper Columbia River, British Columbia, Canada. In: Fluvial Sedimentology VII (Eds M.D. Blum, S.B. Marriot and S.M. Leclair), Int. Assoc. Sedimentol. Spec. Publ.,35, 3–15.