A carrying capacity framework for soil phosphorus and hydrological
sensitivity from farm to catchment scales
Rachel Cassidy
a,⁎
, Ian A. Thomas
a,b, Alex Higgins
a, John S. Bailey
a, Phil Jordan
c aAgri-Environment Branch, Agri-Food and Biosciences Institute (AFBI), Newforge Lane, Belfast BT9 5PX, Northern Ireland, UK bUCD Dooge Centre for Water Resources Research, School of Civil Engineering, University College Dublin, Belfield, Dublin 4, Ireland c
School of Geography and Environmental Sciences, Ulster University, Coleraine, Northern Ireland, UK
H I G H L I G H T S
•Soil P and HSA runoff was risk mapped for 7693fields in a 220 km2catchment. • Soil P and HSA risks were assessed at
field, farm and catchment scales. •The framework identifies and prioritises
areas posing risks to water quality. •Carrying capacity for above agronomic
optimum soil P is 15% of sub-catchment areas.
• Carrying capacity for high soil P and runoff risk is 1.5% of sub-catchment areas. G R A P H I C A L A B S T R A C T
a b s t r a c t
a r t i c l e i n f o
Article history: Received 1 March 2019Received in revised form 29 May 2019 Accepted 30 May 2019
Available online 04 June 2019 Editor: Ouyang Wei
Agriculturalfields with above optimum soil phosphorus (P) are considered to pose risks to water quality and es-pecially when those areas are coincident with hydrologically sensitive areas (HSAs) that focus surface runoff pathways. This is a challenge to manage in areas of agricultural intensity in surface water dominated catchments where water quality targets have to be met. In this study, a soil P survey of 13 sub-catchments and 7693fields was undertaken in a 220 km2catchment. HSAs were also determined as the top 25th percentile risk from a runoff routing model that used a LiDAR digital elevation model and soil hydraulic conductivity properties. Distributions of these spatial data were compared with river soluble reactive phosphorus (SRP) concentration measured fort-nightly over one year. The results showed that 41% offields exceeded the agronomic optimum for soil P across the sub-catchments. When compared with the available water quality data, the results indicated that the high soil P carrying capacity area of the sub-catchments was 15%. Combining high soil P and HSA, the carrying capacity area of the sub-catchments was 1.5%. The opportunities to redistribute these risks were analysed onfields with below optimum soil P and where HSA risk was also minimal. These ranged from 0.4% to 13.8% of sub-catchment areas and this limited potential, unlikely to fully reduce the P pressure to over-suppliedfields, would need to be con-sidered alongside addressing this over-supply and also with targeted HSA interception measures.
© 2019 The Authors. Published by Elsevier B.V. This is an open access article under the CC BY-NC-ND license (http://creativecommons.org/licenses/by-nc-nd/4.0/). Keywords:
Soil phosphorus Runoff
Hydrologically sensitive areas Agronomic optimum Nutrient management Water quality
⁎ Corresponding author.
E-mail address:[email protected](R. Cassidy).
https://doi.org/10.1016/j.scitotenv.2019.05.453
0048-9697/© 2019 The Authors. Published by Elsevier B.V. This is an open access article under the CC BY-NC-ND license (http://creativecommons.org/licenses/by-nc-nd/4.0/). Contents lists available atScienceDirect
Science of the Total Environment
1. Introduction
Combining agricultural production and environmental targets can be challenging in intensive settings and may result in trade-offs be-tween these objectives (Macintosh et al., 2019). Water quality impacts, for example, through transfer of residual nutrients such as nitrogen (N) and phosphorus (P), pesticides and eroded soil surfaces are well-established pressures (Jarvie et al., 2007;Withers and Lord, 2002) and reported on a global scale (Schoumans et al., 2014;Withers et al., 2014). In European Union member states this agricultural pressure for nutrients is managed through state-based action programmes linked to the Nitrates Directive (91/676/EEC,Council of the European Union, 1991), or by policy driven voluntary schemes to which farmers sub-scribe (Batáry et al., 2015;Lastra-Bravo et al., 2015;Pavlis et al., 2016). Compliance with the Nitrates Action Programme in Northern Ireland, which covers both the Nitrates Action Programme Regulations as well as the Phosphorus (Use in Agriculture) Regulations, is compul-sory for farmers. The Programme includes constraints to the use and magnitude of nutrient applications via chemical fertiliser or organic ma-nure amendments, the control of application timing and of animal stocking rates on a per hectare basis (The Nitrates Action Programme Regulations (Northern Ireland) 2014 No. 307, 2014). Voluntary schemes providefinancial incentives and support to farmers to increase water purification functions through measures which intercept surface runoff pathways and entrap water-borne nutrients, including sediments and other pollutants (DAERA, 2018a). Such options include the use of cover crops to retain nutrients on arable land (Cooper et al., 2017) and the establishment of riparian buffer zones adjacent to watercourses. In many countries, these regulations and schemes are applied at the larg-est scales as blanket, one-size-fits-all policies either in specifically vul-nerable zones or as whole territory measures (McDowell et al., 2016). In the EU, checks, or cross-compliance, against regulatory measures de-termine Basic Payment Scheme (BPS) support, which is allocated on the basis of farm area as a monetary subsidy.
The specifications for regulations and supported actions in environ-mental schemes are very tightly restricted to enable auditing and pro-tect against fraud (Fraser, 2012;Hart and Latacz-Lohmann, 2005). However, the resulting rigidity may lead to actions being implemented which fail to deliver (reach their potential) as they may not be adaptable to suit local land use, terrain, soil or hydrology. On a larger scale, catch-ment carrying capacities have been proposed (Doody et al., 2016) as a means to identify pressure thresholds beyond which water quality is likely to be impacted. The implication is that, inside of these pressure thresholds, opportunities for supporting activities (that cause pres-sures) exist but which the catchment can absorb. This approach requires practical, adaptive tools to bridge the gap between general measures and specific targeted actions, designed for maximum effect, atfield and farm-scale.
Soil with high residual soil P concentrations, particularly beyond those levels required for optimum agronomic production, has been identified as a water quality pressure in areas with intensive agriculture (Jarvie et al., 2013;Sharpley et al., 2013). As a policy instrument, the threshold to agronomic production is used as the upper limit of accept-able soil P fertility with an implication that fertility above this threshold is both of little agronomic utility and poses an increasing environmental risk. Maintaining soil P fertility at or below this upper limit assumes that the water quality risk is reduced (but not entirely removed) and that the needs of good agronomic production are maintained (Macintosh et al., 2019).
Moreover, the principle of critical source areas (CSAs) recognises that the source pressure (i.e. residual and high soil P fertility) requires a mobilisation process to transfer P to watercourses and become a eu-trophication impact. In the case of soil P (and sediment), hydrologically sensitive areas (HSAs) have been proposed as zones more prone to sur-face runoff during storm events (Thomas et al., 2016a) and act to trans-fer P more readily and particularly when these HSAs are coincident with
soils of high soil P fertility (Thomas et al., 2016b). Atfield scale, micro-topography can influence the generation and impedance of surface run-off and this can be spatially modelled using LiDAR digital elevation data and soil topographic indices (Thomas et al., 2017, based onBeven and Kirkby, 1979).
Scale needs to be considered in identifyingfield and farm-scale envi-ronmental risks and opportunities for soil P fertility (and other condi-tions) (Wall et al., 2012) and in identifying catchment carrying capacities when water quality is also a factor. With the latter, water body chemical and biological thresholds are used to determine bound-aries between what is and is not acceptable which, for chemistry, can in-clude single standard concentrations or moreflexible standards based on ambient conditions (Tappin et al., 2018;UKTAG, 2013). More often, for nutrients, these standards in rivers are based on the relationship be-tween time-averaged nutrient concentrations and biological metrics (Bouleau and Pont, 2015). However, setting one-size-fits-all constraints atfield and farm scale for pressures, including P, does not necessarily align with the thresholds set for water bodies where quality is an inte-grated effect from catchment hinterlands. Resolution of risks, opportu-nities and catchment carrying capacities across the different scales has clear utility for all actors concerned with balancing production and en-vironmental quality needs in agricultural landscapes, from farmers to policy makers.
The aim of this study was to provide a transferable framework for
field to catchment scale risks and opportunities based on soil fertility and HSA status. The objectives were to:
1. Assess the distribution of soil P concentration and HSA risk in river catchments.
2. Assess soil P carrying capacity at the catchment scale relating to water quality.
3. Determine the opportunities for redistributing soil P risk within farms and river sub-catchments.
2. Methods 2.1. Study area
This study was undertaken in the Upper Bann river catchment draining an area of 220 km2in the Neagh-Bann International River
Basin District in Northern Ireland (NI) (Fig. 1). The headwaters rise in the Mourne Mountains, andflow north to the catchment outlet (for this study) near the town of Banbridge. The Upper Bann continues to Lough Neagh (surface area 392 km2- the largest freshwater lake in
the UK and Ireland) as one of six inflowing rivers.
The Upper Bann catchment is underlain by meta-sedimentary and igneous bedrock units; from granites in the headwaters into shale and sandstone greywacke and granodiorite units in the lowlands. Soils are clay-rich glacial tills derived from the underlying parent material and deposited as drumlins and ribbed moraines at the end of the last Glacial Maximum 14–15 ka BP (McCabe et al., 2005). This resulted in an undu-lating topography of steeply sloping hills and ridges of slowly perme-able soil, with flat inter-drumlin areas where peats formed and natural drainage is poor (Cruickshank, 1997). Annual mean rainfall, over the period 1981–2010, is 600–800 mm in the lowlands and 800–1200 mm in the uplands (UKMO, 2018).
Land use in the catchment is dominated by grass-based agriculture (95% grassland) with dairy (13% of the area), beef (26%), sheep (18%) and mixed livestock (32%) enterprises accounting for the majority of farm holdings. Arable crops are grown primarily as feed on mixed enter-prises (8%), withb3% of holdings exclusively arable. Farm holdings within the catchment are generally smaller than the NI mean of 41 ha, and these have a meanfield size of 0.94 ha (IQR of 0.53–1.57 ha). Enter-prises range from larger, intensive (generally dairy) farms with high stocking densities that require a derogation to operate at a higher rate of nutrient application than the default 170 kg N ha−1yr−1, to
exten-sively managed small farms with low stock numbers. 278 R. Cassidy et al. / Science of the Total Environment 687 (2019) 277–286
A good-moderate soluble reactive P (SRP) chemical water quality boundary (to support biological data) has been defined for the Upper Bann as 48μg L−1, a site specific class boundary value for
good-moderate water status at the Upper Bann outlet based on alkalinity and altitude The range of good-moderate class boundary values for Water Framework Directive (WFD) waterbodies within the Upper Bann is 28–55μg L−1and the median is 48μg L−1.
2.2. Soil tests, HSA mapping and water quality
The majority of livestock farms in NI do not routinely test soil fertility and only do so as part of Nitrates Directive derogation requirements at higher stocking densities. This lack of soil testing has been highlighted as a major impediment to agricultural development within NI (Expert Working Group on Sustainable Land Management, 2016). Accordingly, as part of an EU sponsored scheme extended to livestock farmers in 2017–2018 (EU REF Commission Delegated Regulation (EU) 2016/ 1613;European Commission, 2016) soils within water quality monitor-ing sub-catchments were tested on afield-by-field basis for soil fertility and lime requirements. On 513 farms operating within 11 sub-catchments of the Upper Bann 7772fields soils were sampled between November 2017 and February 2018. Soils in a further 718fields on 18 farms in two additional sub-catchments (B3 and B5), were sampled as part of a linked project earlier in 2017 and were appended to the data set to extend coverage. A total of 7693fields lie exclusively within the 13 sub-catchment boundaries.
In eachfield, 40 representative soil sub-samples were collected using a 15 mm inner diameter, open-sided agronomic soil sampler and following the standard“W”pattern to maximise coverage across thefield extent. Plug cores were taken to a depth of 7.5 cm, avoiding any disturbed ground or animal manure, and composited into one sam-ple in a sealed, labelled bag with a unique identification. GPS tracks of all sampling paths were recorded and used to cross-check and verify the
samples. Soil samples were air-dried at 30 °C and ground and passed through a 2 mm sieve prior to analysis.
For each 10 mL soil sample, Olsen P (the agronomic soil P test in NI) was determined on a 1:20 soil to 0.5 M sodium bicarbonate solution ratio at pH 8.5 (Olsen et al., 1954) shaken in an orbital incubator at 180 rpm at 20 °C for 1 h. The concentration of P in thefiltered extract (8μm, Whatman No. 40, 11 cm) was determined colorimetrically (at 880 nm) using a Skalar San auto-analyser followingMurphy and Riley (1962)and expressed on a soil volumetric basis (mg P L−1). Each
batch of 50 processed samples contained a quality control (QC) soil sample in positions 1, 25 and 50. Calibration standards and QC check standards were read in each batch and analysis repeated if any of the QC checks failed. Each soil sample P concentration was then assigned its corresponding agronomic Olsen P Index (0–9) using RB209 (DEFRA, 2010), the UK standard for soil fertility recommendations and advice (Table 1).
HSA risk maps were also generated using LiDAR data to indicate areas at risk of contaminant mobilisation and transport in surface runoff pathways atfield scale. A LiDAR survey of the Upper Bann catchment Fig. 1.Locations of the Upper Bann catchment and sub-catchments (B1–B13) in which soil sampling, risk mapping and water quality monitoring were undertaken.
Table 1
Soil test P indices used in Northern Ireland. Soil test P
index
Olsen extractable phosphorus (P) (mg P L−1) 0 0–9 1 10–15 2− 16–20 2 21–25 Agronomic optimum 3 26–45 4 46–70 5 71–100 6 101–140 7 141–200
was commissioned in 2015 with data capture at a bare-earth resolution of 4–10 points m−2. The raw LiDAR point cloud was converted to a 2 m
raster Digital Elevation Model (DEM) to optimise surface and subsurface
flow routing and account for micro-topography (Thomas et al., 2017). The river, stream and open ditch drainage networks were manually digitised, using the LiDAR DTM and ortho-imagery as a guide, and burned into the DEM by a user-defined depth of 100 m within SAGA GIS (Conrad et al., 2015) to hydrologically correct it. Flow sinks were
filled using the XXL method ofWang and Liu (2006), which is a more computationally efficient algorithm for high resolution LiDAR datasets. Flow direction and flow accumulation (Deterministic Infinity,
Tarboton, 1997), slope (Zevenbergen and Thorne, 1987) and topo-graphic wetness index (TWI;Beven and Kirkby, 1979) rasters were then calculated using SAGA GIS (Conrad et al., 2015). To account for var-iations in soil hydraulic properties the TWI was developed into a Soil To-pographic Index (STI) using the mean saturated hydraulic conductivity in the soil profile and soil depth for each soil series (1:50,000 General Soil Map of Northern Ireland,AFBI, 2009) in the catchment using histor-ical data and expert judgement where required. This method and workflow are described in detail inThomas et al. (2016a). In summary, each 2 m pixel was assigned an STI value:
STI¼ tanaβ−KsatD ð1Þ
whereais the cumulative upslope contributing area per unit contour length (m),tan ßis local slope (radians),Ksatis the mean saturated
hy-draulic conductivity (horizon depth weighted, m day−1) andDis the
total soil depth (m) (Walter et al., 2002). Higher STI values are reflective of higher accumulatedfield runoff potential.
In the 13 sub-catchments' outlets, water samples were collected on a fortnightly basis by manual grab sampling. Polythene sample bottles (2 L volume) were kept chilled during transit and returned directly to the laboratory once the sampling round was complete. Followingfi ltra-tion (0.45μm), samples were analysed in batches for SRP on a Thermo Scientific Aquakem using the standard colorimetric method ofMurphy and Riley (1962). Calibration was undertaken at least daily and re-run if thefit of the calibration line was r2b0.9950 and absorbance values
wereN0.520 nm for a standard solution of 1000μg L−1SRP. QC standards
were run in each batch of samples analysed. Data were used for one hy-drological year (October 2016–September 2017) leading up to the pe-riod of soil sampling. This water sampling protocol follows an established and long-term programme for the Upper Bann and other Northern Irish catchments based on fortnightly sampling described by
Foy and Kirk (1995)andBarry and Foy (2016). The Upper Bann water quality dataset was, therefore, compared with the annual hydrograph to place SRP concentration data into context with the hydrological con-ditions of the sampled river water. This hydrograph was from a Rivers Agency hydrometric station at the approximate centre of the catchment (shown onFig. 1) which records stage height and converts to discharge atfive minute intervals. For each of the 13 sub-catchments the propor-tion of the sampled sub-catchment area exceeding the agronomic opti-mum soil test P was calculated and compared to the annual median SRP concentration at each outlet calculated using the fortnightly SRP data using least-squares regression. This temporal resolution is justified as the analysis was based on ambient river SRP concentrations as indica-tors of ecological status, and not annual loads where the inclusion of storm event data would be more important.
2.3. Data analysis
All data collected for this study are strictly protected to ensure farmer anonymity and so spatial data are not available for publication. However, distributions of soil P indices and HSA risks were extracted for comparison and collated at thefield, farm and sub-catchment scale followingWall et al. (2012).
Phosphorus was demarcated at the upper limit of the optimum Olsen P Index 2 (16–25 mg L−1) where higher concentrations
(≥26 mg L−1) are considered residual to agronomic optimum
perfor-mance and an environmental risk.
To delineate HSAs using the STI,Thomas et al. (2016a)estimated the total runoff generating area (HSA size) during storm events in inten-sively monitored agricultural catchments in Ireland based on the vol-ume of direct runoff from discharge hydrographs (m3) divided by
rainfall (m). They then selected the catchment areas with the highest STI values until the area selected was the same as that empirically esti-mated (using catchment STI value distributions and their cumulative catchment area to define a threshold STI value above which is a runoff-generating-HSA). In this study, similar hydrometeorological data were not available at sub-catchment level and so risk was based on ranked percentiles where the top 25% of STI values were determined as high risk HSAs and the top 10% as very high risk HSAs. This decision was based on expert judgement (using the HOST (Hydrology of Soil Types) classification of gleyed soils across the Upper Bann catchment;
Cruickshank (1997)) andfield observations of overlandflow during storm events.
Fields were classified based on visual inspection of detailed ortho-imagery to identify grasslandfields withb50% rye grass cover, or where rush or scrub growth was present, typical of rough or lower in-tensity grazing practices. These low inin-tensity areas were omitted from an analysis that identified theoretical opportunities for increasing soil P concentrations, due to higher overall inherent risk to water quality and lower economic potential for recovering nutrients in grass (i.e. poorly drained).
Fields, and sub-field areas, providing a theoretical opportunity for P amendments were identified at farm scale, where the full holding irre-spective of the catchment boundaries was considered, and at sub-catchment scale, where holdings were clipped to the sub-sub-catchment boundary. Areas of opportunity were identified based on four criteria which each needed to be met: (1) afield soil test P below the agronomic optimum (2) the avoidance of high risk HSA by at least a 5 m buffer (adopting current regulations for spreading near waterbodies) (3) cur-rent land use not classed as low intensity and (4) the area being a com-pact block of notb0.2 ha. The latter criterion is based on the minimum area which would be practical for the application of cattle slurry or farmyard manure, using a standard tractor and spreader configuration (33.5 m3ha−1= a 1500 gal slurry tanker spread on a half-acre). From
a subset offields meeting criteria (1) to (3) the remaining area of each
field was polygonised and quantified to exclude thoseb0.2 ha. To limit the set to those polygons with a regular, blocky shape suitable for appli-cation the ratio of polygon area to perimeter was used to exclude poly-gons with a ratio ofb0.4.
3. Results
3.1. Distribution of soil P concentration and HSA risk
Soil test P varied among and within farms, and across the sub-catchments. The arithmetic mean of soil test P across allfields was 26.9 mg P L−1(Index 3), just in excess of the agronomic optimum de-fined as Index 2 (21–26 mg L−1Olsen P) (Table 1). Within the entire
sample set (n = 7693) 41% offields exceeded the agronomic optimum, with a majority of those (28.9%) at Index 3 (Fig. 2a). A larger proportion (45.7%) was below the agronomic optimum (b21 mg L−1Olsen P), with 9.9% offields at Index 0. A majority of farms exhibited an imbalance in soil fertility acrossfields; with a tendency to have high soil P in large
fields close to the farm compared with those at the extremity of the holding.
The mean proportion of the area of allfields on individual farm hold-ings (n = 531) exceeding the agronomic optimum soil test P was 36.8%, while the proportion offield area also classed as high HSA risk was 7.4%. Fifty-five holdings recordedN95% of their area above the agronomic 280 R. Cassidy et al. / Science of the Total Environment 687 (2019) 277–286
optimum and, within those, the proportion of the holding with a high HSA risk ranged from 1% to 59% with a mean of 19.7%.
Across farm types, covering a range in intensity from sheep to dairy and‘mixed livestock and arable’farms, the proportion of farm area above the agronomic optimum varied. Within the 142 beef farms sam-pled, a mean of 40% of holdings were above the agronomic optimum; for the 70 dairy farms this was 49% and for 95 sheep farms 23%. The mean proportions of farmed areas above the agronomic optimum and classed as high HSA risk in these groups were 7.5%, 9.6% and 4.5%, respectively. Of 177 farms defined as mixed livestock (any combination of beef or sheep) the mean area of holdings above the agronomic optimum was 34% and for 44 enterprises defined as‘mixed livestock and arable’this was 48%. The mean farm area proportions above the agronomic opti-mum and classed as high HSA risk in these groups were 6.9% and 12.2% respectively. Only one fully arable enterprise was included in the sample set with 73% of its area above Index 2 and 22.3% of the area also at high HSA risk.
For each sub-catchment the proportion of each area above, below and at the agronomic optimum was calculated based only onfields within the sub-catchment boundary (Fig. 2b andTable 2). The propor-tion of high (25th percentile) HSA risk within each category was also
calculated (Table 2), withfield HSA risk area recalculated in any cases wherefields were clipped at the sub-catchment boundary.
The least intensively farmed sub-catchments (B13 and B12) in the south of the catchment have 0.1% and 6.9% of area above optimum, with the majority (99% and 87%, respectively) below optimum. This
re-flects the upland character of the sub-catchments, with large areas ex-tensively farmed and mainly grazed by sheep. The proportion of these sub-catchments at high HSA risk and above the agronomic optimum is low; 0.03% in B13 and 0.9% of B12.
In all other sub-catchments between 32.8% and 66.4% of the area is above the agronomic optimum, with the proportion at high HSA risk and above optimum ranging from 4.3% to 22.9%. Three sub-catchments, B3, B4 and B9 haveN50% of coverage exceeding the agro-nomic optimum (66.4%, 51.8% and 61.6%, respectively). Within each, the areas above the agronomic optimum and classified as at high HSA risk ranged from 11.4% in B9 to 22.9% in B3. Other sub-catchments ranged between 32.8%–44.2% of sub-catchment area above optimum and 4.25–11.4% also coinciding with high HSA risk.
Fig. 2.(a) Olsen P distributions by index forfields sampled within the sub-catchments (n = 7693). Numbers above, below and at optimum soil test P are indicated. (b) Distributions of soil Olsen P status across thefields sampled in 13 sub-catchments (B1–B13 inFig. 1).
Table 2
Summary calculations of areas of risk and opportunity within catchments. The relationship of each sub-category (columns B–H) is as follows: (i) B D E = ~100% (may differ slightly due to rounding); C is a sub-set of B; F is a sub-set of E; G is a sub-set of F; H is a sub-set of G.
Sub-catchment A B C D E F G H
Total catchment area, km2
AreaN optimum, %
AreaNoptimum & HSA, %
Area optimum, %
Areab optimum, %
Areaboptimum and not extensive, %
Areaboptimum & not extensive & not HSA, %
Opportunity, % B1 4.52 43.1 11.0 18.8 38.0 37.7 26.8 6.2 B2 14.40 44.2 11.4 16.6 39.2 36.7 24.2 3.8 B3 3.80 66.4 22.9 16.9 16.7 16.7 10.5 1.3 B4 20.01 51.8 17.0 20.9 27.3 26.0 16.8 2.7 B5 4.08 38.3 8.3 18.4 43.3 37.9 28.6 5.3 B6 8.80 39.5 10.3 17.8 42.7 39.1 27.8 5.5 B7 4.10 42.8 4.7 11.7 45.5 27.8 25.2 13.7 B8 42.72 38.0 4.3 14.2 47.8 30.2 27.4 13.8 B9 6.95 61.6 11.4 11.4 27.0 26.8 22.4 6.8 B10 8.36 32.8 6.2 16.5 50.8 46.3 33.0 7.7 B11 7.07 35.8 5.8 11.3 52.8 47.7 36.6 9.7 B12 10.93 6.9 0.9 6.4 86.7 42.8 36.6 9.8 B13 14.93 0.1 0.0 0.4 99.5 3.4 2.9 0.4
3.2. Soil P carrying capacity at the catchment scale relating to water quality Water quality data (n = 27 samples per site) for the hydrological year prior to soil sampling were used (October 2016–17). Annual me-dian SRP concentrations across the 13 sub-catchments ranged between 8.5 and 145.5μg L−1, with strong seasonal variation. Lowest
concentra-tions were measured in sub-catchment B13 (IQR 5.5–17.5μg L−1;
min-max range 1–48μg L−1) and highest concentrations in sub-catchment
B1 (IQR 99.25–253.3μg L−1; min-max range 57–1392μg L−1). Increased storm events in autumn and winter are when HSAs and multiple trans-port pathways are most active, including diffuse overlandflow path-ways. Notable, from the start of April onward, as the catchment begins to dry, is a pattern of increasing concentrations in all sub-catchments, to a peak in August, following whichflows (and dilution) increase (Fig. 3).
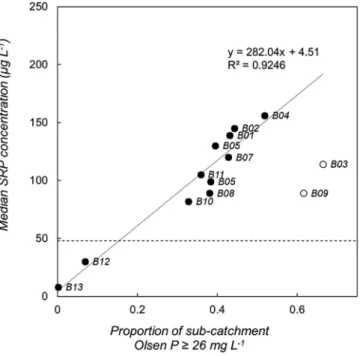
Analyses of the soil and water quality data sets examined the distri-bution of soil P concentration and HSA risk in the river sub-catchments relative to water quality. For each of the 13 sub-catchments the propor-tion of the sampled sub-catchment area exceeding the agronomic opti-mum soil test P was calculated and compared to the median SRP concentration at each outlet (Fig. 4).
Based on a linearfit to the data (r2= 0.93), and the intersection of the bestfit line with the river SRP good-moderate class boundary con-centration line (48μg L−1), the model indicates that to reach this
bound-ary noN15% of sub-catchment land area should exceed the agronomic optimum soil test P. Only two of the 13 sub-catchments meet this re-quirement, B12 and B13 in the upland headwaters, with the rest having 30–55% of the sub-catchment area above the agronomic optimum. Two outliers are notable (identified using two iterations of the Cook's Dis-tance algorithm atPb0.05;Mellander et al., 2018), with lower median annual SRP concentrations. These sub-catchments differ from the other streams as they are characterised by heavily channelised stream net-works with deep and extensive deposits of sediment. It is assumed that retention of P in sediments in these streams reduces lowerflow concentrations, with P subsequently lost during large winter storm events that are not captured by fortnightly sampling.
A further analysis integrated the HSA risk with thefield soil test P to establish, for each sub-catchment, the relationship to median annual SRP concentrations (Fig. 5). A power-lawfit was the best model for the data (r2= 0.97, possibly indicating scale-invariant influences of
micro-topography), and the intersection of the bestfit line with the SRP good-moderate class boundary concentration line (48μg L−1). This
indicates a carrying capacity of 1.5% of the sub-catchment area in this
highest risk category to avoid exceedance of the median annual 48 μg SRP L−1river concentration. Effectively, when uncertainties are
con-sidered, this precludes any coincidence of soil test P above the agro-nomic optimum and high HSA risk areas if water quality targets are to be met using river SRP concentration as the indicator.
3.3. Opportunities for soil P risk redistribution
Across farms the area of land below the agronomic optimum soil test P that has potential to receive nutrients, and provide buffering to avoid exceedance elsewhere, varied considerably. Potential for redistribution by farm size and sub-catchment are shown inTable 3and Table SI-1, with breakdowns by the area of sampled farm holdings summarised.
Fig. 3.Concentration time series for 13 sub-catchments of the Upper Bann catchment. Box-whiskers indicate the median and interquartile range (IQR) for SRP concentrations at fortnightly sampling intervals relative to daily discharge at the mid-catchment hydrometric station (upstream catchment = 107.2 km2
). Vertical arrows indicate theflow conditions at the time when SRP grab samples were taken.
Fig. 4.Relationship between the median annual SRP concentration at the outlet and the proportion of each sub-catchment in excess of the agronomic optimum (26 mg L−1 Olsen P). Open symbols are outliers to the linear trendline, identified using Cook's Distance and omitted from the model. The dashed horizontal line indicates the site specific class boundary SRP concentration used to differentiate between moderate and good ecological status classification.
In the intensively farmed sub-catchments (B3 and B4) only 43.8 and 49.3% of farms had any capacity to potentially redistribute nutrients on-farm. Of those the mean area available was 1.44 and 1.71 ha, respec-tively, though with substantial variability among farms. By contrast farms in sub-catchments B7, B8, B12 and B13 all had capacity on over 70% of farms, with B7 and B8 having the greatest areas available on-farm, with a mean of 6.86 and 4.09 ha per farm. Smaller holdings have a larger % area of opportunity on-farm compared to larger farms, reflecting the lower likelihood of those farms to be intensively farmed. Within sub-catchments the total area of opportunity for receiving excess nutrient surpluses from elsewhere was estimated based only on the area farmed within the sub-catchment boundaries. Although the proportion of sub-catchment areas at below optimum soil test P and at a lower HSA risk ranged between 2.9% (B13) and 36.6% (B11, B12), when the criteria for identifying blocks of land suitable for nutri-ent application are applied, only between 0.4% (B13) and 13.8% (B8) of the sub-catchment areas were estimated to be available. Sub-catchments with the lowest area of opportunity were B3 (1.3%), B4 (2.7%) and B13 (0.4%), the two former being particularly intensively
farmed while the latter reflects the exclusion offields currently farmed at a low intensity and which, due to higher overall inherent risk to water quality and lower economic potential for recovering nutrients in grass (i.e. poorly drained), should not receive further P fertiliser applications.
4. Discussion
Practically, the framework developed in this study provides an ob-jective, physically based mechanism for identification of areas posing greatest risk to river water quality from diffuse pollution and prioritisation of mitigation measures. It is also a basis for the develop-ment of feasible solutions at farm and sub-catchdevelop-ment scale based on
field scale soil P and hydrological sensitivity data (seeFig. 6for an illus-trative example), or the development of alternatives.
For this exemplar surface water dominated catchment, comparisons with water quality monitoring data indicate that, to attain good chemi-cal water quality for SRP, a target ofb15% of sub-catchment area above the agronomic optimum should be set. In addition, a target ofb1.5% of sub-catchment area above the agronomic optimum and with high HSA risk should be set. Two sub-catchments appeared as outliers to these models, related to heavy sedimentation, and a means to charac-terise similar channels in an automated way will be required in develop-ments of the framework when applied elsewhere.
Nevertheless, achieving core targets in the Upper Bann sub-catchments will require varied and possibly concurrent approaches based on options such as:
1. Redistribution of P within the farm to areas of opportunity Within farm redistribution (e.g.Ruane et al., 2014) avoids any con-cerns regarding biosecurity and transfer of pathogens between farms, maintains farmer autonomy over applications and minimises transport distances, but will depend on the area available relative to on-farm P loading and overall soil status and may require additional storage if ac-cess to the targetfields is limited by trafficability. Within the sub-catchments on-farm opportunity ranges from a mean of 6% in B3 to 20% in B8. Many holdings have no on-farm capacity for nutrient re-distribution (from 17% of farms in B1 to 56% of farms in B3) which limits their options to reducing stocking rates or moving nutrients off-farm.
2. Redistribution of P among farms in the same sub-catchment
This option is feasible where a less intensive farm (e.g. sheep enter-prise) is willing to accept nutrients, either to offset chemical fertiliser costs or as an incentivised traded arrangement (e.g.Cox et al., 2013). This depends on the availability of opportunity areas within the sub-catchment and on the existence of a simple, formalised arrangement to allow exchange. For each trading opportunity, maps of the total avail-able area will be needed, the appropriate loading of slurry or manure calculated and farm nutrient budgets for both farms calculated. Most probably this would be facilitated as an online tool for farmers and farm advisors. The formalisation of transfers will be challenging, costs of transport will increase and additional issues around biosecurity may be off-putting for many farmers. However, where farms are nearby it is more likely that there will be social interactions and a level of trust. Redistribution of manure nutrients among farms, although not re-stricted by regulation (Article 21 of Regulation (EC) 1069/2009), is of concern to farmers due to the prevalence of tuberculosis in NI. Where poultry litter is concerned there are also concerns over the airborne spread of botulism (Souillard et al., 2017). Approaches to eliminate biosecurity risk will be necessary to encourage farmers to receive or-ganic nutrients from other farmers.
3. Redistribution of P among sub-catchments Fig. 5.Relationship between the median annual SRP concentration at the outlet and the
proportion of each sub-catchment in excess of the agronomic optimum (26 mg L−1 Olsen P) with a high (25th percentile) HSA risk. Open symbols are outliers to the power-law trendline identified using Cook's Distance. The dashed horizontal line indicates the site specific class boundary SRP concentration used to differentiate between moderate and good ecological status classification.
Table 3
Summary of on-farm opportunity for P redistribution by sub-catchment. Detail of break-down by farm size is given in Table SI-1.
No. of holdings
No. of holdings with opportunity Mean area available, ha Mean area available, % B1 12 10 2.65 14.1 B2 51 28 1.51 7.3 B3 16 7 1.44 6.0 B4 73 36 1.71 8.5 B5 22 15 2.47 10.2 B6 39 26 2.05 10.0 B7 24 18 6.86 19.4 B8 139 108 4.09 20.1 B9 29 16 3.54 13.6 B10 58 36 1.97 12.7 B11 36 22 2.22 17.2 B12 43 35 2.31 10.7 B13 10 7 3.22 9.0
This option is similar to (2) but made more complex by greater transport distances and the lower likelihood of neighbourly interactions with the receptor farm, which precludes informal negotiations and limits trust regarding issues such as biosecurity. The development of an online marketplace or sub-catchment and farm advisor led negotia-tions to trade nutrients will be more important in these cases. This will also require the incorporation of more checks and balances to pro-vide assurance to the receptor farms. In the Upper Bann the distances to transport nutrients from a low opportunity sub-catchment such as B3 to a high opportunity sub-catchment such as B6 are ~12–20 km, which, de-pending on the load capacity of the vehicles used for transport, may be practical.
The distance slurry or manure must be transported becomes a con-sideration once it exceeds the normal operational boundary of the farm. Some farms may not have vehicles suited to long distances on paved roads so contractors may have to be employed, adding cost. All these factors need to be incorporated into the cost-benefit in terms of yield. Figures for NI are not available; however, a study in the Republic of Ireland byFealy and Schröder (2008)indicated that manure trans-port from livestock farms to arable farms becomes of limited benefit economically beyond 50–75 km when using trucks and much less than that for tractors. For long distance transport a solution such as slurry separation, adopted in the Netherlands (Schoumans et al., 2014), which would allow the lighter dry matter content to be transported at lower cost and the residual liquid, with lower P and higher weight applied locally. The costs of such a system would make this feasible only for the largest, high intensity, farm enterprises or cooperatives.
However, there are limits to the area available for HSA related P re-distribution, and transfer of nutrients between sub-catchments alone is not likely to reduce surpluses sufficiently. For example, in sub-catchments B3 and B4 the proportions of the area in exceedance and with high HSA risk are 17.0% and 22.9% (Table 2), respectively. When nutrients are redistributed to areas of opportunity within these catch-ments (1.3 and 2.7% of the area, respectively), there still remains an ad-ditional 15.7% and 20.2% of the sub-catchment area, where nutrient amendments must cease in order to draw down soil P and which
require an external surrogate area for redistribution of those nutrients (an area of 0.6 and 4.0 km2, respectively). Of sub-catchments having
ad-ditional capacity (B7, B8, B11, B12, B13) a total area of 8.27 km2could be
available for imports from outside those sub-catchments. Further con-siderations could be:
4. Soil P drawdown and reduced farm P balance
Nutrient redistribution alone will not be enough to achieve a target ofb15% of the sub-catchment area above optimum soil test P in the study sub-catchments currently at moderate WFD status for SRP river concentration. For sub-catchment B3, for example, soil test P will have to be reduced infields covering 51% of the sub-catchment, 47% of B9 and 36% of B4. Eliminating high P soils in high risk HSAs for these sub-catchments will affect 22.9, 17.0 and 11.4% of their areas, respectively. It is not likely that these targets can be met through sustaining current practices or redistribution either within or among sub-catchments.
In thefirst instance a priority must be to cease P build up through redressing on-farm balances (e.g.Schulte et al., 2010), which in NI are high (N10 kg P ha−1), and driven by imports of high P concentrate feed
and chemical fertilisers. This impacts farm profitability (42% of farm in-come is spent on feedstuffs in NI relative to 22% in the UK as a whole,
DAERA, 2018b) and drives pollution through a broken cycle of excess P lost to soil and water (Elser and Bennett, 2011). More widely, closing the gap in the P cycle is essential to protecting food security in a volatile global market. Better on-farm utilisation of nutrients and pH correction (liming) (Fertiliser Association of Ireland, 2016) will be an important step towards improving grassland dry matter production and drawing down existing soil P. Increased silage offtakes and rotations of other crops can be used to amplify this effect (e.g.Wall et al., 2013).
5. Targeted interception measures
In some cases it may not be feasible for a farm to reduce or export nutrients to lower soil P in all HSA risk areas. In such cases mitigation Fig. 6.Schematic of the assessment framework applied atfield, farm and sub-catchment scales to identify risk (high soil P and high HSA), opportunities (low soil P and no HSA) and management targets for nutrients relative to water quality. Note that thefield schematic and farm scale pie chart summaries are illustrative examples (due to farm data confidentiality) but the sub-catchment summary is based on actual data for B2.
measures to intercept and block nutrient transfer in-stream becomes an option. Diverse approaches, such as riparian buffers, sediment traps and barriers exist, and have been trialled in many studies (e.g.Adams et al., 2018;Collins et al., 2007;Cooper et al., 2017;Darch et al., 2015;Dorioz, 2013;Dupas et al., 2015). With interception of runoff prior to entering the river system, measures ideally should involve the removal of the nu-trient either using a fast growing harvestable crop (for feed or fuel) or a technological solution such as P sorption media which could be ex-tracted and potentially re-enter the P market. Key elements of using such measures, however are that the measure used is appropriate, is optimised to the landscape and land use, and is maintained. A challenge within any environmental scheme incentivising their use through pay-ment is to allowflexibility to suit the landscape and characteristics of HSA risk areas. For auditing purposes most schemes are very prescrip-tive in terms of the dimensions and construction of any measures.
Options 1 to 4, above, consider the need for smart incentives for P use optimisation at thefield, farm and sub-catchment level and this is important as P as a mineral fertiliser becomes more of a national and in-ternational resource issue for food security (e.g.Scholz et al., 2013). Translation of targets defined using the framework described in this study into operational plans on farms and within sub-catchments is the next stage and will require a concentrated and coordinated effort among all the stakeholder groups involved, including both advice and scheme development. This is recognised as a challenging next stage as the data required from farmers for options such as P redistribution and P drawdown in soils requires collection and organisation. The de-velopment of decision support tools, to include both maps and graphical presentation of soil agronomic status, risk and opportunity for redistri-bution (following a format based on that inFig. 6) will be an intrinsic component of the communication process among stakeholders and in implementing the framework. Ongoing decision support tool develop-ment within the Departdevelop-ment of Agriculture in NI is making provision for maps such as those generated in this study to be integrated in farm level nutrient management tools (initially for on-farm use).
It is possible that in large catchments like the Upper Bann, with little carrying capacity and a landscape (soil and topography) which is prone to runoff, that, as a sixth option, greater restrictions on stocking rates and farming intensity may be the only option (or at least compensated for) if water quality pressures linked to high soil P and HSA risks are to be mitigated. Proposed changes to the way in which EU agricultural sub-sidies are directed, away from a focus on production to the provision of environmental and other public goods (Bateman and Balmford, 2018) will be important in achieving this. Or else, as a seventh option, a less stringent water quality threshold is set for a no net deterioration target if sub-catchment production targets and economies are to be main-tained (or increased). The catchment level assessment applied as part of this framework could feed into the development of a land use choices matrix integrating environmental, social, economic and cultural con-cerns, for use in other national or international river catchments, and as advocated in the Land Use Suitability concept ofMcDowell et al. (2018).
Afinal consideration acting on all of these options will be internal catchment biogeochemical processes related to P legacies in soils and sediments that will prolong the influence of land-water P transfers. This has been reported in Ireland (Schulte et al., 2010) and elsewhere (Sharpley et al., 2013) and adds to the challenge of expectation from in-vestments in catchment P mitigation goals.
5. Conclusions
In a framework for assessing soil P risks, when compared with a tar-get SRP river concentration threshold of 48μg L−1in a wider catchment,
this study indicated that the carrying capacity for above agronomic op-timum soil P was 15% of the individual sub-catchments' area. The study also indicated that the catchments could carry almost no HSAs with above agronomic optimum soil P (b1.5%).
The framework also indicated soil P opportunities for redistributing these risks, adaptively and concurrently across scales fromfield, to hold-ing to sub-catchment possibly as part of developed advice provision and new schemes, in integrated nutrient management planning or trading. The framework recognises both P source and transport risk as part of this redistribution potential with the necessity for soil P drawdown/re-ducing P balances considered alongside targeted HSA interception at
field scale, identified using high resolution LiDAR DEM elevation data. In catchments at high risk of P transfers to surface waters, similar to the one investigated here, less intensive agriculture to meet the water quality thresholds, or less ambitious thresholds to support sub-catchment economies would be the last two options to consider if P risk redistribution opportunities were not considered or did not provide the desired end-points.
Supplementary data to this article can be found online athttps://doi. org/10.1016/j.scitotenv.2019.05.453.
Acknowledgements
This work was undertaken as a component of the“EU EAA Soil Sam-pling and Analysis Scheme”, funded by the Department of Agriculture, Environment and Rural Affairs (DAERA), Northern Ireland, under the European Union Exceptional Adjustment Aid Scheme. We thank catch-ment farmers for land access and participation. We acknowledge the contributions of AFBI scientific staff who were instrumental in the plan-ning, acquisition and processing of data, Colleen Ward (AFBI Project Manager) and Peter Scott (DAERA lead). Finally we thank both anony-mous reviewers for insightful comments and suggestions on the manuscript.
References
Adams, R., Quinn, P., Barber, N., Reaney, S., 2018.The role of attenuation and land man-agement in small catchments to remove sediment and phosphorus: a modelling study of mitigation options and impacts. Water 10, 1227.
AFBI. General soil map of northern Ireland1:50,000 In: AFBI, editor. Agri-Food and Biosci-ences Institute, 2009, pp. Northern Ireland Soil Survey.
Barry, C.D., Foy, R.H., 2016.Assessing the success of regional measures for lowering agri-cultural nutrient pollution in headwater streams. J. Environ. Qual. 45, 1329–1343. Batáry, P., Dicks, L.V., Kleijn, D., Sutherland, W.J., 2015.The role of agri-environment
schemes in conservation and environmental management. Conserv. Biol. 29, 1006–1016.
Bateman, I.J., Balmford, B., 2018.Public funding for public goods: a post-Brexit perspective on principles for agricultural policy. Land Use Policy 79, 293–300.
Beven, K.J., Kirkby, M.J., 1979.A physically based, variable contributing area model of basin hydrology. Hydrol. Sci. J. 24, 43–69.
Bouleau, G., Pont, D., 2015.Did you say reference conditions? Ecological and socio-economic perspectives on the European Water Framework Directive. Environ. Sci. Pol. 47, 32–41.
Collins, R., McLeod, M., Hedley, M., Donnison, A., Close, M., Hanly, J., et al., 2007.Best man-agement practices to mitigate faecal contamination by livestock of New Zealand wa-ters. N. Z. J. Agric. Res. 50, 267–278.
Conrad, O., Bechtel, B., Bock, M., Dietrich, H., Fischer, E., Gerlitz, L., et al., 2015.System for Automated Geoscientific Analyses (SAGA) v. 2.1.4. Geosci. Model Dev. 8. Copernicus Publications.
Cooper, R.J., Hama-Aziz, Z., Hiscock, K.M., Lovett, A.A., Dugdale, S.J., Sünnenberg, G., et al., 2017.Assessing the farm-scale impacts of cover crops and non-inversion tillage re-gimes on nutrient losses from an arable catchment. Agric. Ecosyst. Environ. 237, 181–193.
Council of the European Union, 1991.Council Directive 91/676/EEC of 12 December 1991 Concerning the Protection of Waters Against Pollution Caused by Nitrates From Agri-cultural Sources. In: 375 OL, editor. .
Cox, T.J., Rutherford, J.C., Kerr, S.C., Smeaton, D.C., Palliser, C.C., 2013.An integrated model for simulating nitrogen trading in an agricultural catchment with complex hydroge-ology. J. Environ. Manag. 127, 268–277.
Cruickshank, J.G., 1997.Soil and Environment: Northern Ireland. UK: Agricultural and En-vironmental Science Division, DANI and the Agricultural and EnEn-vironmental Science Dep. The Queen's University Belfast, Newforge Lane, Belfast, UK.
DAERA, 2018a.Environmental Farming Scheme (EFS) General Information and Guidance. 2018. Department of Agriculture, Environment and Rural Affairs.
DAERA, 2018b.Statistical Review of Northern Ireland Agriculture 2018. Department of Agriculture, Environment and Rural Affairs.
Darch, T., Carswell, A., Blackwell, M.S.A., Hawkins, J.M.B., Haygarth, P.M., Chadwick, D., 2015.Dissolved phosphorus retention in buffer strips: influence of slope and soil type. J. Environ. Qual. 44, 1216–1224.
DEFRA. Fertiliser Manual (RB209). In: Department of Environment FaRAD, editor. The Sta-tionary Office, UK, 2010.
Doody, D.G., Withers, P.J., Dils, R.M., McDowell, R.W., Smith, V., McElarney, Y.R., et al., 2016.Optimizing land use for the delivery of catchment ecosystem services. Front. Ecol. Environ. 14, 325–332.
Dorioz, J.M., 2013.Mechanisms and control of agricultural diffuse pollution: the case of phosphorus. Biotechnol. Agron. Soc. Environ. 17, 277–291.
Dupas, R., Gruau, G., Gu, S., Humbert, G., Jaffrézic, A., Gascuel-Odoux, C., 2015. Groundwa-ter control of biogeochemical processes causing phosphorus release from riparian wetlands. Water Res. 84, 307–314.
Elser, J., Bennett, E., 2011.A broken biogeochemical cycle. Nature 478, 29–31. European Commission, 2016.Commission Delegated Regulation (EU) 2016/1613 of 8
September 2016 providing for exceptional adjustment aid to milk producers and farmers in other livestock sectors. C/2016/5663. Off. J. Eur. Union L242, 10–14. Expert Working Group on Sustainable Land Management, 2016.Delivering Our Future,
Valuing Our Soils: A Sustainable Agricultural Land Management Strategy for North-ern Ireland. DAERA, p. 132.
Fealy, R., Schröder, J.J., 2008.Assessment of Manure Transport Distances and their Impact on Economic and Energy Costs. Proceedings 642. International Fertiliser Society, York, pp. 1–28.
Fertiliser Association of Ireland, 2016.Soil pH and Lime. Technical Bulletic Series No. 2, Ireland. p. 11.
Foy, R.H., Kirk, M., 1995.Agriculture and water quality - a regional study. J. Chart. Inst. Water Environ. Manage. 9, 247–256.
Fraser, R., 2012.Moral hazard, targeting and contract duration in agri-environmental pol-icy. J. Agric. Econ. 63, 56–64.
Hart, R., Latacz-Lohmann, U., 2005.Combating moral hazard in agri-environmental schemes: a multiple-agent approach. Eur. Rev. Agric. Econ. 32, 75–91.
Jarvie, H.P., Sutton, E.J., Withers, P.J.A., Harper, D.M., Stoate, C., Foy, B., et al., 2007.Impacts of Agricultural Land Use on Streamwater and Sediment P Concentrations: Implica-tions for P-Cycling in Lowland Rivers.
Jarvie, H.P., Sharpley, A.N., Spears, B., Buda, A.R., May, L., Kleinman, P.J.A., 2013.Water quality remediation faces unprecedented challenges from“legacy phosphorus”. Envi-ron. Sci. Technol. 47, 8997.
Lastra-Bravo, X.B., Hubbard, C., Garrod, G., Tolón-Becerra, A., 2015.What drives farmers' participation in EU agri-environmental schemes?: Results from a qualitative meta-analysis. Environ. Sci. Pol. 54, 1–9.
Macintosh, K.A., Doody, D.G., Withers, P.J.A., McDowell, R.W., Smith, D.R., Johnson, L.T., et al., 2019.Transforming soil phosphorus fertility management strategies to support the delivery of multiple ecosystem services from agricultural systems. Sci. Total Envi-ron. 649, 90–98.
McCabe, A.M., Clark, P.U., Clark, J., 2005.AMS 14C dating of deglacial events in the Irish Sea Basin and other sectors of the British–Irish ice sheet. Quat. Land-ocean Correl. 24, 1673–1690.
McDowell, R.W., Dils, R.M., Collins, A.L., Flahive, K.A., Sharpley, A.N., Quinn, J., 2016.A re-view of the policies and implementation of practices to decrease water quality im-pairment by phosphorus in New Zealand, the UK, and the US. Nutr. Cycl. Agroecosyst. 104, 289–305.
McDowell, R.W., Snelder, T., Harris, S., Lilburne, L., Larned, S.T., Scarsbrook, M., et al., 2018. The land use suitability concept: introduction and an application of the concept to in-form sustainable productivity within environmental constraints. Ecol. Indic. 91, 212–219.
Mellander, P.-E., Jordan, P., Bechmann, M., Fovet, O., Shore, M.M., McDonald, N.T., et al., 2018.Integrated climate-chemical indicators of diffuse pollution from land to water. Sci. Rep. 8, 944.
Murphy, J., Riley, J.P., 1962.A modified single solution method for the determination of phosphate in natural waters. Anal. Chim. Acta 27, 31–36.
Olsen, S.R., Cole, C.V., Watanabe, F.S., 1954.Estimation of Available Phosphorus in Soils by Extraction With Sodium Bicarbonate. USDA, Washington.
Pavlis, E.S., Terkenli, T.S., Kristensen, S.B.P., Busck, A.G., Cosor, G.L., 2016.Patterns of agri-environmental scheme participation in Europe: indicative trends from selected case studies. Land Use Policy 57, 800–812.
Ruane, E.M., Treacy, M., McNamara, K., Humphreys, J., 2014.Farm-gate phosphorus bal-ances and soil phosphorus concentrations on intensive dairy farms in the south-west of Ireland. Ir. J. Agric. Food Res. 53, 105–119.
Scholz, R.W., Ulrich, A.E., Eilittä, M., Roy, A., 2013.Sustainable use of phosphorus: afinite resource. Sci. Total Environ. 461-462, 799–803.
Schoumans, O.F., Chardon, W.J., Bechmann, M.E., Gascuel-Odoux, C., Hofman, G., Kronvang, B., et al., 2014.Mitigation options to reduce phosphorus losses from the agricultural sector and improve surface water quality: a review. Sci. Total Environ. 468-469, 1255–1266.
Schulte, R.P.O., Melland, A.R., Fenton, O., Herlihy, M., Richards, K., Jordan, P., 2010. Model-ling soil phosphorus decline: expectations of Water Framework Directive policies. Environ. Sci. Pol. 13, 472–484.
Sharpley, A., Jarvie, H.P., Buda, A., May, L., Spears, B., Kleinman, P., 2013.Phosphorus leg-acy: overcoming the effects of past management practices to mitigate future water quality impairment. J. Environ. Qual. 42, 1308–1326.
Souillard, R., Le Maréchal, C., Ballan, V., Mahé, F., Chemaly, M., Le Bouquin, S., 2017.A bo-vine botulism outbreak associated with a suspected cross-contamination from a poultry farm. Vet. Microbiol. 208, 212–216.
Tappin, A.D., Navarro-Rodriguez, A., Comber, S.D.W., Worsfold, P.J., 2018.The role of alka-linity in setting water quality metrics: phosphorus standards in United Kingdom riv-ers. Environ. Sci.: Processes Impacts 20, 1361–1372.
Tarboton, D.G., 1997.A new method for the determination offlow directions and upslope areas in grid digital elevation models. Water Resour. Res. 33, 309–319.
The Nitrates Action Programme Regulations (Northern Ireland) 2014 No. 307.The Nitrates Action Programme Regulations (Northern Ireland) 2014. In: Department of Agricul-ture EaRA, editor, UK, 2014.
Thomas, I.A., Jordan, P., Mellander, P.E., Fenton, O., Shine, O., Ó hUallacháin, D., et al., 2016a.Improving the identification of hydrologically sensitive areas using LiDAR DEMs for the delineation and mitigation of critical source areas of diffuse pollution. Sci. Total Environ. 556, 276–290.
Thomas, I.A., Mellander, P.E., Murphy, P.N.C., Fenton, O., Shine, O., Djodjic, F., et al., 2016b. A sub-field scale critical source area index for legacy phosphorus management using high resolution data. Agric. Ecosyst. Environ. 233, 238–252.
Thomas, I.A., Jordan, P., Shine, O., Fenton, O., Mellander, P.E., Dunlop, P., et al., 2017. Defin-ing optimal DEM resolutions and point densities for modellDefin-ing hydrologically sensi-tive areas in agricultural catchments dominated by microtopography. Int. J. Appl. Earth Obs. Geoinf. 54, 38–52.
UKMO, 2018.UK Climate, Rainfall - January Average: 1981–2010. The Met Office Crown Copyright, 2018.
UKTAG, 2013.In: Directive, UTAGotWF (Ed.), Updated Recommendations on Phosphorus Standards for Rivers; River Basin Management 2015–2021, p. 12.
Wall, D.P., Murphy, P.N.C., Melland, A.R., Mechan, S., Shine, O., Buckley, C., et al., 2012. Evaluating nutrient source regulations at different scales infive agricultural catch-ments. Environ. Sci. Pol. 24, 34–43.
Wall, D.P., Jordan, P., Melland, A.R., Mellander, P.-E., Mechan, S., Shortle, G., 2013. Forecast-ing the decline of excess soil phosphorus in agricultural catchments. Soil Use Manag. 29, 147–154.
Walter, M.T., Steenhuis, T.S., Mehta, V.K., Thongs, D., Zion, M., Schneiderman, E., 2002. Re-fined conceptualization of TOPMODEL for shallow subsurfaceflows. Hydrol. Process. 16, 2041–2046.
Wang, L., Liu, H., 2006.An efficient method for identifying andfilling surface depressions in digital elevation models for hydrologic analysis and modelling. Int. J. Geogr. Inf. Sci. 20, 193–213.
Withers, P.J.A., Lord, E.I., 2002.Agricultural nutrient inputs to rivers and groundwaters in the UK: policy, environmental management and research needs. Sci. Total Environ. 282–283, 9–24.
Withers, P.J.A., Neal, C., Jarvie, H.P., Doody, D.G., 2014.Agriculture and eutrophication: where do we go from here? Sustainability 6, 5853–5875.
Zevenbergen, L.W., Thorne, C.R., 1987.Quantitative analysis of land surface topography. Earth Surf. Process. Landf. 12, 47–56.