PROBABILISTIC RANDOM WALK MODELS FOR COMPARATIVE NETWORK ANALYSIS
A Dissertation by
HYUNDOO JEONG
Submitted to the Office of Graduate and Professional Studies of Texas A&M University
in partial fulfillment of the requirements for the degree of DOCTOR OF PHILOSOPHY
Chair of Committee, Byung-Jun Yoon Co-Chair of Committee, Xiaoning Qian
Committee Members, Edward R. Dougherty P. R. Kumar
Won-Bo Shim Head of Department, Miroslav M. Begovic
August 2017
Major Subject: Electrical Engineering
ABSTRACT
Graph-based systems and data analysis methods have become critical tools in many fields as they can provide an intuitive way of representing and analyzing interactions be-tween variables. Due to the advances in measurement techniques, a massive amount of labeled data that can be represented as nodes on a graph (or network) have been archived in databases. Additionally, novel data without label information have been gradually gen-erated and archived. Labeling and identifying characteristics of novel data is an important first step in utilizing the valuable data in an effective and meaningful way. Comparative network analysis is an effective computational means to identify and predict the properties of the unlabeled data by comparing the similarities and differences between well-studied and less-studied networks. Comparative network analysis aims to identify the matching nodes and conserved subnetworks across multiple networks to enable a prediction of the properties of the nodes in the less-studied networks based on the properties of the matching nodes in the well-studied networks (i.e., transferring knowledge between networks).
One of the fundamental and important questions in comparative network analysis is how to accurately estimate node-to-node correspondence as it can be a critical clue in analyzing the similarities and differences between networks. Node correspondence is a comprehensive similarity that integrates various types of similarity measurements in a balanced manner. However, there are several challenges in accurately estimating the node correspondence for large-scale networks. First, the scale of the networks is a critical issue. As networks generally include a large number of nodes, we have to examine an extremely large space and it can pose a computational challenge due to the combinatorial nature of the problem. Furthermore, although there are matching nodes and conserved subnetworks in different networks, structural variations such as node insertions and deletions make it
difficult to integrate a topological similarity.
In this dissertation, novel probabilistic random walk models are proposed to accurately estimate node-to-node correspondence between networks. First, we propose a context-sensitive random walk (CSRW) model. In the CSRW model, the random walker analyzes the context of the current position of the random walker and it can switch the random movement to either a simultaneous walk on both networks or an individual walk on one of the networks. The context-sensitive nature of the random walker enables the method to effectively integrate different types of similarities by dealing with structural variations. Second, we propose the CUFID (Comparative network analysis Using the steady-state network Flow to IDentify orthologous proteins) model. In the CUFID model, we construct an integrated network by inserting pseudo edges between potential matching nodes in different networks. Then, we design the random walk protocol to transit more frequently between potential matching nodes as their node similarity increases and they have more matching neighboring nodes. We apply the proposed random walk models to comparative network analysis problems: global network alignment and network querying. Through extensive performance evaluations, we demonstrate that the proposed random walk models can accurately estimate node correspondence and these can lead to improved and reliable network comparison results.
DEDICATION
ACKNOWLEDGMENTS
First of all, I would like to express my sincere and deepest gratitude to my advisor, Professor Byung-Jun Yoon, for his priceless advice and support for my graduate studies. I will always be thankful for how he put my best interest first in order to successfully further my career. I will forever remember him as my life’s greatest advisor, teacher, and mentor. I would also like to acknowledge my co-advisor, Professor Xiaoning Qian, for his guidance and encouragement in my research. I respect his enthusiasm and integrity for research and hope to one day follow in his ways.
I would also like to acknowledge my proposal and defense committee members: Pro-fessor Edward R. Dougherty, ProPro-fessor P. R. Kumar, ProPro-fessor Won-Bo Shim, ProPro-fessor I-Hong Hou, and Professor Yoonsuck Choe. I also recognize and appreciate Dr. A. Datta, Dr. Charles D. Johnson and Dr. Noushin Ghaffari at the Center for Bioinformatics and Genomics Systems Engineering.
I would like to thank my parents for their unconditional love, support, and encourage-ment. My mother’s constant prayers for my health and wellbeing and my father’s endless dedication in support of our family have served as a great inspiration to me throughout my studies. I would also like to thank my brother for his concern and consistent prayers for me. I would like to give a special thanks to my lovely niece, Ha Yool. In every difficult moment or hardship that came my way, her smile and laughter would lift my spirits. I would like to thank my beloved Kyoung Hwa for her encouragements and prayers for me. Last but not least, I would like to thank God for his guidance in my lifetime. My life without God is nothing. Soli Deo gloria. All glory to God.
CONTRIBUTORS AND FUNDING SOURCES
Contributors
This work was supported by a dissertation committee consisting of Professor Byung-Jun Yoon, Professor Xiaoning Qian, Professor Edward R. Dougherty, and Professor P. R. Kumar of the Department of Electrical and Computer Engineering and Professor Won-Bo Shim of the Department of Plant Pathology and Microbiology.
Funding Sources
Graduate study was supported by a National Science Foundation (NSF) CAREER: Models and Algorithms for Comparative Analysis of Biological Networks (NSF award CCF-1149544) and EAGER: Identifying Blockmodel Functional Modules across Multiple Networks (NSF award CCF-1447235).
NOMENCLATURE
BLAST Basic Local Alignment Search Tool
CE Conserved Edges
CI Conserved Interactions
CN Correct Nodes
COI Conserved Orthologous Interactions
CSRW Context-Sensitive Random Walk
CUFID Comparative network analysis Using the steady-state network Flow to IDentify orthologous proteins
FDR False Discovery Rate
GO Gene Ontology
GOC Gene Ontology Consistency
HMM Hidden Markov Model
IC Information Content
MEA Maximum Expected Accuracy
MNE Mean Normalized Entropy
MWBM Maximum Weighted Bipartite Matching
PCT Probabilistic Consistent Transformation
PPI Protein-Protein Interactions
PPR Personalized PageRank
TABLE OF CONTENTS
Page
ABSTRACT . . . ii
DEDICATION . . . iv
ACKNOWLEDGMENTS . . . v
CONTRIBUTORS AND FUNDING SOURCES . . . vi
NOMENCLATURE . . . vii
TABLE OF CONTENTS . . . viii
LIST OF FIGURES . . . x
LIST OF TABLES . . . xii
1. INTRODUCTION . . . 1
1.1 Background . . . 1
1.2 Outline of the dissertation . . . 2
2. ESTIMATION OF NODE-TO-NODE CORRESPONDENCE BETWEEN DIF-FERENT GRAPHS . . . 4
2.1 Context-sensitive random walk model . . . 4
2.1.1 Motivation and overall approach . . . 5
2.1.2 Proposed random walk model . . . 6
2.1.3 Performance assessments . . . 8
2.1.4 Conclusions . . . 11
2.2 Network alignment through the context-sensitive random walk model . . 11
2.2.1 Background and motivation . . . 11
2.2.2 Methods . . . 14
2.2.3 Results . . . 18
2.2.4 Conclusions . . . 28
2.3 Network querying through the context-sensitive random walk model . . . 29
2.3.1 Background and motivtion . . . 29
2.3.3 Results . . . 39
2.3.4 Conclusions . . . 49
3. ESTIMATION OF NODE-TO-NODE CORRESPONDENCE BY MEASUR-ING THE STEADY-STATE NETWORK FLOW USMEASUR-ING A MARKOV MODEL 51 3.1 CUFID model . . . 51
3.1.1 Problem formulation . . . 51
3.1.2 Motivation and overall approach . . . 52
3.1.3 Methods . . . 54
3.2 Network alignment through the CUFID model . . . 61
3.2.1 Methods . . . 61
3.2.2 Results . . . 63
3.2.3 Conclusions . . . 74
3.3 Network querying through the CUFID model . . . 74
3.3.1 Methods . . . 76
3.3.2 Results . . . 86
3.3.3 Conclusions . . . 95
4. SUMMARY AND CONCLUSIONS . . . 97
REFERENCES . . . 99
APPENDIX A. LIST OF DATABASES FOR COMPARATIVE NETWORK ANAL-YSIS . . . 112
LIST OF FIGURES
FIGURE Page
2.1 Illustration of the context-sensitive random walk model. . . 5
2.2 Performance dependence on pairwise node similarity. . . 10
2.3 The total number of conserved orthologous interactions and conserved in-teractions. . . 22
2.4 Equivalence class coverage for 5-way network alignment. . . 23
2.5 Equivalence class coverage for 8-way network alignment. . . 24
2.6 Computation time for aligning real PPI networks. . . 28
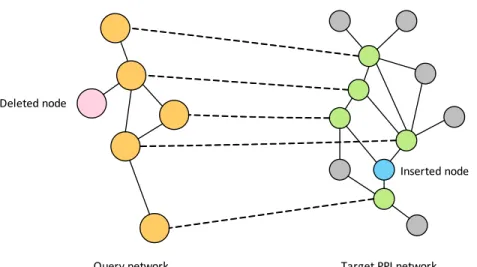
2.7 Illustration for the query network and conserved subnetwork in the target network. . . 33
2.8 Example for the pre-processing: removing non-homologous nodes. . . 35
2.9 Example for the pre-processing: inserting pseudo edges. . . 35
2.10 Number of matches for each query and target species pair (i.e., query species – target species). . . 44
2.11 Number of significant hits and significant functionally coherent (FC) hits for the 863 query complexes. . . 45
2.12 Number of hits and FC hits for querying 863 biological complexes. . . 47
2.13 Computation time of 863 querying results for each querying algorithm. . . 49
3.1 Illustration of how node correspondence is measured based on the steady-state network flow. . . 54
3.2 Illustration for constructing the integrated network from a network pair. . 55
3.4 Illustration of the main difference between CSRW model and CUFID model. 60 3.5 GOC scores of various pairwise network alignment algorithms. . . 68 3.6 Illustration of a typical network querying problem. . . 75 3.7 Illustration for constructing the integrated network by combining the query
and target networks. . . 79 3.8 Estimating the steady-state network flow based on the CUFID model. . . 81 3.9 The number of hits and the number of meaningful hits are shown for each
network querying algorithm. . . 89 3.10 The number of specific hits for each network querying algorithm. . . 91 3.11 The specificity of the predictions made by different network querying
al-gorithms. . . 92 3.12 Computation time for each algorithm. . . 94
LIST OF TABLES
TABLE Page
2.1 Performance comparison of different scoring methods. . . 9
2.2 Performance comparison for pairwise network alignment. . . 21
2.3 Performance comparison for 5-way network alignment. . . 21
2.4 Performance comparison for 8-way network alignment. . . 21
2.5 Mean computation time for aligning PPI networks in the NAPAbench. . . 25
2.6 Pairwise network alignment results for real PPI networks. . . 26
2.7 Multiple network alignment results for real PPI networks (for 3 species). . 26
2.8 Significant SPE for the ontology aspect of “cellular component”. . . 46
2.9 SPE for the ontology aspect of “cellular component”. . . 48
3.1 Memory complexity to construct a transition probability matrix. . . 61
3.2 Pairwise alignment results for the IsoBase dataset. Protein functionality is determined based on the KEGG Orthology (KO) group annotations. . . . 67
3.3 Number of conserved interactions (CI) obtained by different network align-ment algorithms. . . 69
3.4 Number of conserved orthologous interactions (COI) obtained by different network alignment algorithms. . . 70
3.5 CPU time of the tested network alignment algorithms (in seconds). . . 72
3.6 The number of identified nodes and the number of annotated nodes. . . . 93
A.1 List of available databases for PPI network analysis. . . 112
A.2 Databases for known biological complexes. . . 112
1. INTRODUCTION
1.1 Background
Graph-based system and data analysis techniques have become a critical tool in many fields as it can provide an intuitive way of representing interactions between variables and analyzing them [1, 2, 3, 4]. In recent years, graph-based techniques have been widely applied to the analysis of social networks [5, 6], images [7, 8], and biological networks [9, 10]. Additionally, we can infer the properties of the less-studied system by comparing it with the well-studied systems and finding the corresponding elements. To this aim, given multiple graphs, one question that is of practical importance is how the nodes in a given graph can be mapped to nodes in the other graphs based on the similarity between nodes and the topological similarity between graphs. Considering that each node may have a number of similar nodes in the other graphs and that the graphs may have signifi-cant differences in their topology, quantitatively estimating this overall similarity between nodes – or thenode correspondence– is theoretically challenging. Furthermore, estimat-ing these similarities can pose computational challenges, especially for large graphs, due to the combinatorial nature of the problem.
So far, several methods have been proposed for measuring the node correspondence between graphs, where random walk based methods have been popular as they are intu-itive and can be efficiently implemented [10, 11, 12, 13, 14, 15]. These methods perform a simultaneous random walk on the two graphs to be compared, where the random walk scheme is designed such that the walker more frequently visits (or stays longer at) node pairs that have higher similarity and are surrounded by a larger number of similar node pairs. The stationary probability of the resulting (semi-)Markov model gives us the long-run proportion of time that the random walker simultaneously visits (and stays at) a given
node pair, which can be used as the correspondence score between the two nodes. This score provides a simple and intuitive way of measuring the overall similarity between two nodes in different graphs by integrating the node similarity and the topological sim-ilarity [10]. Recently, these random walk models have been applied to the comparative analysis of large-scale biological networks [12, 13].
In this study, we have studied effective methods for comparative network analysis based on a graphical representation of systems so that we can transfer the knowledge of the well-analyzed system into the less-studied system. We have proposed novel random walk models that can significantly improve the accuracy of the estimation of the node-to-node correspondence between different graphs. Additionally, we have verified the effectiveness of the proposed method on biological networks. Although we mainly present the per-formance evaluations using biological networks, the proposed random walk models and algorithms can be applied to various types of networks. Note that two terms, network and graph, are utilized interchangeably in this dissertation.
1.2 Outline of the dissertation
In this dissertation, we propose novel probabilistic random walk models and present their applications to comparative network analysis using biological networks. In the chap-ter 2, we propose the context-sensitive random walk model to estimate node-to-node cor-respondence between graphs through a long-run behavior of a random walker. In the chapter 3, we propose a novel random walk model, called the CUFID model, to estimate node correspondences by measuring the steady-state network flow between networks. We will show that the CUFID model further improves the estimation accuracy of the node correspondences with the reduced computational complexity. In the chapter 2 and 3, we present the potential applications of the proposed random walk models in global network alignment and network querying problem. We will demonstrate the effectiveness of the
proposed random walk models through extensive performance evaluations using synthetic networks and real biological networks.
2. ESTIMATION OF NODE-TO-NODE CORRESPONDENCE BETWEEN DIFFERENT GRAPHS∗
In this chapter, we propose a novel random walk model that can significantly improve the accuracy of the estimation of the node correspondence between different graphs. The proposed random walker performs a random walk on the two graphs to be compared, where it can switch its mode between a simultaneous walk on both graphs and an indi-vidual walk on one of the graphs. The mode switching is determined by the presence (or absence) of similar node pairs among the current neighbors. Through extensive simula-tions, we show that the proposed model leads to an enhanced node-correspondence scoring method that clearly outperforms existing methods.
2.1 Context-sensitive random walk model
Consider two graphsGU = (U,D)andGV = (V,E), whereGU consists of a set U =
{u1, u2,· · · } of nodes and a set D = {dij} of edges between nodes ui and uj and GV
consists of a set V ={v1, v2,· · · }of nodes and a setE ={eℓm}of edges between nodes
vℓandvm. We assume that a nonnegative pairwise node similarity scores(ui, vj)is given
for every node pair(ui, vj). Our goal is to estimate the node correspondence scorec(ui, vj)
for every node pair (ui, vj) that quantifies the overall similarity between these nodes by
integrating the pairwise node similarity scores and the topological similarity between the two graphs in a reasonable manner. In other words, we want the node correspondence scorec(ui, vj)to be proportional to the posterior alignment probabilityP[ui ∼vj|GU,GV]
∗Part of this chapter is reprinted with a permission from “Hyundoo Jeong and Byung-Jun Yoon. Effective
estimation of node-to-node correspondence between different graphs.IEEE Signal Processing Letters" [16] c
⃝[2015] IEEE and “Hyundoo Jeong and Byung-Jun Yoon. Accurate multiple network alignment through context-sensitive random walk. BMC Systems Biology, 9(Suppl. 1):S7, 2015" [17] c⃝ [2015] BioMed Central and “Hyundoo Jeong and Byung-Jun Yoon. SEQUOIA: Significance enhanced network querying through context-sensitive random walk and minimization of network conductance. BMC Systems Biology," 11(Suppl. 3):20, [18] c⃝[2017] BioMed Central.
(
i, j)
0 s u v > U G GV vc uc ui uc+1 uc+2 vj vj+1 vj+2 vj(a) Simultaneous walk on both graphs
U G GV vc uc ui uc+1 uc+2 vj vj+1 vj+2 vj
(b) Individual walk on either graph (GU in the ex-ample shown)
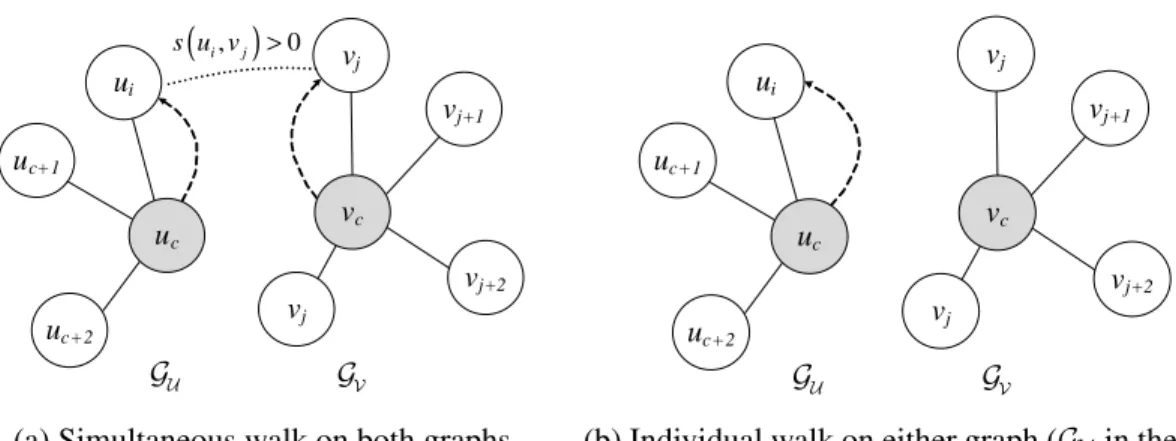
Figure 2.1: Illustration of the context-sensitive random walk model. The shaded nodes show the current position of the random walker on the two graphs. The dashed arrows indicate the movement of the random walker at the next time step [16] c⃝[2015] IEEE.
ofuiandvj givenGU andGV.
2.1.1 Motivation and overall approach
We propose a novel random walk model to measure the node correspondence score c(ui, vj). Our random walk model is motivated by the pair hidden Markov model
(pair-HMM), which has been widely used for the comparative analysis of biological sequences (e.g., sequence alignment) due to its simplicity and effectiveness [19, 20].
Unlike traditional HMMs, which generate a single symbol sequence, the pair-HMM generates a pair of aligned symbol sequences. A typical pair-HMM has three different states:M,I1, andI2. At theM state (indicates a “matched” symbol pair), the HMM emits an aligned symbol pair. On the other hand, at theIk state (indicates an “inserted” symbol
in either sequence), the HMM only emits a symbol to sequence-k alone that is aligned to a gap symbol in the other sequence. Given two (unaligned) symbol sequences, we can use the forward-backward algorithm to predict the alignment probabilities between symbols in the two sequences based on the pair-HMM [20].
Similarly, the proposed random walk model has three different internal states,M,IU,
andIV, where each state corresponds to a different “mode” of random walk. At aM state,
which corresponds to “matched” node pair, the random walker makes a simultaneous walk on both graphs, moving into a pair of matched nodes. This is illustrated in Figure 2.1a. On the other hand, at stateIU (or stateIV), the random walker makes an “individual” walk
on graphGU (orGV). Figure 2.1b illustrates the individual walk at stateIU. The random
walker can switch its mode between a simultaneous walk and an individual walk, in a context dependent way by examining the neighborhood. In the presence of node pairs in the immediate neighborhood with a positive node similarity score, the random walker will make a simultaneous move on both graphs by randomly moving into one of the similar node pairs (M state). Otherwise, the random walker will make a transition to either state IU orIV and make a random move only on the corresponding graph.
Based on this random walk model, we estimate the steady state probabilities of this random walk, or in other words, the long-run proportion of time that the random walker will simultaneously visit a given node pair. Finally, from these steady state probabilities, we estimate the actual proportion of time that the random walker spends at a given node pair by “entering” the nodessimultaneously(i.e., at stateM), which we used as the corre-spondence score for the node pair. It should be noted that this last step is crucial, since we are not interested in the case when the random walker happens to stay at a node pair as a result of an individual move on one of the graphs. In such cases, the simultaneous visit of the two nodes is coincidental and is not a direct result of the relevance between the given nodes.
2.1.2 Proposed random walk model
LetGX = (X,EX)be the product graph ofGU andGV, where the nodes in the graph
prod-uct graph GX are connected if and only if the corresponding nodes are connected in both GU and GV. Joint random walk on the two graphs GU and GV, both simultane-ous walk and individual walk, can be viewed as a random walk on this product graph
GX. We define M = {(ui, vj)|s(ui, vj)>0, ui ∈ U, vj ∈ V} as the set of similar node
pairs, where s(ui, vj) is the pairwise node similarity score for the node pair (ui, vj).
Suppose that the random walker is currently located at (uc, vc) for some uc ∈ U and
vc ∈ V. Let us define the set of similar node pairs in the neighborhood of (uc, vc) as
N(uc, vc) = {(ui, vj)|ui ∈ N(uc), vj ∈ N(vc),(ui, vj)∈ M}, whereN(uc)is the set of
neighbors of nodeuc in graph GU and N(vc)is the set of neighbors of nodevcin graph
GV.
If there are similar node pairs in the current neighborhood, hence N(uc, vc) ̸= ∅,
the random walker makes a simultaneous move on both graphs, from(uc, vc)to (ui, vj),
according to the following transition probabilities:
P[(ui, vj)|(uc, vc) ]
= ∑ s(ui, vj)
(ui′,vj′)∈N(uc,vc)s(ui′, vj′)
. (2.1)
On the other hand, if there is no similar node pair in the neighborhood, henceN(uc, vc) =
∅, the random walker randomly selects eitherGU orGV and performs an individual walk only on the selected graph. The probability that each graph will be selected is propor-tional to its size (i.e., number of nodes in the graph), and in the selected graph, the random walker will move into one of the neighboring nodes with equal probability. The resulting transition probabilities are given by
P[(ui, vc)|(uc, vc) ] = |U| |U|+|V| × 1 |N(uc)| (2.2a) P[(uc, vj)|(uc, vc) ] = |V| |U|+|V| × 1 |N(vc)| (2.2b)
for ui ∈ N(uc) and vj ∈ N(vc). Note that|U| and |V| denote the number of nodes in
the graph GU and GV, respectively. From (2.1), (2.2a), and (2.2b), we can construct the transition probability matrixPfor the random walk on the product graphGX. In practice, the matrixPwill be often sparse, as the original graphsGU andGV that arise in practical applications will be typically sparse. This property makes it easy to compute the steady state probabilityπ(ui, vj)of the random walk using the power method [12, 13, 21]. Given
π(ui, vj), we finally compute the actual proportion of timeπ(uˆ i, vj)that the random walker
spends at (ui, vj) by entering the node pair through a simultaneous random walk (i.e., at
stateM) as follows: ˆ π(ui, vj) = ∑ (up,uq)∈N(ui,uj) π(up, uq)·P [ (ui, vj)|(up, vq) ] , (2.3)
for all (ui, vj) ∈ M. Finally, we define the correspondence score between two nodesui
andvj asc(ui, vj)≡π(uˆ i, vj), whereui ∈ GU andvj ∈ GV. As we will demonstrate in the
following section, the proposed scoring scheme effectively quantifies the overall similarity between nodes in different graphs by seamlessly integrating the pairwise node similarity and the topological similarity between graphs.
2.1.3 Performance assessments
In order to demonstrate the effectiveness of the proposed scoring method, we per-formed extensive simulations based on synthetic graphs [22]. To evaluate the performance, we computed the node correspondence scores using the proposed scheme, and used the scores to predict the graph alignment through greedy one-to-one mapping. More specifi-cally, we started from an empty alignment and built up the graph alignment by iteratively adding one node pair at a time according to its correspondence score in a descending or-der. Given the final alignment, we define the equivalence class as the set of nodes that are aligned to each other. A given equivalence class is said to be correct if the aligned nodes
Pair. Sim. Score IsoRank SMETANA CSRW
CN 519 549 533.4 704.4
MNE 0.28 0.31 0.27 0.15
CE 510.2 581.5 554.3 1,000.4
Table 2.1: Performance comparison of different scoring methods [16] c⃝[2015] IEEE.
have the same label, indicating that they belong to the same functional class. We com-puted three different metrics to assess the goodness of the predicted alignment: correct nodes (CN), mean normalized entropy (MNE), and conserved edges (CE). CN is the total number of aligned nodes that belong to the correct equivalence class. The coherence of the node mapping can be accessed by MNE. MNE for a given equivalence classCcan be computed byH(C) =−log1d∑id=1pilogpi, wherepiis the relative proportion of nodes in
Cwith labelianddis the total number of different labels. A mapping with higher coher-ence will lead to a lower entropy. CE counts the total number of conserved edges between aligned nodes in the predicted graph alignment. CE can be used to assess the performance of detecting conserved topological structures across graphs. For comparison, we repeated similar experiments by using two state-of-the-art scoring schemes used in IsoRank [12] (parameterαwas set to 0.6 as in the original paper) and SMETANA [13].
Using the NAPAbench package [22], we generated 10 pairs of synthetic graphs based on the crystal growth model [23], where each pair consists of a graph with 750 nodes and another graph with 1,000 nodes. On average, the smaller graphs had around 3,000 edges and the larger graphs had around 4,000 edges. For every pair of graphs, the true corre-spondence between the nodes in the two graphs are known, hence we can evaluate the effectiveness of the proposed scheme. Table 2.1 shows the performance of different scor-ing methods. The proposed method clearly outperforms all other methods. For example, the proposed scoring method finds around 30 percent more correct nodes compared to the
0 50 100 150 200 250 500 750 1000 C N Bias Pair. Sim. Score IsoRank SMETANA Proposed (a) CN 0 50 100 150 200 250 0.0 0.1 0.2 0.3 0.4 0.5 M N E Bias Pair. Sim. Score IsoRank SMETANA Proposed (b) MNE 0 50 100 150 200 250 500 1000 1500 2000 C E Bias Pair. Sim. Score IsoRank SMETANA Proposed
(c) CE
Figure 2.2: Performance dependence on pairwise node similarity: correct nodes (left), mean normalized entropy (center), and conserved edges (right) [16] c⃝[2015] IEEE.
scoring methods in IsoRank [12] and SMETANA [13]. Furthermore, the proposed method yields a more coherent mapping as indicated by the lower MNE. It is also important to note that our proposed method results in significantly higher CE, which implies that the resulting node correspondence scores capture the topological similarity between graphs more effectively.
Next, we evaluated the influence of the pairwise node similarity scores on the perfor-mance of each method. For this purpose, we introduced an additional bias term to further separate the distribution of the pairwise node similarity score between nodes with the same label and the score distribution for nodes with different labels. A higher bias makes it eas-ier to predict the correspondence between nodes in different graphs based on the pairwise node similarity score alone (i.e., without taking topological similarity into account). Fig-ure 2.2 shows that the proposed method significantly outperforms other scoring methods for a wide range of bias. As we would expect, the performance difference between the proposed method and the other methods decreases with an increasing bias, as it becomes easier to distinguish relevant nodes from irrelevant ones.
2.1.4 Conclusions
In this subchapter, we proposed a context-sensitive random walk model for scoring the correspondence between nodes that belong to two different graphs. The proposed method utilizes a novel random walk model that switches between two different modes of random walk – simultaneous walk on both graphs and individual walk on either graph – in a context dependent manner. The node correspondence scores are estimated based on the steady stationary probabilities of the random walk. Simulation results show that the proposed scoring method significantly outperforms previous methods that rely on different random walk models in terms of accuracy and robustness. Our scoring scheme can provide an effective and computationally efficient foundation for comparative analysis of graphs, including biological networks and social networks.
2.2 Network alignment through the context-sensitive random walk model 2.2.1 Background and motivation
With the availability of large-scale protein-protein interactions (PPI) networks, com-parative network analysis tools have been gaining increasing interests as they provide use-ful means of investigating the similarities and differences between different networks. As demonstrated in [9, 24], PPI networks of different species embed various conserved func-tional modules – such as signaling pathways and protein complexes – which can be de-tected through network querying [11, 25, 26] and network alignment algorithms [12, 13, 27, 28, 29, 30, 31, 32, 33]. Comparative network analysis methods allow us to transfer existing knowledge on well-studied organism to less-studied ones and they have the po-tential to detect popo-tential functional modules conserved across different organisms and species [9, 10, 24].
There exist several different types of comparative network analysis methods, among which global network alignment methods specifically aim to predict the best overall
map-ping among two or more biological networks. In order to obtain biologically meaningful results, where functionally similar biomolecules across networks are accurately mapped to each other, we should consider both the molecule-level similarity between the individ-ual molecules as well as the similarity between their interaction patterns. The former is often called the “node similarity” while the latter is typically referred to as the “topolog-ical similarity.” Examination of conserved functional modules shows that many of the molecular interactions in such modules are also well conserved, clearly showing the im-portance of taking the topological similarity into account when comparatively analyzing biological networks. Biological networks, such as PPI networks, are typically represented as graphs, where the nodes represent individual biomolecules (e.g., proteins) and interac-tions (e.g., protein binding) between biomolecules are represented by edges connecting the corresponding nodes. Given these graph representations of biological networks, the network alignment problem can be formulated as an optimization problem whose goal is to find the optimal mapping – either one-to-one or many-to-many – among a set of graphs that maximizes a scoring function that assesses the goodness of a given mapping. This is essentially a combinatorial optimization problem with a exponentially large search space, which makes finding the optimal mapping practically infeasible for large networks. As a result, existing network alignment methods employ various heuristic techniques to make the network alignment problem computationally tractable.
Several global network alignment algorithms have been proposed so far [12, 13, 27, 28, 29, 30, 31, 34, 32, 33], many of which focus on the pairwise network alignment [35]. For example, GRAAL [29] analyzes the graphlet degree signature for two PPI networks, where it can generalize the degree of node by counting the number of graphlets for each node, and then align the two networks using a seed-and-extend approach. MI-GRAAL [30] ex-tends GRAAL by integrating further sources of information (e.g., clustering coefficient or functional similarity) to measure the similarity between two networks. PINALOG [31]
is another example of pairwise network alignment algorithm, which constructs the initial mapping for protein nodes that form dense subgraphs in the respective networks. This initial mapping is further extended by subsequently finding similar nodes in the neighbor-hood. HubAlign [34] first assigns weights to the nodes and edges in the PPI networks based on their topological importance (i.e., likelihood to be a hub), and then calculates the alignment score for every pair of proteins based on the global topological property and sequence information. Then, the algorithm constructs a global network alignment using a greedy seed-and-extension approach. Recently, a number of multiple network alignment algorithms have been proposed [13, 32, 33]. For example, SMETANA [13] tries to esti-mate probabilistic node correspondence scores using a semi-Markov random walk model, and then uses the estimated scores to predict the maximum expected accuracy (MEA) alignment of the given networks. Given a set of networks, NetCoffee [32] generates all possible combinations of bipartite graphs for these networks, and updates the edges in each bipartite graph based on the sequence similarity of the proteins and the topological structure of the networks. Then, the algorithm finds candidate edges (i.e., mappings) in the bipartite graphs and combines qualified edges through simulated annealing. BEAMS [33] is another recent multiple network alignment algorithm, which first extracts the so-called “backbones”, or the minimal set of disjoint cliques in the filtered similarity graph, and then iteratively merges these backbones to maximize the overall alignment score.
In this subchapter, we propose a novel multiple network alignment algorithm based on a context-sensitive random walk (CSRW) model. The employed CSRW model adaptively switches between different modes of random walk in a context-sensitive manner by sens-ing and analyzsens-ing the present neighborhood of the random walker. This context-sensitive behavior improves the quantitative estimation of the potential correspondence between nodes belonging to different networks, ultimately, improving the overall accuracy of the multiple network alignment as we will demonstrate through extensive performance
evalu-ation based on real and synthetic biological networks.
2.2.2 Methods
Let us assume that we have a set of N PPI networksG = {G1,G2, . . . ,GN}. Each
networkGn= (Vn,En)has a set of nodesVn={v1, v2, . . .}and edgesEn={ei,j}, where
ei,j represents the interaction between nodes vi and vj in the networkGn. For each pair
of PPI networks GU = (U,D) andGV = (V,E), we denote the pairwise node similarity score for a node pair (ui, vj), where ui ∈ U and vj ∈ V, as s(ui, vj). In this study,
we use the BLAST bit score between proteins as their node similarity score, but other types of similarity scores based on structural or functional similarity can be also utilized if available.
Suppose A∗ is the true alignment of the networks in the set G, which is unknown and needs to be predicted. As in [13, 36], we can define the accuracy of a given network alignmentAas follows: accuracy(A,A∗) = 1 |A| ∑ ui∼vj∈A 1(ui ∼vj ∈ A∗), (2.4)
where1(·)is an indicator function, whose value is 1 if the mapping ui ∼ vj is included
in the true alignment A∗ and 0 otherwise. The given measure assesses the goodness of the alignment A based on the relative proportion of correctly aligned nodes. Of course, since the true alignment is not known, the accuracy of a network alignment A cannot be measured using (2.4), hence we cannot directly use this measure to compare different potential alignments to choose the best one. A reasonable alternative would be to estimate the expected accuracy as follows:
EA∗[accuracy(A,A∗)] = 1
|A|
∑ ui∼vj∈A
where P(ui ∼vj|G)is the posterior alignment probability between the nodes ui and vj
given the set of networks G. Based on this measure, our objective is then to predict the maximum expected accuracy (MEA) network alignment A˜∗ of the networks inGas follows:
˜
A∗ = max
A EA∗[accuracy(A
∗,A)]. (2.6)
A similar MEA approach [37] has been formerly adopted by a number of multiple se-quence alignment algorithms, including ProbCons [36], ProbAlign [38], and PicXAA [39, 40, 41]. The MEA framework has been shown to be very effective in constructing accurate alignment of multiple biological sequences, making it one of the most popular approaches for a sequence alignment. Recently, the MEA approach has been also applied to compar-ative network analysis, where RESQUE [11] performs MEA-based network querying and SMETANA [13] performs MEA-based multiple network alignment.
In order to find the alignment that maximizes the expected accuracy defined in (2.5), we first need an accurate method for estimating the posterior node alignment probability P (ui ∼vj|G). For this purpose, we adopt a proposed context-sensitive random walk
model [16].
Suppose we want to measure the correspondence between nodes that belong to two different networks GU = (U,D) and GV = (V,E), both of which are included in G, the set of PPI networks to be aligned. For every node pair (ui, vj), where ui ∈ U and
vj ∈ V, our goal is to quantify the level of confidence – which we refer to as the node
correspondence score– using the CSRW model discussed earlier. For this purpose, based on the transition probabilities given by (2.1), (2.2a), and (2.2b), we can construct the tran-sition probability matrix P that corresponds to the context-sensitive random walk for a simultaneous walk and individual walk on the two networksGU andGV. GivenP, we can estimate the long-run proportion of time that the random walker spends in each pair of
nodes(ui, vj)by computing the steady state probabilityπ. In practice, since real PPI
net-works typically have a relatively small number of interactions (therefore only few edges for most nodes), the resulting transition probability matrix for the CSRW is sparse, which makes it relatively straightforward to compute the steady state distribution using the power method [12, 13, 21].
In order to increase the computational efficiency of the proposed network alignment method, instead of using the original transition probability matrix P, we use a reduced matrixPe. The reduced matrixPe is obtained by removing the rows and columns inPthat correspond to node pairs inI while keeping only the rows and columns that correspond to node pairs inM. After the reduction,Pe is re-normalized to make it a legitimate stochastic matrix. In practice, since the CSRW is designed to spend more time at node pairs with higher similarity, the random walker spends a relatively small amount of time at node-pairs that belong to the setI, and using the reduced matrixPe instead ofPonly minimally affects the estimated long-run proportion of time spent at(ui, vj)∈ M.
We make one further modification to the CSRW in [16] by allowing the random walker to restart at a new position at each time step with a fixed restart probability λ. Note that a similar “random walk with restart” approach was used by IsoRank [12] and Iso-RankN [27], although these algorithms do not utilize the CSRW adopted in our method. We allow the random walker to select its restart position according to the pairwise node similarity, such that node pairs with higher node similarity have higher chance to be the restart position of the random walker. To this aim, we normalize the pairwise node sim-ilarity scores so that they sum up to 1. Our final node correspondence score vector c is obtained from a linear combination of the steady-state distribution of the context-sensitive random walker π˜ (estimated using the reduced transition probability matrix Pe) and the
normalized node similarity score vectorsas follows:
c=λs+ (1−λ) ˜π. (2.7)
The above formulation, obtained by allowing the CSRW to restart the random walk at a new position, is especially useful when comparing real PPI networks, which are often in-complete and contain many isolated nodes. Simulation results show that the incorporation of the restart scheme can make our CSRW-based alignment method more robust, espe-cially when the available topological data are either unreliable or insufficient for detecting the similarities between networks.
In order to determine the restart probabilityλ, we first analyze the structure of the re-duced product graph of GU andGV that contains only similar node pairs included in M. Intuitively, it is desirable to increase the restart probability λ if the networks are discon-nected and decrease the probability if the networks are well condiscon-nected. For example, if all the nodes in the reduced product graph are completely disconnected, it is desirable to restart the random walker at every step. Additionally, when we consider the following two cases – (i) most nodes in the product graph are connected and there are only a few discon-nected nodes; (ii) the product graph is equally divided into N connected subnetworks of identical size – it would be desirable to assign a higherλto the latter case. Based on these intuitions, we set the restart probability λas the ratio of the total number of nodes in the topK% smallest subnetworks to the total number of nodes in the reduced product graph. In this work, we usedK = 99%to determine the restart probabilityλ.
Once we have computed the node correspondence scores in (2.7) for every pair of networks in G, we take a greedy approach as in [13] to construct the multiple network alignment. The overall alignment process is as follows. First, in order to improve the reliability of the node correspondence scores, we selectively apply the probabilistic
con-sistent transformation (PCT) defined in [13]. If λ is larger than a predefined threshold λt, we do not apply PCT to the node correspondence scores. A large λ implies that the
product graph is ill connected (e.g., containing a large number of isolated nodes), in which case applying the PCT would not be helpful and may in fact make the scores less reliable. This is because the PCT in [13] was developed based on the assumption that the product graphs for all network pairs are relatively well connected. After the potential score refine-ment step through PCT, we begin with an empty alignrefine-ment and greedily add aligned node pairs(ui, vj)to the network alignment, starting from the pairs with the highest node
corre-spondence scores, until there is no other node pair left that can be added without creating inconsistencies in the network alignment. Assuming that the node correspondence scores in (2.7) obtained by the context-sensitive random walk model with restart accurately re-flect the true correspondence between nodes – such that the score is proportional to the posterior node alignment probability – the proposed network alignment scheme can be viewed as a heuristic way to find the MEA alignment of the networks inG.
2.2.3 Results
To assess the performance of the proposed method, we tested the proposed network alignment method based on PPI networks in NAPAbench [22] and IsoBase [42]. NA-PAbench is a network alignment benchmark that consists of 3 different datasets, referred to as the pairwise alignment dataset, 5-way alignment dataset, and 8-way alignment dataset. Each dataset contains three different subsets of 10 network families, each subset cre-ated using a different network growth model – CG (crystal growth), DMC (duplication-mutation-complementation), and DMR (duplication with random mutation). Each net-work family consists of 2, 5, or 8 PPI netnet-works depending on the alignment dataset. For network families in the pairwise alignment dataset, each family contains one network with 3,000 nodes and the other with 4,000 nodes. In the 5-way network alignment dataset, a
network family consists of 5 networks with 1,000, 1,500, 2,000, 2,500, and 2,500 nodes. Finally, in the 8-way alignment dataset, every network family consists of 8 networks, where each network contains 1,000 nodes. To evaluate the performance of the proposed method on real PPI networks, we utilized IsoBase datasets [42], which was constructed by integrating the following databases: BioGRID [43], DIP [44], HPRD [45], MINT [46], and IntAct [47]. IsoBase contains the PPI networks of five species: H. sapiens, M. mus-culus, D. melanogaster, C. elegans, and S. cerevisiae. Currently, the PPI network of H. sapiensin [42] has 22,369 proteins and 43,757 interactions, the PPI network ofM. mus-culus has 24,855 proteins and 452 interactions, the PPI network of D. melanogaster has 14,098 proteins and 26,726 interactions, the PPI network ofC. eleganshas 19,756 proteins and 5,853 interactions, and the PPI network ofS. cerevisiaehas 6,659 proteins and 38,109 interactions. In our analysis, we excluded theM. musculusnetwork as it currently contains only a small number of interactions.
Based on our simulations, we report the following performance metrics: correct nodes (CN), specificity (SPE), mean normalized entropy (MNE), conserved interaction (CI), cov-erage and computation time. CN is the total number of nodes in the correct equivalence classes. Given a network alignment, an equivalence class is defined as the set of aligned nodes, and if all nodes in the equivalence class have the same functionality the given equiv-alence class is said to be correct. SPE is the relative number of correct equivequiv-alence classes to the total number of equivalence classes in a network alignment. For each equivalence classC, the normalized entropy can be computed byH(C) =−log1d∑di=1pilogpi, where
pi is the relative proportion of nodes inCwith functionalityianddis the total number of
different functionalities in the given equivalence class. As a result, a network alignment that accurately maps functionally similar nodes, hence being functionally consistent, will have lower mean normalized entropy. CI is defined as the total number of edges between equivalence classes. We also count the total number of edges between correct equivalence
classes, which we refer to as the conserved orthologous interactions (COI), to assess the biological relevance of the conserved interactions that have been identified by the net-work alignment method. Finally, for 5-way and 8-way alignment datasets, we measure the equivalence class coverage and the node coverage, where the former is the number of equivalence classes that include nodes from k different networks, and the latter is the number of nodes in an equivalence class whose equivalence class coverage isk. For the performance evaluation based on real PPI networks in IsoBase, we determined the func-tionality of each protein using the KEGG protein annotation [48, 49]. Note that nodes without any functional annotation in each equivalence class and equivalence classes that consist of a single node or nodes from a single network were removed before computing the performance metrics.
We compared the performance of the proposed multiple network alignment method against a number of state-of-the-art algorithms: SMETANA [13], IsoRankN [27], PINA-LOG [31], NetCoffee [32], and BEAMS[33]. NetCoffee was not included in pairwise net-work alignment experiments, since it requires at least 3 netnet-works. For multiple netnet-work alignment experiments, PINALOG was excluded as the algorithm can only handle pair-wise alignments. For IsoRankN, we set the parameterαto 0.6 as in the original paper [27]. For BEAMS, we set the filtering threshold to 0.4 for IsoBase and 0.2 for NAPAbench as in the original paper [33], and set the parameterαto 0.5. The parameterαfor NetCoffee was set to 0.5. We used default parameters for SMETANA (i.e.,nmax = 10,α= 0.9, and β = 0.8), and the same parameters were used in the proposed network alignment method as well. Finally, in the proposed method, we usedλt= 0.7to determine whether or not to
apply PCT to the estimated node correspondence scores.
All experiments were performed on a personal computer with a 2.4GHz Intel i7 pro-cessor and 8GB memory.
DMC DMR CG
CN SPE MNE CN SPE MNE CN SPE MNE
Proposed 5,593.9 0.958 0.039 5,305.3 0.939 0.055 4,893.2 0.942 0.054 SMETANA 5,164.5 0.926 0.068 4,900.6 0.916 0.078 4,846.2 0.949 0.048 BEAMS 5,076.5 0.826 0.150 5,176.7 0.840 0.138 5,441.2 0.870 0.112 PINALOG 3,779 0.726 0.274 3,533.4 0.683 0.317 4,325 0.788 0.212 IsoRankN 3,816.5 0.827 0.163 3,905.2 0.836 0.155 3,863.2 0.832 0.159
Table 2.2: Performance comparison for pairwise network alignment [17] c⃝[2015] BMC.
DMC DMR CG
CN SPE MNE CN SPE MNE CN SPE MNE
Proposed 7,536.7 0.940 0.047 7,410.3 0.934 0.053 7,177.6 0.919 0.060
SMETANA 7,273.2 0.912 0.069 7,181.8 0.915 0.068 7,331.6 0.935 0.048
BEAMS 6,842.2 0.863 0.104 6,882 0.873 0.096 7,376.5 0.921 0.062
NetCoffee 6,431.2 0.894 0.090 6,395.7 0.890 0.093 6,150.2 0.854 0.120
IsoRankN 5,559 0.920 0.147 5,462.3 0.793 0.162 5,688.4 0.828 0.132
Proposed (all 5 species) 4,476.9 0.931 0.048 4,017.9 0.916 0.060 3,644.8 0.900 0.068 SMETANA (all 5 species) 4,062.3 0.891 0.077 3,704.9 0.889 0.080 3,778.9 0.922 0.052 BEAMS (all 5 species) 2,858.4 0.814 0.121 3,095.2 0.838 0.104 3,510.3 0.918 0.052 NetCoffee (all 5 species) 2,960.4 0.867 0.106 2,973.3 0.855 0.113 2,841.2 0.796 0.156 IsoRankN (all 5 species) 1,668.1 0.728 0.179 1,595.4 0.677 0.215 2,233.5 0.742 0.168
Table 2.3: Performance comparison for 5-way network alignment [17] c⃝[2015] BMC.
DMC DMR CG
CN SPE MNE CN SPE MNE CN SPE MNE
Proposed 6,621.3 0.901 0.080 6,467.2 0.891 0.090 6,345.4 0.884 0.090
SMETANA 6,336.7 0.869 0.106 6,195.2 0.860 0.114 6,481.2 0.897 0.079
BEAMS 6,083.1 0.825 0.163 6,063.5 0.826 0.162 6,537.6 0.877 0.111
NetCoffee 5,127.2 0.757 0.206 5,084.1 0.750 0.213 4,944.1 0.724 0.239
IsoRankN 4,069.1 0.644 0.268 3,916.7 0.623 0.284 3,860 0.612 0.291
Proposed (all 8 species) 4,116 0.961 0.034 3,473.7 0.930 0.059 3,689.5 0.945 0.043 SMETANA (all 8 species) 3,686.7 0.920 0.066 3,348.9 0.907 0.075 3,785.6 0.960 0.031 BEAMS (all 8 species) 2,897.9 0.905 0.095 3,054.7 0.901 0.099 3,475.1 0.989 0.011 NetCoffee (all 8 species) 3,300.8 0.837 0.136 3,331.8 0.822 0.148 3,317.8 0.800 0.172 IsoRankN (all 8 species) 2,002.8 0.569 0.284 1,775.8 0.542 0.303 2,161.6 0.536 0.303
DMC DMR CG 0 2000 4000 6000 8000 10000 Proposed:COI Proposed:CI SMETANA:COI SMETANA:CI BEAMS:COI BEAMS:CI PINALOG:COI PINALOG:CI IsoRankN:COI IsoRankN:CI
(a) Pairwise alignment.
DMC DMR CG 0 1000 2000 3000 4000 Proposed:COI Proposed:CI SMETANA:COI SMETANA:CI BEAMS:COI BEAMS:CI NetCoffee:COI NetCoffee:CI IsoRankN:COI IsoRankN:CI (b) 5-way alignment. DMC DMR CG 0 1000 2000 3000 Proposed:COI Proposed:CI SMETANA:COI SMETANA:CI BEAMS:COI BEAMS:CI NetCoffee:COI NetCoffee:CI IsoRankN:COI IsoRankN:CI (c) 8-way alignment.
Figure 2.3: The total number of conserved orthologous interactions (COI) and conserved interactions (CI) [17] c⃝[2015] BMC.
network alignment benchmark and compared it to other leading algorithms. The evaluation results are summarized in Table 2.2, 2.3, and 2.4, which show the average CN, SPE, and MNE of various network alignment algorithms.
As we can see in Table 2.2, in most cases, the proposed algorithm yields a significantly higher CN and SPE compared to other algorithms, which shows that the algorithm is ca-pable of finding conserved nodes with both high sensitivity and specificity. Furthermore, the mean normalized entropy (MNE) is also much lower, indicating that the proposed al-gorithm yields network alignment results that are more functionally coherent. This table shows that BEAMS yields higher CN for the CG dataset, although its SPE is lower and its MNE is higher than the proposed method. Both SMETANA and the proposed algo-rithm shows similar performance on the CG dataset, but we can also see that the proposed algorithm consistently outperforms SMETANA on the DMC/DMR datasets.
Multiple network alignment results obtained using the 5-way alignment dataset and the 8-way alignment dataset show similar trends. Tables 2.3 and 2.4 show that, in most cases, our proposed algorithm outperforms other algorithms with higher CN, higher SPE, and lower MNE. For multiple networks alignment, we further compared different net-work alignment algorithms based on their capability of predicting equivalence classes that
Proposed SMETANA BEAMS NetCoffee IsoRankN 0 500 1000 1500 2000 2500 5 species 4 species 3 species 2 species 1 species (a) DMC
Proposed SMETANA BEAMS NetCoffee IsoRankN 0 500 1000 1500 2000 2500 5 species 4 species 3 species 2 species 1 species (b) DMR
Proposed SMETANA BEAMS NetCoffee IsoRankN 0 500 1000 1500 2000 2500 5 species 4 species 3 species 2 species 1 species (c) CG
Proposed SMETANA BEAMS NetCoffee IsoRankN 0
3000 6000 9000
(d) DMC
Proposed SMETANA BEAMS NetCoffee IsoRankN 0
3000 6000 9000
(e) DMR
Proposed SMETANA BEAMS NetCoffee IsoRankN 0
3000 6000 9000
(f) CG
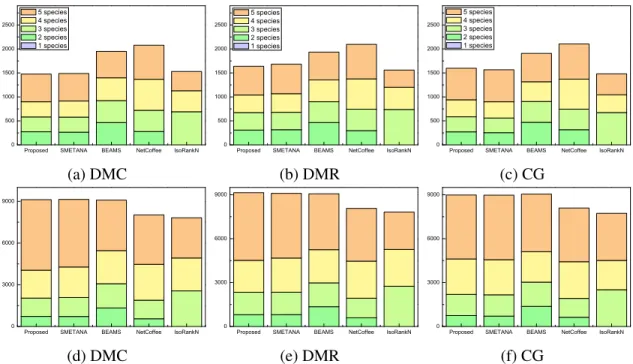
Figure 2.4: Equivalence class coverage for 5-way network alignment: (a) DMC; (b) DMR; (c) CG, and node coverage for 5-way network alignment: (d) DMC; (e) DMR; (f) CG [17]
c
⃝[2015] BMC.
span all networks, since one of the main goals of multiple network alignment is to find functionally homologous proteins that are conserved in the networks of all target species. Simulation results show that, in most cases, our proposed method also yields much higher CN and SPE as well as lower MNE for equivalence classes that span all networks.
Next, we compared the number of conserved (orthologous) interactions identified by different network alignment algorithms. As Figure 2.3 shows, the proposed method was able to identify the largest number of conserved interactions as well as conserved orthol-ogous interactions in most cases, resulting in higher CI and COI. The performance of SMETANA was comparable to the proposed method, while other algorithms typically resulted in lower CI and COI. It is worth noting that more than 95% of the conserved interactions that were detected by our proposed network alignment algorithm were be-tween correct equivalence classes (i.e., conserved orthologous interactions). This certainly
Proposed SMETANA BEAMS NetCoffee IsoRankN 0 500 1000 1500 8 species 7 species 6 species 5 species 4 species 3 species 2 species 1 species (a) DMC
Proposed SMETANA BEAMS NetCoffee IsoRankN 0 500 1000 1500 2000 8 species 7 species 6 species 5 species 4 species 3 species 2 species 1 species (b) DMR
Proposed SMETANA BEAMS NetCoffee IsoRankN 0 500 1000 1500 2000 8 species 7 species 6 species 5 species 4 species 3 species 2 species 1 species (c) CG
Proposed SMETANA BEAMS NetCoffee IsoRankN 0 2000 4000 6000 8000 (d) DMC
Proposed SMETANA BEAMS NetCoffee IsoRankN 0 2000 4000 6000 8000 (e) DMR
Proposed SMETANA BEAMS NetCoffee IsoRankN 0 2000 4000 6000 8000 (f) CG
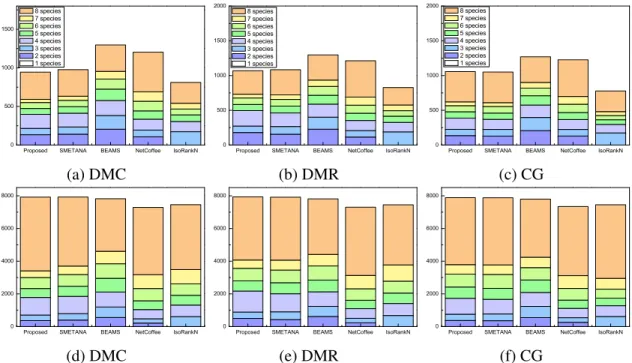
Figure 2.5: Equivalence class coverage for 8-way network alignment: (a) DMC; (b) DMR; (c) CG, and node coverage for 8-way network alignment: (d) DMC; (e) DMR; (f) CG [17]
c
⃝[2015] BMC.
shows that our method can effectively detect biologically meaningful conserved interac-tions through network alignment.
We also analyzed the overall coverage of the predicted alignment results for the 5-way and 8-5-way network alignments. The results are shown in Figure 2.4 for the 5-5-way network alignment and in Figure 2.5 for the 8-way network alignment. For the 5-way network alignment, we can see that around 40% of the equivalence classes predicted by the proposed method contained nodes from all 5 networks. SMETANA shows a similar level of coverage, while for the remaining algorithms, only about 30% of the predicted equivalence classes included nodes from all 5 networks. The overall node coverage also shows similar trends. The 8-way alignment results summarized in Figure 2.5 show that the proposed algorithm can effectively find equivalence classes with good coverage, which include nodes from a large number of networks. For example, we can see that around 40%
Algorithms Pairwise 5-way 8-way Average Proposed 117.8 273.1 178.7 189.8 SMETANA 6.9 58.0 70.7 45.2 BEAMS 42.4 134.8 333.8 170.3 PINALOG 77.1 · · 77.1 NetCoffee · 132.7 225.7 179.2 IsoRankN 1083.7 3326.1 2694.8 2368.2
Table 2.5: Mean computation time for aligning PPI networks in the NAPAbench datasets (in seconds) [17] c⃝[2015] BMC.
of the equivalence classes predicted by the proposed method contained nodes from all 8 networks.
Table 2.5 shows the mean computation time of the respective algorithms for aligning the network families in the NAPAbench datasets. As we can see in Table 2.5, SMETANA requires the least amount of time for aligning the networks in NAPAbench, while Iso-RankN needs the most computation time. In our simulations, we observed that NetCoffee runs relatively fast, although its computation time varies significantly depending on the network structure. For example, it took much longer to align networks in the DMR dataset using NetCoffe, compared to networks in the DMC or CG datasets.
For further evaluation, we performed additional experiments using real PPI networks in IsoBase. Table 2.6 shows the pairwise network alignment performance of the tested algorithms for several PPI network pairs. As we can see in this table, the proposed algo-rithm consistently performs fairly well in all cases, outperforming the other algoalgo-rithms. We can make similar observations in Table 2.7, which summarizes the performance eval-uation results for aligning 3 PPI networks. The proposed algorithm attains high CN, high SPE, and low MNE across all cases, showing that it can effectively compare and accu-rately align real PPI networks. BEAMS shows good performance on multiple alignment of real networks that is comparable to the proposed method, with a slightly lower SPE
H.sa-S.ce D.me-S.ce C.el-S.ce
CN SPE MNE CN SPE MNE CN SPE MNE
Proposed 1307 0.689 0.310 1725 0.727 0.277 1543 0.796 0.196 SMETANA 1190 0.671 0.331 1579 0.709 0.295 1443 0.771 0.222 BEAMS 1306 0.649 0.347 1636 0.675 0.320 1499 0.742 0.247 PINALOG 1100 0.682 0.324 1368 0.722 0.289 640 0.737 0.266 IsoRankN 1367 0.765 0.238 1641 0.777 0.230 1458 0.843 0.155 Node Similarity 1486 0.740 0.259 1832 0.779 0.224 1670 0.831 0.163
D.me-H.sa D.me-C.el C.el-H.sa
CN SPE MNE CN SPE MNE CN SPE MNE
Proposed 2681 0.724 0.279 2714 0.855 0.146 1995 0.771 0.224 SMETANA 2274 0.671 0.331 2458 0.827 0.175 1684 0.737 0.255 BEAMS 2612 0.658 0.338 2738 0.808 0.192 1941 0.691 0.300 PINALOG 1172 0.604 0.412 672 0.689 0.317 482 0.677 0.325 IsoRankN 2635 0.759 0.246 2488 0.851 0.150 1881 0.783 0.216 Node Similarity 2932 0.750 0.251 2897 0.875 0.125 2185 0.770 0.227
Table 2.6: Pairwise network alignment results for real PPI networks [17] c⃝[2015] BMC.
D.me-C.el-H.sa S.ce-C.el-H.sa S.ce-D.me-C.el S.ce-D.me-H.sa
CN SPE MNE CN SPE MNE CN SPE MNE CN SPE MNE
Proposed 4,331 0.705 0.289 3,077 0.709 0.281 3,581 0.746 0.247 3,637 0.672 0.326 SMETANA 3,871 0.663 0.331 2,625 0.657 0.333 3,227 0.714 0.279 3,108 0.616 0.380 BEAMS 4,354 0.676 0.316 3,084 0.671 0.320 3,606 0.727 0.267 3,629 0.627 0.366 NetCoffee 1,471 0.552 0.451 1,234 0.575 0.426 1,477 0.593 0.414 1,877 0.540 0.465 IsoRankN 4,423 0.717 0.279 3,131 0.711 0.282 3,464 0.749 0.245 3,752 0.684 0.313 NodeSimilarity 4,775 0.746 0.248 3,457 0.737 0.256 3,920 0.798 0.197 4,132 0.719 0.278 Proposed (all 3-species) 3,926 0.702 0.290 2,387 0.724 0.265 2,624 0.715 0.271 2,540 0.681 0.315 SMETANA (all 3-species) 3,442 0.671 0.323 2,106 0.677 0.312 2,378 0.685 0.301 2,225 0.630 0.363 BEAMS (all 3-species) 3,867 0.687 0.304 2,277 0.711 0.278 2,573 0.718 0.272 2,441 0.672 0.318 NetCoffee (all 3-species) 747 0.518 0.478 578 0.528 0.465 713 0.538 0.462 1,167 0.516 0.489 IsoRankN (all 3-species) 3,757 0.753 0.241 2,323 0.775 0.215 2,470 0.732 0.258 2,510 0.726 0.267
Table 2.7: Multiple network alignment results for real PPI networks (for 3 species) [17] c
⃝[2015] BMC.
and a slightly higher MNE. Additionally, although BEAMS and IsoRankN achieve higher CN in some cases, the proposed method consistently yields higher CN than these methods
with comparable SPE and MNE when we consider multiple network alignment results for regions that are conserved across all networks. Another observation we can make in Ta-ble 2.6 is that IsoRankN performs very well on real PPI networks compared to the other more recent algorithms. This is especially interesting, if we consider the fact that the per-formance of IsoRankN lagged behind the other algorithms according to the large-scale evaluations using NAPAbench. One possible explanation is that, for constructing the net-work alignment, IsoRankN relies on node similarity (i.e., sequence similarity in this case) more strongly compared to the other algorithms. In order to find out whether this is indeed a plausible explanation, we performed network alignment experiments solely using node similarity scores (i.e., without considering network topology), where we constructed the network alignment in a greedy manner by iteratively adding protein pairs with the highest node similarity scores. The alignment results are shown in Tables 2.6 and 2.7 right be-low the results for IsoRankN (labeled as “Node Similarity”). Surprisingly, these results show that this simple greedy network alignment approach that uses node similarity alone outperforms IsoRankN in most cases and surpasses all the other algorithms in all cases. In fact, currently available PPI networks are known to be very incomplete and these net-work typically contain a large number of isolated nodes. They are suspected to include a large number of spurious interactions while still missing many potential protein-protein interactions [50, 51]. Furthermore, only a small proportion of proteins in these PPI net-works have reliable functional annotations (e.g., according to KEGG orthology), making it difficult to reliably assess the quality of a predicted network alignment. As a result, for current PPI networks, utilization of topological similarity between networks may not be necessarily helpful for improving the overall quality of the network alignment across the entire network. Moreover, since only a few large real PPI networks are available at the moment, we risk overtraining network alignment algorithms if they are mainly evaluated solely based on real PPI networks.
D.me - C.el C.el - S.ce C.el - H.sa D.me - H.saD.me - S.ceH.sa - S.ce 1 10 100 1000 10000 R u n n i n g T im e ( se co n d )
SMETANA BEAMS Proposed PINALOG IsoRankN
(a) Pairwise network alignment.
D.me - C.el - H.sa S.ce - C.el - H.sa S.ce - D.me - C.el S.ce - D.me - H.sa 1 10 100 1000 10000 100000 R u n n i n g T im e ( se co n d )
NetCoffee SMETANA BEAMS Proposed IsoRankN
(b) Multiple network alignment (for 3 species).
Figure 2.6: Computation time for aligning real PPI networks (in seconds) [17] c⃝[2015] BMC.
Figure 2.6 shows the computation time for aligning the PPI networks in IsoBase. SMETANA required the least computation time for pairwise network alignment and Net-Coffee was the fastest among all for aligning the PPI networks of 3 species. Although IsoRankN yielded accurate alignment results for real PPI networks in IsoBase, it also re-quired the largest amount of computation time in most cases. Figure 2.6 shows that our proposed network alignment algorithm requires relatively longer running time compared to other algorithms, in exchange for the improved alignment accuracy.
2.2.4 Conclusions
In this subchapter, we proposed a novel network alignment algorithm based on a context-sensitive random walk model. The CSRW model provides an effective mathe-matical framework for comparing different biological networks and quantifying the node-to-node correspondence between nodes that belong to different networks. In our proposed method, we combined the CSRW model with a restart scheme, where the restart proba-bility is automatically adjusted based on the characteristics of the networks under com-parison. Furthermore, the proposed network alignment algorithm employs adaptive prob-abilistic consistency transformation, where the PCT is adaptively activated or deactivated
based on the overall structure of the given networks. As we have shown through extensive performance evaluations based on biologically realistic PPI networks in NAPAbench as well as real PPI networks in IsoBase, the novel network alignment algorithm proposed in this subchapter can significantly improve the overall accuracy of pairwise as well as multiple network alignment.
2.3 Network querying through the context-sensitive random walk model 2.3.1 Background and motivtion
Protein-protein interaction (PPI) plays pivotal roles in understanding biological sys-tems. Diverse functional modules in cells, such as signaling pathways and protein com-plexes, involve numerous proteins and their functions are governed by the intertwined interactions among these proteins. For this reason, to better understand the functions and roles of proteins in cells, it is critically important to investigate how groups of proteins collaborate with each other to perform certain biological functions and achieve common goals, in addition to studying the functions of individual proteins. Recent advances in tech-nologies for high throughput measurement of protein-protein interactions have enabled genome-scale studies of protein interactions, and systematic analyses of the available PPI networks may reveal new functional network modules and unveil novel functionalities of the proteins that are involved in such modules. Recent investigations of PPI networks show that functionally important network modules (e.g., molecular complexes and path-ways) are often well conserved across networks of different species [9, 24]. These ob-servations clearly point to comparative network analysis [10] as a promising solution for effectively analyzing large-scale PPI networks, detecting common functional modules that are embedded in the networks, and predicting the functions of proteins that comprise these modules.
which can be especially useful when prior knowledge of functional modules is available for a given species. As implied in its name, network querying aims to find out whether a target network (typically, belonging to another species) contains network modules that resemble the module that is being used as the query [10]. This provides an efficient way of transferring knowledge between species, since we could use computational means to predict potential network modules in a new (or less-studied) species that may have sim-ilar functions, structures, and underlying mechanisms to well-studied modules in other species.
Several network querying algorithms have been proposed [11, 25, 52, 53, 54, 55, 56, 57, 58]. PathBLAST [52] is one of pioneering network querying algorithms, but it can search only linear pathways and the computational complexity limits the size of the query network. QPath [53] can search much longer pathways than PathBLAST and QNet [25] can search both linear pathways and tree structure, but both algorithms still requires high computational complexity and searching capability is limited to either a pathway or a tree. PathMatch [54] solves a network querying problem by finding the longest weighted path in a directed acyclic graph (target network) and GraphMatch [54] finds highest scoring sub-graphs in a target network using an exact algorithm. SAGA [55] solves an approximated graph matching based on the fragment index, where it is the index on a small substructure of graphs in a database, and SAGA employs a flexible model for node gaps/mismatches and network structural variations. NatalieQ [56] identifies the querying results by solving the integer linear programming through Lagrangian relaxation combined with a branch-and-bound approach. TORQUE [57] proposed a topology-free network querying algo-rithm. That is, it only requires a set of proteins in the query network and it does not necessary to provide the topological structure of the query network. TORQUE finds a connected set of matching proteins through a dynamic and integer linear programming based on a sequence similarity of proteins. RESQUE [11] estimates the node-to-node
![Figure 2.2: Performance dependence on pairwise node similarity: correct nodes (left), mean normalized entropy (center), and conserved edges (right) [16] c ⃝ [2015] IEEE.](https://thumb-us.123doks.com/thumbv2/123dok_us/336219.2536874/23.918.157.788.132.316/figure-performance-dependence-pairwise-similarity-correct-normalized-conserved.webp)
![Table 2.4: Performance comparison for 8-way network alignment [17] c ⃝ [2015] BMC.](https://thumb-us.123doks.com/thumbv2/123dok_us/336219.2536874/34.918.160.787.374.592/table-performance-comparison-way-network-alignment-c-bmc.webp)
![Figure 2.3: The total number of conserved orthologous interactions (COI) and conserved interactions (CI) [17] c ⃝ [2015] BMC.](https://thumb-us.123doks.com/thumbv2/123dok_us/336219.2536874/35.918.169.796.135.315/figure-total-number-conserved-orthologous-interactions-conserved-interactions.webp)
![Table 2.5: Mean computation time for aligning PPI networks in the NAPAbench datasets (in seconds) [17] c ⃝ [2015] BMC.](https://thumb-us.123doks.com/thumbv2/123dok_us/336219.2536874/38.918.277.671.134.294/table-mean-computation-aligning-networks-napabench-datasets-seconds.webp)
![Figure 2.8: Example for the pre-processing: removing non-homologous nodes [18]](https://thumb-us.123doks.com/thumbv2/123dok_us/336219.2536874/48.918.193.766.128.320/figure-example-pre-processing-removing-non-homologous-nodes.webp)
![Figure 2.10: Number of matches for each query and target species pair (i.e., query species – target species) [18] c ⃝ [2017] BMC.](https://thumb-us.123doks.com/thumbv2/123dok_us/336219.2536874/57.918.234.716.139.510/figure-number-matches-target-species-species-target-species.webp)