University of Bradford eThesis
This thesis is hosted in
Bradford Scholars
– The University of Bradford Open Access
repository. Visit the repository for full metadata or to contact the repository team
© University of Bradford. This work is licenced for reuse under a
Creative Commons
Detection of Breast Cancer
Microcalcifications in Digitized
Mammograms
Developing Segmentation and Classification Techniques for
the Processing of MIAS Database Mammograms Based on the
Wavelet Decomposition Transform and Support
Vector Machines
Husam E. I. Al-Osta
Submitted for the Degree of
Doctor of Philosophy
Department of Electronic Imaging and Media Communications
School of Informatics
University of Bradford
2010
ABSTRACT
KeywordsMammography, wavelet, feature extraction, support vector machines, segmentation
Mammography is used to aid early detection and diagnosis systems. It takes an x-ray image of the breast and can provide a second opinion for radiologists. The earlier detection is made, the better treatment works. Digital mammograms are dealt with by Computer Aided Diagnosis (CAD) systems that can detect and analyze abnormalities in a mammogram. The purpose of this study is to investigate how to categories cropped regions of interest (ROI) from digital mammogram images into two classes; normal and abnormal regions (which contain microcalcifications).
The work proposed in this thesis is divided into three stages to provide a concept system for classification between normal and abnormal cases. The first stage is the Segmentation Process, which applies thresholding filters to separate the abnormal objects (foreground) from the breast tissue (background). Moreover, this study has been carried out on mammogram images and mainly on cropped ROI images from different sizes that represent individual microcalcification and ROI that represent a cluster of microcalcifications. The second stage in this thesis is feature extraction. This stage makes use of the segmented ROI images to extract characteristic features that would help in identifying regions of interest. The wavelet transform has been utilized for this process as it provides a variety of features that could be examined in future studies. The third and final stage is classification, where machine learning is applied to be able to distinguish between normal ROI images and ROI images that may contain microcalcifications. The result indicated was that by combining wavelet transform and SVM we can distinguish between regions with normal breast tissue and regions that include microcalcifications.
Acknowledgment
I owe my deepest gratitude and special thanks to Dr. Rami Qahwaji as primary supervisor. His expertise, inspiration, guidance, constructive suggestions and supervision helped me finish my PhD. I also would like to express my gratitude to Dr. Stanley Ipson as second supervisor for his thoughtful ideas and support in research and work. He has assisted in numerous ways to improve my knowledge of techniques in image processing.
I am obliged to many of my colleagues who supported me during my research work and with whom I also had happy days during my hard times. I want to thank them all for their support, help, interest and valuable hints.
To my beloved wife, I would like to express my undying love and gratitude for her patient love, friendship and support enabled me to complete this work. Finally, I dedicate my thesis to my parents for their constant encouragement, love and support because none of this would have been possible without them.
Table of Content
1. Chapter 1 Introduction………1
1.1.Breast Cancer and Mammography………...1
1.2.Importance of this work and Technical Challenges………3
1.3.Aims and Objectives of the Research………..5
1.4.Outlines of the Thesis………...6
2. Chapter 2 Literature Survey………9
2.1.Introduction………..9
2.2.Mammography Database………10
2.2.1. Analysis of the MIAS Database………...12
2.2.2. The Characteristics of Breast Abnormalities……… ……..13
2.2.3. Microcalcifications………..14
2.2.3.1. Benign Microcalcifications………...14
2.2.3.2. Malignant Microcalcifications………....15
2.2.4. Masses………...16
2.3.Segmentation of Microcalcification Regions………...………..17
2.4.Extraction of Features for the Classification of Breast Tissue………. .21
2.5.Classification………...23
2.6.Summary………...26
3. Chapter 3 Microcalcifications Segmentation………31
3.1.Introduction………...31
3.2.Region of interest (ROI)………...32
3.3.Image Thresholding………....34
3.3.1. Using Square Filters………...35
3.3.2. Using Circler Filters………...45
3.4.Thresholding to 8-bit Images………...52
3.5.Summary………...55
4. Feature Extraction using Wavelet Transform………...58
4.1.Introduction………..58
4.2.Discrete Wavelet Transform………....59
4.2.1. Wavelet Coefficients……….…61
4.2.2. Feature Extraction from ROI Images………64
4.3.Minimum Redundancy Maximum Relevance……….…70
4.4.Practical Implementation of Wavelet Analysis………...71
4.5.Summary………..………...72
5. Machine Learning and Microcalcifications Classification………...74
5.1.Introduction………..74
5.2.Classifiers………....76
5.2.1. Support Vector Machines (SVM)………...76
5.2.2. Radial Basis Function (RBF)………....77
5.3.Implementation and Evaluation………...78
5.3.1. Jack-Knife Technique………...78
5.3.2. RBF Implementation……….79
5.3.3. SVM Implementation………....79
5.3.3.1. First Series of SVM Experiments……….83
5.3.3.2. Second Series of SVM Experiments………....88
5.3.4. Summary……….………...96
6. Conclusion and Future Work………...98
6.1.Thesis Conclusion………98
6.2.Thesis Contribution……….100
6.3.Suggestions for Future Work ………..102
List of Figures
Figure 2.1 MIAS manual of calcifications and normal cases………...12 Figuer 2.2 Images of 1mm x 1mm vignettes containing individual MCs from benign clusters………..15 Figure 2.3 Images of 1 mm x 1 mm vignettes containing individual MCs from malignant clusters………..16 Figuer 2.4 Isolines implementation for pixels with similar brightness………....18 Figure 3.1 Region of interest of size 32×32 showing microcalcifications………...34 Figure 3.2 Square windows filter used in the adaptive thresholding approach to microcalcification detection………...35 Figure 3.3 Segmentation process exmaple from full mammogram (mdb213)…………38 Figure 3.4 Segmentation process exmaple from full mammogram (mdb231)…………39 Figure 3.5 Segmentation process exmaple from full mammogram (mdb238)…………40 Figure 3.6 Segmentation process exmaple from full mammogram (mdb256)…………41 Figure 3.7 Results from the first implementation of adaptive threshold, where (a) & (b) contain 2 regions of interest and (c) contains 1 region of interest………...42 Figure 3.8 Results from the first implementation of the threshold technique…………..43 Figure 3.9 A close up from to two mammograms in (a) and (b) showing the detection of other artefacts detected……….44 Figure 3.10 Circular window filter………..………...45 Figure 3.11 Region of interest from mdb223 with size of 128 × 128 ROI (a) original image, (b) after segmentation using inner and outer filters of (1.5, 11)….…………...46 Figure 3.12 Region of interest from mdb211. (a) Original image. (b) Inverted intensity image. Applying different filter inner and outer radius sizes (c) 1.5, 11 pixels, (d) 1.5, 9 pixels, (e) 1.5, 8 pixels, (f) 2, 9 pixels, (g) 2.5, 11 pixels, (h) 2.5, 8 pixels, (i) 3.5, 11 pixels, (j) 3.5, 8 pixels, (k) 4, 12 pixels, (l) 4, 10 pixels………...47 Figure 3.13 Two examples from the ROI size of 512 × 512 (a) mdb241, (b) mdb249……….48 Figure 3.14 Two examples from the ROI size of 256 × 256 (a) mdb223, (b) mdb238……….49
Figure 3.15 Illustration of largest ROI of 1024 × 1024 before and after thresholding....49 Figure 3.16 Several examples of thresholding, before and after, on 32 × 32 ROI images of individual microcalcification………...50 Figure 3.17 The original image of cluster of microcalcifications from mammogram image mdb219 in (a) and individual microcalcifications centred in the images (b), (c), (d) and (e) after cropping into size32 × 32 pixels………51 Figure 3.18 Applying circular filter using 1.5 pixels for inner window and 11 pixels for outer window using different threshold values………53 Figure 3.19 Applying circular filter using 1.5 pixels for inner window and 11 pixels for outer window using different threshold values………54 Figure 4.1 Two dimensional discrete wavelet transform algorithm……….60 Figure 4.2 Simple decomposition map from the wavelet transform level two……...62 Figure 4.3 Haar wavelet decomposition at level 2 on grey region of interest; first view………..63 Figure 4.4 Haar wavelet decomposition at level 2 on grey region of interest; second view...64 Figure 4.5 Wavelet decomposition results from applying DB-2 wavelet at levels 1 and level 2 to a 32 x 32 region of interest………...65 Figure 4.6 Wavelet decomposition results from applying Haar wavelet at levels 1 and level 2 to a 32 u 32 region of interest……….………..66 Figure 4.7 Wavelet decomposition results from applying dMey wavelet at levels 1 and level 2 to a 32 u 32 region of interest………...66 Figure 4.8 Wavelet decomposition results from applying Haar wavelet at levels 1 and level 2 to a 128 x 128 region of interest………...67 Figure 4.9 Wavelet decomposition results from applying dMey wavelet at levels 1 and level 2 to a 256 u 256 region of interest………...67 Figure 4.10 Wavelet decomposition results from applying DB-2 wavelet at levels 1 and level 2 to a 512 u 512 region of interest………...68 Figure 4.11 The coefficients resulting from applying wavelet decomposition of three levels...69 Figure 5.1 RBF network with 2 input and 2 output nodes……….…………..78
Figure 5.2 input features and output class labels which are ringed in green or red….…80 Figure 5.3 Accuracy results using100 features with degree=2 of 3 wavelet transforms: Haar level1, Db2 level1 and Db4 level2………...83 Figure 5.4 Accuracy results using 100 features with degree=3 of 3 wavelet transforms: Haar level1, Db2 level1 and Db4 level2………...……...84 Figure 5.5 Accuracy results using 100 features with degree=4 of 3 wavelet transforms: Haar level1, Db2 level1 and Db4 level2………...………...84 Figure 5.6 Accuracy results using 10 features with degree=2 for several wavelet transforms……….85 Figure 5.7 Accuracy results using 10 features with degree=3 for several wavelet transforms……….86 Figure 5.8 Accuracy results using 10 features with degree=4 for several wavelet transforms……….86 Figure 5.9 Comparing the classification accuracy between the largest 100 features and the largest 80 features of DB-2 and Haar wavelets from level 1 decomposition…..…...88 Figure 5.10 SVM classification of different wavelet decomposition features represented in percentage……….89 Figure 5.11 Close view on the highest classification accuracy using Exponential Degree values 2, 3 and 4………...91 Figure 5.12 Classification accuracy performance using 8-bit ROI images from different wavelet types ………...92 Figure 5.13 ROI 32 x 32 classification accuracy……….…93
ix
List of Tables
Table 2.1 Number of clusters and mammogram images containing
microcalcifications...13
Table 3.1 Thresholding percentage of different thresholding values between square and circle filters………...52
Table 5.1 Accuracy results from applying different number of features……….87
Table 5.2 Classification performance of best output values from this experiment……..90
Table 5.3 Classification accuracy percentage using 8-bit ROI images ………...92
Table 5.4 Actual classification accuracy of 32 x 32 ROI images………...93
Table 5.5 Actual classification accuracy of 64 x 64 ROI images………...94
Chapter 1
Introduction
1.1.
Breast Cancer and Mammography
Breast cancer is a potentially fatal disease that is growing in frequency in developed countries [1] and is becoming a major public health problem among women. Early detection of this disease can aid in decreasing the number of patients dying by 20% to 30% [2] because the earlier the detection is made, the better treatment works. Breast cancer is the result of abnormal cells that spread beyond the ducts or lobules, invading the surrounding tissue and lymph nodes or blood stream. Diagnosis can be done by several types of biopsy: fine needle aspiration cytology (with sensitivity of 90% - 95%); excision biopsy; frozen section biopsy; and by ultrasound; and mammography [3].
Using mammography is cheaper than biopsy methods and is the most reliable method for early detection of this disease. Mammography captures x-ray images of breasts which are then interpreted by radiologists to locate any abnormalities that may indicate cancerous changes. For several reasons including the different types of breast tissues, low contrast images, noise and the presence of other features, this can be a difficult job for a radiologist. Mistakes by radiologists might lead to the misinterpretation of abnormalities and result in patients dying. By providing an independent second opinion, Computer Aided Detection (CAD) or Computer Aided diagnosis (CADx) systems [4] could help radiologists in the early detection of breast cancer. These systems should be considered as supportive tools that provide
-radiologists with the potential ability to detect abnormalities earlier and faster. On the other hand, it is important for future studies to distinguish between computer-aided detection and computer-aided diagnosis systems. The latter CAD system could help radiologists to classify the abnormalities as benign or malignant, which would provide specificity [5].
Usually the mammogram process starts by taking an x-ray of the breast to generate a hard copy, to be handled by a radiologist. Then the mammogram is interpreted using a magnifier to examine different areas of the breast. This is due to the nature of some tumour types that are difficult to be seen by the human eye, as they could be less than 1 mm (i.e. microcalcifications); unlike other types of tumours such as masses. Depending on the expertise of the radiologist, she/he then could make a decision of what level of risk there is and what treatment is needed. If there is still uncertainty about the case, radiologists would then go through the biopsy procedure, a procedure which might cause anxiety to the patient. Therefore, by providing a computer system that could aid radiologists in interpreting and analysing a mammogram image, providing a second opinion, this could improve the chances of detecting and diagnosing tumours. However, the final decision is made by the radiologist regarding the possibility of the presence of a cancerous tumour.
The original x-ray film is converted to a digital copy that could be read by a computer under special applications designed for this specific purpose. Since there are several types of digital mammography computer aided systems, radiologists can get assistance in different ways. There are computer aided diagnosis systems that can analyse a mammogram to give a report of what sort of tumour is detected and in what category it is classified. There are computer aided detection systems that can
-help radiologists in locating any abnormal object. Or there are basic viewing and image enhancement systems that provide simple tools such as the ability to zoom in on a digital mammogram image, inverting between black and white on the image and increase/decrease the grey shades; so that a radiologist could have a clearer look of certain areas, or regions, of interest.
1.2.
Importance of this Work and Technical Challenges
Digital mammogram images are grey scale images which can be used to check for various breast abnormalities. Among these the main tumour type to be studied is microcalcifications, which are the smallest tumour types within the breast, with a size less than 1mm across [6, 7]. Therefore, digital mammography is an essential process to aid radiologists in studying and diagnosing mammogram images by giving them a tool that provides aid with the freedom of selecting certain areas that the radiologist is suspicious of. This process aims to provide radiologists with a second opinion in studying a mammogram case. Moreover, some of the methods that have been adopted are improved to be able to perform their tasks in different environments or to detect different types of abnormality (i.e. from detecting masses to microcalcifications).
In order to proceed, microcalcifications and other suspicious objects need to be segmented from the background. Since it is an essential step to locate and to take out these regions for detailed analyse and not spend unnecessary time analysing the background. This needs an efficient segmentation method that can detect potential microcalcification peaks. Thus, the use of special filters has been adopted for this purpose. The main problem that remains is to distinguish between true positives (i.e. microcalcifications) and false positives (i.e. other objects than microcalcifications or
-artefacts); as some of these artefacts share the same characteristics as microcalcifications in shape, size or pixel intensity. Further, it is crucial to keep in mind the false negative that represents microcalcifications that are not detected or considered as artefact or noise. This has to be considered by configuring the thresholding parameters to match their characteristics. Moreover, to test the detection against true positive and false positive, regions of interest are cropped prior to the segmentation stage into two sets. Each set enclosing images that contain cases with microcalcifications and images with normal breast tissue. The first set includes regions of interest that represent clusters of microcalcifications and the second set represents individual microcalcification.
It is important to find some unique features that correspond to the microcalcification characteristics. These features would be the key to distinguish such an abnormality from a normal breast tissue that contains other objects than microcalcification. These features then will be needed to classify segmented regions into two classes, normal or abnormal. It is of crucial importance to apply a classification method in such a way to be able to distinguish and obtain a high level of classification accuracy between normal breast tissue and regions that contain microcalcifications, as well as maintaining the false positive at its minimum level, since the segmentation process will help in locating microcalcifications and any suspicious objects within a cropped region of interest. Therefore, yet again a classification process is needed to distinguish between regions of interest that contain microcalcifications and those that do not.
-1.3.
Aims and Objectives of the Research
The main reason for the work presented in this thesis is to assist future development of the diagnostic uses of digital mammography. This is done by creating a concept CAD system that is able to perform detection for suspicious objects within images of regions of interest and then to be able to distinguish between normal and abnormal objects detected. By investigating how such a problem could be solved, combinations of methods and algorithms are modified and improved to achieve high classification accuracy results in short times. This could potentially provide assistance to radiologists interpreting mammograms by providing a second opinion that would draw the attention of the radiologist to some areas that are missed or to confirm what the radiologist already suspected.
Therefore, to sum up the main objectives of this thesis:
x Presenting the use of different region of interest image sizes (areas show cluster of microcalcifications that depends on the cluster size and areas showing individual microcalcification); this is to be run under the same process.
x To present modified thresholding filters, to locate abnormality of microcalcifications types, that could be applied to regions of interest in images provided by radiologists or cropped from a full mammogram image.
x Proposing the use of wavelet transform for feature extraction; this is by investigating different wavelet types and number of features.
x Plan of using support vector machines to distinguish and categorise between normal and abnormal breast tissue regions.
Basically, a mammographic based diagnosis system is divided into three main stages. The first stage is the localisation of potential microcalcifications and other suspicious
-objects, the second stage is feature extraction which is used to identify the information from within segmented regions and finally the classification stage will process the extracted features and offer diagnostic decisions.
In other words, to define the main problems in this study they could be summarized by the following points:
x The low contrast between calcifications and surrounding tissue. When the surrounding tissues have similar or higher intensity calcifications are difficult to detect.
x The unpredictable shape, size and location of calcifications; even when found in the same cluster, are slightly different. Breast structures such as blood vessels or milk ducts and clatter, none of which are related to abnormalities, frequently have similar characteristics to calcifications. This can result in false positive detections which may cause patients unnecessary anxiety.
x To be able to provide a proper diagnosis for a mammogram, that will aid radiologists in this task; a huge number of samples that contain a variety of abnormalities need to be trained in such systems.
1.4.
Outlines of the Thesis
The remainder of the thesis is composed of five chapters. Chapter two presents a literature review of various existing methods from the research area of digital mammography. This chapter includes three main sections which cover previous research on segmentation, feature extraction and classification.
The particular implementations of the proposed system are discussed in chapters three, four and five. Chapter three includes work on segmentation including the thresholding techniques applied and the application to different sizes of regions of
-interest. Chapter four includes work on feature extraction using the discrete wavelet transform, applied to the segmented images. A set of features can represent a full image or a small region of an image. The quality of the extracted features depends on the degree to which they can accurately represent the region and discriminate between the different classes. Chapter five includes the work done using the features as input to a machine learning process to classify the normal and abnormal cases. The conclusion and suggestions for future work are presented in Chapter Six.
8
-References:
1. Bird, R.E., Wallace, T.W., and Yankaskas, B.C., Analysis of cancers missed at screening mammography. Radiology, 1992. 184(3): pp. 613-617.
2. Coakley, K., Quintarelli, F., Doorn, T.v., and Hirst, C., Classification of Equivocal Mammograms through Digital Analysis. The breast, 1994. 3(4): pp. 222-226.
3. Breast Cancer Manual, in Dr. Soliman Fakeeh Hospital: Jeddah, K.S.A. 4. Yusof, N.M., Isa, N.A.M., and Sakim, H.A.M., Computer-Aided Detection
and Diagnosis for Microcalcifications in Mammogram: A Review.
International Journal of Computer Science and Network Security, 2007. 7(6): pp. 202-208.
5. Lo, J.Y., Gavrielides, M.A., Markey, M.K., and Jesneck, J.L. Computer-aided classification of breast microcalcification clusters: merging of features from image processing and radiologists. in Proceedings of the SPIE on Medical Imaging 2003: Image Processing. 2003. San Diego, CA, USA.
6. Bocchi, L. and Nori, J., Shape analysis of microcalcifications using Radon transform. Medical Engineering and Physics, 2007. 29(6): pp. 691-698.
7. Sheshadri, H.S. and Kandaswamy, A., Computer Aided Diagnosis of Digital Mammograms. Information Technology Journal, 2006. 5(2): pp. 342-346.
Chapter 2
Literature Survey
2.1. Introduction
In this chapter, we take a closer look at how the literature survey has covered a variety of significant studies in digital mammography at different levels of image processing namely: segmentation, feature extraction and classification. Some of these studies are selected as benchmarks or include methods and algorithms that have been modified and applied in this research. Each study has obtained a certain mammographic database for different purposes. Some studies have applied their methods on more than one database while most of them utilised only one. Several studies that have been mentioned in this chapter and their methods applied to the same mammographic database that has been used in this research as well. This makes it possible to compare results from the authors’ research study with other studies. Also an overview of mammogram abnormalities, presented in this chapter, investigates the characteristics described in other studies, to help this research study handle these abnormalities.
The rest of this chapter is organised as follows. A description of the MIAS mammography database used in the current work is provided in Section 2.2 with an overview of the characteristics of different types of breast abnormalities in Section 2.3. Section 2.4 surveys studies related to segmentation methods that have been applied in the mammography area. In Section 2.5 various feature extraction techniques from other studies are shown. Then machine learning and classification
-studies and their results from other -studies are presented in Section 2.7. Section 2.7 is a short summary.
2.2. Mammography Database
Selecting a benchmark database makes it easier to compare results obtained with those from other studies. For that reason, the images that have been used in the present work are the full size images from the Mammographic Image Analysis Society (MIAS) database [1]. This database is one of two popular mammography databases available in the field of digital mammography; the other is the Digital Database of Screening Mammography (DDSM). Moreover, there are other mammography databases available but rarely used such as the Nijmegen database and the Lawrence Livermore National Laboratories (LLNL) database.
MIAS is an organization of UK research groups interested in promoting an understanding of mammograms. The database contains left and right breast images for 161 patients. It contains different types of abnormalities including the type that this study is interested in, microcalcifications. Each individual image is accompanied by information, which includes the breast type and the abnormality type and location. The location of an abnormality is specified using three variables: the x and y coordinates of a point and the radius of a circle centred on the point. This database is very helpful as expert radiologists have manually determined centres and radii appropriate to enclose whole clusters of microcalcifications. The mammogram images are available in four sizes: small (4320 x 1600), medium (4320 x 2048), large (4320 x 2600) and extra large (4000 x 5200). The largest mammogram image comprises about 21 MB of disk space. The mammogram images are digitized with a special resolution of 50m x 50m and 8 bit grey depth. This database contains 320
-mammogram images and a database manual provides descriptive information about the individual images. The images are divided into categories according to the type of the lesion, the severity of the abnormality, and the type of the background breast tissue.
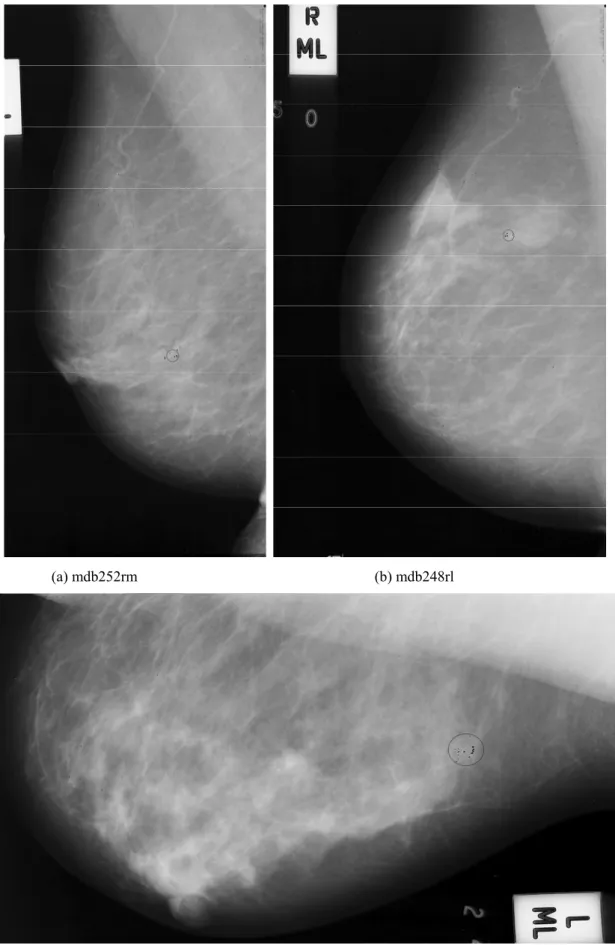
The first category, lesion type, is divided into 7 main subcategories: Normal (NORM), Architectural distortion (ARCH), Asymmetry (ASYM), Microcalcification (CALC), Circumscribed masses (CIRC), Ill-defined masses (MISC), and Spiculated lesions (SPIC). The second category, severity of abnormality, is divided into 2 main subclasses: Benign and Malignant. The third category, background tissue, is divided into 3 main subclasses: Fatty, Fatty-glandular, and Dense-glandular. In Figure 2.2 below a sample from the MIAS manual containing seven columns of information, is shown. The first column is the name of the mammogram case image where the last two letters from the name represent either left breast ‘l’ or right breast ‘r’ and the other letter is the size of the mammogram image (i.e. large ‘l’, medium ‘m’ and small ‘s’). The second column is the type of the breast tissue as mentioned before (i.e. Fatty ‘F’, Fatty-Glandular ‘G’ and Dense-Glandular ‘D’). The third column is the lesion type and the fourth column is the severity of abnormality. Finally, the last three columns represent the location of abnormalities using x-coordinates, y-coordinates and radius of a circle containing the abnormality.
-Figure 2.2 MIAS manual of calcifications and normal cases
2.2.1 Analysis of the MIAS Database
A total of 25 mammogram digital images containing microcalcifications exist in the MIAS database. The MIAS manual indicates that 20 mammograms have been annotated by expert radiologists with circles surrounding clusters of microcalcifications. In addition, there are 3 mammograms that have not been marked, because the microcalcifications are distributed over most of the breast region rather than concentrated at discrete locations. There are also 2 mammogram images that have not been marked but nevertheless contain microcalcifications in unspecified areas. It is noted that, by taking region of interests (ROI) from the 20 mammograms that have been expertly marked, 25 clusters of microcalcifications are produced. While most of the mammogram images contain just one microcalcification
-cluster, a few of other mammograms contain more than one cluster. The multi-cluster image cases are as follows:
x mdb223ls with 2 clusters
x mdb226rm with 3 clusters
x mdb239ll with 2 clusters
x mdb249ls with 2 clusters
Table 2.1 specifies the numbers of benign and malignant clusters and the numbers of corresponding images according to the database manual.
Table 2.1 Number of clusters and mammogram images containing microcalcifications
Benign Malignant Total
Mammogram Images 10 10 20
Cluster of MCs (ROI) 13 12 25
2.2.2 The Characteristics of Breast Abnormalities
The characteristics of breast tissues can differ from woman to woman. Therefore, any abnormalities present can also show different features. Abnormalities that are detected in regions of interest (ROI) defined within the breast are divided into two main types: Benign and Malignant. Abnormalities are also divided into several types as mentioned before: ARCH, ASYM, CALC, CIRC, MISC, and SPIC. However, regarding the microcalcifications type as it is the smallest among the rest of tumour types it should be considered according to well-established characteristics: shape - size - density - number - distribution.
-2.2.3. Microcalcifications
Basically, microcalcifications are tiny specks of calcium usually less than 1mm in size and between 0.1 and 0.7 mm in diameter [2]. Microcalcifications sometimes have subtle appearance with hazy borders [3]. However, most studies in the area of mammography agree on describing them showing as bright white spots against the darker background of a mammogram [4] [5].
One of the important characteristics of microcalcifications is that they group into clusters. However, microcalcification clusters are defined differently in several papers. Microcalcification clusters are defined as usually at least 3 microcalcifications within a 1 cm2 region of a mammogram [3]. A cluster is considered detected if 2 or more microcalcifications are found within the true circle defined by an expert [6]. Gulsrud and Husoy in [7] considered a cluster is to be detected if at least one microcalcification is found within the associated ground truth circle. Furthermore, classifying a mammogram that includes a cluster of microcalcifications is more challenging than doing the same with masses because of their unpredictable shapes, size, density and texture. Subsequently, microcalcifications are divided into two types: benign and malignant [8] as described in the following two sub-sections.
2.2.3.1. Benign Microcalcifications
A benign microcalcification cluster has a smaller number of components than a malignant type, with smaller and rounder shapes. Benign microcalcifications are uniform in size and shape and usually appear as coarse, round or oval shapes. Benign calcifications are homogeneous and have high-density [9]. Their distribution patterns
-tend to be scattered or diffuse [10]. Figure 2.3 shows examples of benign microcalcifications of different shapes and sizes.
Figure 2.3 Images of 1mm x 1mm vignettes containing individual MCs from benign clusters [11]
2.2.3.2. Malignant Microcalcifications
Malignant microcalcifications within a cluster have a wider variation of sizes compared to the benign type. Also malignant microcalcifications display irregular shapes with a low-density and inhomogeneous appearance [9]. Furthermore, individual malignant microcalcification vary in size and shape, they might appear as microscopic and fine, linear branching or stellate-shapes. Moreover, their distribution pattern is grouped or clustered, and they are innumerable [10].
Malignant microcalcifications are rarely circular in shape and they exhibit sharp increases and decreases in intensity [5]. Figure 2.4 shows examples of malignant microcalcifications of different shapes and sizes.
-Figure 2.4 Images of 1 mm x 1 mm vignettes containing individual MCs from malignant clusters [11]
2.2.4. Masses
Masses are larger than microcalcifications and are divided similarly into two main types: benign and malignant. Each has characteristics that may help to identify it when detection is attempted. The size of mass lesions considered varies with the study. Cheng and Cui in [4] defined mass lesion sizes vary from 1mm to several centimetres Rafayah et al. in [10] divided masses into three sizes: Small (3–15 mm), Medium (15–30 mm), Large (30–50 mm), but the latter case is rare.
Compared with microcalcifications, mass lesions are not only larger but can be of different types and shapes which varies from circumscribed to speculate. Circumscribed mass lesions have relatively well-defined, smooth boundaries, while speculated mass lesions have speculated margins [4]. The benign masses are usually rounded and low-density with smooth, sharply defined margins. On the other hand, malignant masses usually are high-density, stellate, speculated with poorly defined margins [10].
-2.3. Segmentation of Microcalcification Regions
Arodez et al. [5] proposed a filter design is applied in small field mammography that is sensitive to the typical appearance of individual microcalcifications and detects regions of interest. Small field digital mammograms often contain salt and pepper noise and this method takes this into account. The system works by detecting microcalcifications in two phases and then enhances the contrast of the results. The detection of individual microcalcification in the first phase is done by designing a filter with a value that has a response to the difference of average intensity within the microcalcification and the average intensity outside its borders. The second phase which groups the microcalcifications into clusters, also comprises two parts; first noise removal over the whole mammogram which compares the intensity between pixels by applying median filter and a threshold keeping the isolated pixels only, that represent noise, and then a morphological area opening is applied to remove these isolated pixels. In the second part a discrete wavelet transform is applied to enhance the mammogram image contrast so that microcalcifications are much clearer. This is done by calculating Daubechies wavelets of order 4 and level 5 for the image and using only the 5 sets of the details coefficients with zero for the approximation coefficient before applying the inverse wavelet transform. After detection, a comparison was made with results obtained using the Amira [12] visualisation package to confirm that both results provided similar detected regions of interest for a group of microcalcifications or to connect isolated microcalcification to the rest of the group. This is an interactive evaluation tool which provides a variety of tools to assist in processing 2D and 3D images and specifically microcalcifications are detected using the isolines visualisation technique. This tool is used on the ROI from
-the previous step. The isolines technique is used for evaluating microcalcification clusters since it connects pixels with the same brightness as illustrated in Figure 2.1.
Figure 2.1 Isolines implementation for pixels with similar brightness
The classification method is based on two classification techniques: first the mammogram is classified according to Wolfe breast parenchymal patterns [13]; this classification technique has four categories based on the breast density as an indicator of future cancer risk, they are: primarily fatty 2% (lowest risk), prominent ducts <=25% (low risk), prominent ducts >25% (high risk) and dense fibro-glandular tissue 45% (highest risk). The second classification is based on LeGal classification types for microcalcifications clusters [14], which defines five categories based on the degree of the malignancy.
Melloul and Joskowicz [15] introduced a segmentation method using entropy thresholding. Basically, the method consists of two steps, the first is removing the background tissue, using a multiscale morphological opening operation (morphological top-hat filter). Filtering is performed using a kernel and also changing its size to perform multi-scaling. The kernel is given a size varying from
-smallest to largest for each microcalcification. The second is applying the entropy thresholding based on a third-order spatial grey-level dependence matrix to detect individual microcalcifications. This is done using third-order space mean. The threshold that has been used is the one that separates between the background and microcalcifications that have the maximum sum of entropies. This was applied on the Mini-MIAS database achieving a mean detection rate of 93.75% for true positives and 6.25% for false positives with 2% false negatives. The results were evaluated and confirmed by radiologists..
Diyana et al. [16] investigated three methods for detecting microcalcifications in mammogram images from the mini-MIAS database and made comparisons of performances and processing times. The algorithms used in this study included a morphological approach, a fractal approach and a high order statistical approach. Prior to applying these methods, a pre-processing stage was performed to extract the breast region from the background using block region growing. The detection algorithms were then applied. The morphological approach implemented opening and P-tile thresholding methods; that is erosion and dilation processes are applied on the same image in order to separate the microcalcifications from the breast tissue. The second fractal method applied divides the image into regions of size 8 × 8 believed to be suitable for the detection of microcalcification size features and then implements the fractal model on each region. The third high-order-statistical approach applied is based on the characteristic that microcalcifications are bright spots compared with neighbouring pixels. Thus, local intensity maxima are detected and ranked according to a high order statistical test performed over sub-bands obtained from an adaptive wavelet transform. After comparing the results from the
-three methods it was found that the morphological approach produced the best results with 74% true positives in 3.20 minutes.
Sentelle et al. [17] investigated a rapid, multi-resolution-based approach combined with wavelet analysis to provide an accurate segmentation of possible microcalcifications. This approach was implemented on 25 images obtained from the Digital Database for Screening Mammography (DDSM). An initial multi-resolution approach to fuzzy c-means (FCM) segmentation was employed to quickly distinguish medically significant tissues. Tissue areas chosen for high-resolution analysis were later divided into multiple windows. Each window, wavelet analysis was employed to generate a contrast image, and a local FCM segmentation generated an estimation of the local intensity. A simple two-rule fuzzy system is applied combining intensity and contrast information to derive fuzzy memberships of pixels in the high-contrast, bright pixel class. A double threshold was finally applied to the fuzzy membership to detect and segment microcalcifications.
Stojic et al. [18] applied a method for detecting small-sized brighter regions in mammogram images from the mini-MIAS database, based on an adaptive multi-fractal approach for segmentation and visualization of microcalcifications. Cropping images manually into suspicious regions of sizes 128 × 128 or 256 × 256 pixels was the first step in the application of their method. This study considered two cases, one of them marked as an easy case for radiologists and the other as a hard case. For the former case it was reported that the tissue is radiology sparse and microcalcifications are visible even to a less-skilled radiologist; by contrast in the latter case the breast tissue is very dense causing very poor contrast between abnormality and surrounding tissue making microcalcifications extremely difficult to detect even by a skilled radiologist. In their study they ascribed several characteristics to microcalcifications.
-Basically microcalcifications are small brighter local tissue anomalies in mammograms not belonging to background tissue. From the geometrical interpretation, they are seen as singular sets of points. From the multifractal standpoint they are characterizes by both high and low values as they represent sharp local changes and rare events.
Hadhoud et al. in [19] used wavelet decomposition as an enhancement method to remove noise from the mammogram images. An orthogonal wavelet was used to remove redundancy in the information that is represented by the wavelet coefficients; at the same time it provides a corrected reconstruction of the original image. It starts by applying a (unspecified) Daubechies family wavelet decomposition. Then a soft-threshold is applied that involves setting detail coefficients whose absolute values are lower than the threshold to zero and then scaling nonzero coefficients to zero. This eliminates the discontinuity that is inherent in a hard-threshold. The threshold is computed using local statistics from the original mammogram including mean intensity, standard deviation, median value, and minimum value. After thresholding, reconstruction is performed using the original approximation coefficients and the modified detail coefficients.
2.4. Extraction of Features for the Classification of Breast Tissue
Wavelet decomposition was applied in a previous study by Ferreira and Borges in [20] using the mini-MIAS database. Using ‘Haar’ and ‘DB4’ wavelets, it was found that extracting the 100 wavelet coefficients largest in magnitude from the approximation included enough wavelet features to represent brighter abnormal objects. Classification of tumour nature (i.e. normal, benign, and malignant) was based on the Euclidean distance. Performances of 83.3% for malignant and 94.4%
-for normal tissue were achieved using Haar wavelets with corresponding values of 88.8% and 72.2% using DB4 wavelets.
Sheshadri and Kandaswamy investigated in [21] the extraction of statistical features for the classification of the breast tissue in mini-MIAS mammograms. The classification accuracy for breast tissue of this algorithm is nearly 80% and the results have been inspected and validated by an expert radiologist. The results show the appearance of abnormalities in high density breast tissue. Therefore, the extraction of statistical features for the classification of breast tissue should be investigated further. The algorithm classifies the pixels from the input image into either interior or boundary pixels; the interior pixels include the interior parts of texture regions. Then segmentation is performed by applying region growing to the interior pixels. Basically the classification is based on the values of the texture parameters which are: Average intensity, Average contrast, Smoothness, Third moment, Uniformity and Entropy; and also on the standard parameters defined for image histograms by ACR-BIRADS (American College of Radiology-Breast imaging and Reporting Data Systems). The six statistical features that are used are mean, standard deviation, smoothness, third moment, uniformity, and entropy. Gulsrud and Husoy investigated in [7], a method applied to mammograms from the mini-MIAS database which is based on the extraction of texture features. Their detection rate was 1.5% false positives and about 95% true positives. The extracted features are used to differentiate between textures that include microcalcification clusters and normal tissue. The method employs a single filter whose design is optimized with respect to the Fisher criterion [22]. The Fisher criterion uses mean and variance to achieve good feature separation and provides a smoothing parameter
-to be tuned. The tuning of this parameter -to optimize the filter requires two sub-images, one with normal tissue and one with clusters of microcalcifications.
2.5. Classification
The method of Sheshadri and Kandaswamy in [3] reaches a true positive detection rate of 100% with a rate of only 1.5% false positive clusters per image from the mini-MIAS database. For the classification of detected clusters as benign or malignant, their CAD system achieved an overall performance rate of about 75%. Basically, this was achieved by manually cropping regions of interest (ROI) from the mammograms and processing these parts only rather than the whole mammogram. After cropping ROIs, feature extraction is applied for segmentation purposes to divide the region into normal tissue or clusters of microcalcifications. Texture feature extraction methods are then applied to differentiate between benign and malignant clusters of microcalcifications. These methods use digital filters with a filter response energy measure that is based on spatial grey level co-occurrence matrices (i.e. second order statistical measures of image variation).
Yu et al. in [23] applied a wavelet filter and a Markov random field (MRF) in order to detect microcalcification clusters in mammogram images. The MRF has been utilized in various image processing application related to texture modelling and discrimination. The MRF is a well-known class of parametric image model whose importance deals with a large number of spatial interaction phenomena which can be statistically described by MRFs. In this study 20 mammogram images from the mini-MIAS database were used. First the detection of suspicious regions is based on grey levels in the MIAS database in the range of 175 – 226 grey levels and sizes of microcalcification clusters varying from 6 to as many as 87 pixels. In order to extract
-these features from the breast background, a wavelet filter is applied since microcalcification clusters have high contrast with respect to their neighbours as well as containing high frequency components. Then a threshold of the mean pixel value is applied that is set to 10 in order to detect the suspicious regions. In the next stage feature extraction is applied using the least-squares-error Markov random field method proposed by Derin et al. [24] in order to identify the texture of the microcalcifications. Edge density is found to be a good feature for discriminating microcalcification clusters from normal regions. For the classification stage, two classifiers were implemented: Bayes and Back Propagation Neural Network (BPNN). The Bayes classifier is a statistical classifier, which is designed to minimize the error when discriminating between classes. On the other hand, the BPNN can achieve lower False Positives rates than Bayes classifiers. As a result, the algorithm performance reached a sensitivity of 92% with an average of 0.75 false positives per image.
Papadopoulos et al. in [25] proposed a system that consists of three stages: (1) Detection of microcalcifications clusters; (2) Feature extraction from the clusters; (3) Classification. It is based on a hybrid intelligent system combining rule-based, artificial neural networks (ANNs) and support vector machines (SVMs) with Gaussian kernel function methods. This study applied the proposed algorithm on two datasets for comparison. Using the Nijmegen database, the correct characterization of 44 (52%) malignant clusters and the false characterization of 2 (5.8%) benign clusters was achieved. Using the MIAS database, the correct characterization of 11 (61%) malignant clusters and the false classification of 1 (7.6%) benign clusters was achieved. To summarise, the final results were: a classification rate of 81% for the Nijmegen dataset and 83% for the MIAS dataset.
-Songyang and Ling in [26] proposed an algorithm to detect the microcalcification in mammogram images based on wavelet features and neural networks. They utilized median contrast and normalised grey level features obtained by applying the fourth-level Daubechies-orthogonal wavelet transformation to train a feed-forward NN classifier to trace the likelihood map that shows the possibility of the input values being a microcalcification. The resulting algorithm was successful in detecting 94% of the mean true positives at a cost of one false positive per image and 90% of the mean true positives at a cost of 0.5 false positive per image.
Rafayah et al. in [10] proposed a computer-aided-diagnosis algorithm using a wavelet analysis and fuzzy–neural approach for detecting the microcalcification in mammogram images. Horizontal, diagonal and vertical detail coefficients from a wavelet decomposition of the image coefficients were extracted for feature vectors. Normalization of the coefficients, energy and feature reductions were carried out. Two classifiers were generated: one processing globally using Neuro-fuzzy classifier using 100 coefficients and the other processing locally on cropped ROIs using 35 coefficients. The classification between normal and abnormal category using 100 coefficients achieved a classification average of 81.4% while classification between benign and malignant calcifications achieved a classification average of 87.5% using the 35 coefficients.
Cheng et al. [27] suggested the use of Fuzzy logic and scale space approaches. The first stage of the procedure was to apply a fuzzy-based image enhancement. The regions of interest in each image were manually located as rectangular sub-images that contain a maximum number of microcalcifications. The Laplacian of Gaussian (LoG) filter is then applied on the enhanced images to detect microcalcification clusters. The final result of this study was very effective in locating
-microcalcifications achieving a true positive rate of 90% with a false positive rate of 1%. This study was applied on images that are obtained from the Nijmegen database of mammography.
2.6. Summary
The reported previous studies mentioned above have achieved valuable results using several techniques and methods. Moreover, a number of these studies have combined more than one machine learning technique such as neural networks and support vector machines in order to classify between several classes of tumour or to distinguish between microcalcifications and other suspicious objects. This is likely to need a huge computational effort and time consuming training and testing of data. Furthermore, the majority of these studies have utilised the mini-MIAS database to investigate their methods, rather than the MIAS database of original size images which has the advantage of higher resolution with the microcalcifications clearer to study besides other mammographic databases such as Nijmegen and DDSM. In a number of the studies that have been mentioned above the wavelet transform has been used in various ways such as for image enhancement, image segmentation and feature extraction in a few. Most of these studies have included the detailed coefficients, which include the horizontal, diagonal and vertical coefficients, but a few studies have utilised only the approximation coefficients that represent reduced resolution images. Moreover, a limited number of wavelet types have been investigated, mainly the Haar wavelet and the Daubechies wavelet from order 2 and 4. Since few studies have used the wavelet transform for feature extractions most other studies mainly focus on using statistical features combined with a machine learning technique as mentioned in the previous reported studies. These studies
-achieved not more than 95% of microcalcification detection and 94% of classification.
However, the work that has been presented in this study did manage to tackle most of these problems in order to achieve a high accuracy of classification using direct methods and techniques. In Chapter 3, a segmentation technique that has been adapted from [28] has been modified from detecting masses to detecting microcalcifications using only the mean pixel values to compare between a central area and its surroundings. This is done on cropped regions of interest (ROI) from different sizes that represent clusters of microcalcifications and individual microcalcification using the original MIAS database of mammography. Then in Chapter 4, the wavelet transform has been utilised at this stage for feature extraction using only the approximation coefficients. This scheme was adapted from [20] and modified to extract features from black and white images that are thresholded instead of grey scale images. Thus, the feature extraction method was applied on cropped ROI from the original MIAS instead of the mini-MIAS. In addition, there are six different wavelet types that have been investigated from levels 1 and 2 of decomposition. Chapter 5 explains the process of a classification method based on the wavelet transform features using support vector machine (SVM) that has been adapted from different areas of study [29, 30] and modified to suit this area of research. This process investigates the classification between normal breast tissue and abnormal areas that may contain microcalcifications.
-References:
1. Mammographic Image Analysis Society. [cited 2005 october]; Available from: http://www.wiau.man.ac.uk/services/MIAS/MIASweb.html.
2. Bocchi, L. and Nori, J., Shape analysis of microcalcifications using Radon transform. Medical Engineering & Physics, 2007. 29(6): pp. 691-698.
3. Sheshadri, H.S. and Kandaswamy, A., Computer Aided Diagnosis of Digital Mammograms. Information Technology Journal, 2006. 5(2): pp. 342-346. 4. Cheng, H.D. and Cui, M., Mass lesion detection with a fuzzy neural network.
Pattern Recognition, 2004. 37(6): pp. 1189-1200.
5. Arodz, T., Kurdziel, M., Popiela, T.J., Sevre, E.O.D., and Yuen, D.A.,
Detection of clustered microcalcifications in small field digital mammography. Computer Methods and Programs in Biomedicine, 2006.
81(1): pp. 56-65.
6. Strickland, R.N. and Hahn, T., Wavelet transform for detecting microcalcifications in mammograms. IEEE Transactions on Medical Imaging, 1996. 15(2): pp. 218-229.
7. Gulsrud, T.O. and Husoy, J.H., Optimal filter-based detection of microcalcifications. Biomedical Engineering, IEEE Transactions on, 2001.
48(11): pp. 1272-1281.
8. Liyang, W., Yongyi, Y., Nishikawa, R.M., and Yulei, J., A study on several Machine-learning methods for classification of Malignant and benign clustered microcalcifications. Medical Imaging, IEEE Transactions on, 2005.
24(3): pp. 371-380.
9. Frigas, A.N. Microcalcifications resource site. 2009 [cited 2009 october]; Available from: http://www.infoacademy.gr/microcalc/.
10. Rafayah, M., Qutaishat, M., and Abdallah, M., Breast cancer diagnosis system based on wavelet analysis and fuzzy-neural. Expert Systems with Applications, 2005. 28(4): pp. 713-723.
11. Rogova, G.L. and Stomper, P.C., Information fusion approach to microcalcification characterization. Information Fusion, 2002. 3(2): pp. 91-102.
12. Mercury computer system Inc. Advanced 3D Visualisation and Volume Modelling. [cited 2006 March]; Available from: www.amiravis.com.
-13. Wolfe, J., Breast parenchymal patterns and their changes with age.
Radiology, 1976. 121(3): pp. 545-552.
14. LeGal, M. and Ghavanne, G., Valeur diagnostique des microcalcification groupees decouvertes par mammographies. Bulletin du cancer, 1984. 71: pp. 57-64.
15. Melloul, M. and Joskowicz, L. Segmentation of microcalcifications in X-ray mammograms using entropy thresholding. in Proceeding of the 16th International Congress on Computer-Assisted Radiology and Surgery. 2002. 16. Diyana, W.M., Larcher, J., and Besar, R., A comparison of clustered
microcalcifications automated detection methods in digital mammogram.
Proceedings of IEEE International Conference on Acoustics, Speech, and Signal Processing, 2003. 2: pp. 385-388.
17. Sentelle, S., Sentelle, C., and Sutton, M.A., Multiresolution-Based Segmentation of Calcifications for the Early Detection of Breast Cancer.
Real-Time Imaging, 2002. 8(3): pp. 237-252.
18. Stojic, T., Reljin, I., and Reljin, B., Adaptation of multifractal analysis to segmentation of microcalcifications in digital mammograms. Physica A: Statistical Mechanics and its Applications, 2006. 367: pp. 494-508.
19. Hadhoud, M., Amin, M., and Dabbour, W., Detection of Breast Cancer Tumor Algorithm using Mathematical Morphology and Wavelet Analysis.
Proceeding of the first ICGST International Conference on Graphics, Vision and Image Processing, 2005. 5: pp. 75-80.
20. Ferreira, C.B.R. and Borges, D.L., Analysis of mammogram classification using a wavelet transform decomposition. Pattern Recognition Letters, 2003.
24(7): pp. 973-982.
21. Sheshadri, H.S. and Kandaswamy, A., Experimental investigation on breast tissue classification based on statistical feature extraction of mammograms.
Computerized Medical Imaging and Graphics, 2007. 31(1): pp. 46-48.
22. Fukunaga, K., Introduction to statistical pattern recognition (2nd ed.). 1990, San Diego, CA, USA: Academic Press Professional, Inc. 592.
23. Yu, S.N., Li, K.Y., and Huang, Y.K., Detection of microcalcifications in digital mammograms using wavelet filter and Markov random field model.
Computerized Medical Imaging and Graphics, 2006. 30(3): pp. 163-173.
30
-24. Derin, H., Elliot, H., and Kuang, J. A new approach to parameter estimations for Gibbs random fields. in Proceedings of IEEE international conference acoustics, speech, and signal processing. 1985. Tampa, FL.
25. Papadopoulos, A., Fotiadis, D.I., and Likas, A., Characterization of clustered microcalcifications in digitized mammograms using neural networks and support vector machines. Artificial Intelligence in Medicine, 2005. 34(2): pp. 141-150.
26. Songyang, Y. and Ling, G., A CAD system for the automatic detection of clustered microcalcifications in digitized mammogram films. Medical Imaging, IEEE Transactions on, 2000. 19(2): pp. 115-126.
27. Cheng, H.D., Wang, J., and Shi, X., Microcalcification detection using fuzzy logic and scale space approaches. Pattern Recognition, 2004. 37(2): pp. 363-375.
28. Kom, G., Tiedeu, A., and Tiedeu, M., Automated detection of masses in mammograms by local adaptive thresholding. Computers in Biology and Medicine, 2007. 37(1): pp. 37-48.
29. Qahwaji, R. and Colak, T., Automatic Short-Term Solar Flare Predection Using Machine Learning and Sunspot Associations. Solar Physics, 2007.
241(1): pp. 195-211.
30. Colak, T. and Qahwaji, R., Automated Prediction of Solar Flares Using Neural Networks and Sunspots Associations. Advances in Soft Computing, 2007. 39: pp. 316-324.
Chapter 3
Microcalcifications Segmentation
3.1.
Introduction
Segmentation in computer vision is the term used for partitioning an image into multiple non overlapping regions. Often, these regions are divided into two classes, foreground regions of interest and the remaining background region. In the field of mammography the process of segmentation is used at different stages to separate the breast region from the non-breast region, to remove labels from the image and to separate abnormal breast tissue from normal breast tissue [1-5]. These have been applied in previous studies as discussed in the previous chapter, while in this chapter we focus on applying a direct method of segmentation to a region of interest within an image. This is to eliminate the background breast tissue and keep only suspicious objects or potential microcalcification in the current case. Applying such a method on ROI images that hold normal and abnormal breast tissue would help in the following step of features extraction. This process is performed to locate suspicious objects within an ROI image and specifically microcalcifications. However, these regions still need to be differentiated to assist radiologists in the final diagnosis. This technique basically applies a filter on an image to be scanned to compare a middle area with its surroundings. Thus, there will not be any additional preceding steps for enhancement as image pre-processing.
This chapter is organised as follows. Section 2 outlines the selection of data for the subsequent analysis steps. Section 3 presents a segmentation method involving the
-design of detection filters to separate the foreground “microcalcifications” from the background “breast tissue”. This section is divided into two subsections describing the implementations of square and circular filters. Section 4 summarises the chapter with examples of the results that have been obtained from the experiments.
3.2.
Regions of Interest (ROI)
Regions of interest are the parts of the mammograms where radiologists find abnormalities in the breast tissue such as microcalcifications and masses. However, finding these regions automatically is not easy given that these abnormalities are small in size and may have similar contrast and brightness to neighbouring regions of the breast tissue, making them difficult to spot with the human eye.
In this research we look at how using cropped regions of interest reduces the time spent on the experiments compared with processing full sized mammograms, as well as focusing the analysis on regions of interest, cropped manually, which contain suspicious objects that need to be studied; rather than getting complex features from all over the mammogram image as well as reducing the number of false positives. The idea of processing a full mammogram image, covering all the possibilities that can be identified, analyzing and storing, then awaiting confirmation by the radiologists can be highly beneficial for such systems. However, such methods consequently replace the radiologist's opinions in selecting and analyzing suspicious regions from the original images. Clinically, digital mammography is only considered as a second opinion and complementary to the decisions of the radiologists.
This experiment has used the full MIAS database. In particular, 20 digital mammogram images that contain microcalcifications and 50 other digital
-mammogram images that contain normal, cancer free, breast tissue have been used for this study.
The sizes chosen for the cropped regions are powers of two since this is compatible with the usual wavelet transform processing which reduces the width and height of the image by half at each level. This will be explained later in Section 4.2 on the discrete wavelet transform.
Two sets of cropped regions of interest were produced. The first set was cropped manually and have different sizes to suit the sizes of a single cluster of microcalcifications, as highlighted in the MIAS database, and include: eight images of size of 128 × 128, nine images of size 256 × 256, seven images of size 512 × 512 and one image of size 1024 × 1024. There are 25 regions of interest containing clusters of microcalcifications and 50 regions of interest containing normal tissue. The normal ROI images have the same sizes as the abnormal ROI images.
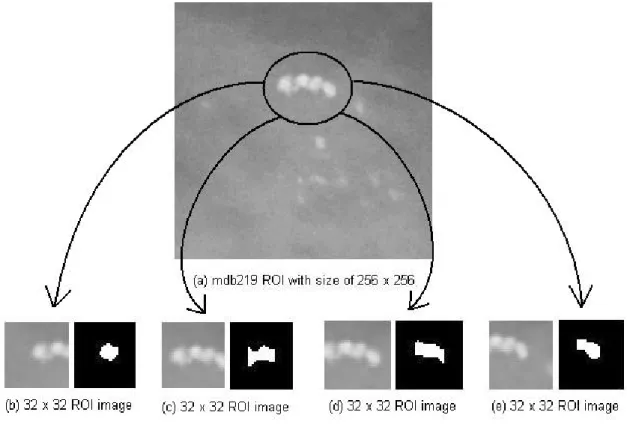
The second set of cropped ROI images of size 32 × 32 include individual microcalcification and were acquired from previous studies in [6] and [7]. This is done by applying two filters, one inside the other, using a size of 9 × 9 for the inner mask and 13 × 13 for the outer mask. The average intensity of the inner area of the central area should be greater than other neighbours. As well as the average of the inner filter should be greater than the surrounding area. This is to increase the possibility of detected potential microcalcification. After that, the calculation of the mean and standard deviation for the inner area is applied as well as pixel intensity. These three values are then considered as an input for a feedforward neural network. This neural network is applied to find out the threshold value that separates low level intensity and artefacts from microcalcifications; using three inputs (mean, standard deviation and pixel intensity), one hidden layer (three hidden nodes) and one output
-that is the threshold value. An example is shown in Figure 3.1. The total number of these cropped microcalcification regions is 220. An equal number of normal regions were also manually cropped to a size of 32 × 32.
Figure 3.1 Region of interest of size 32×32 containing microcalcifications.
3.3.
Image Thresholding
In this research, to be able to study the abnormalities (i.e. microcalcifications) they have to be separated from its surrounding in order to be analysed and examined. Therefore, a segmentation stage is needed which basically partitions the image into multiple segments or non-overlapping sets of pixels [8]. A thresholding based approach is the simplest method of segmentation, which when applied on greyscale images, creates binary images [8]; where in this work one binary value represents potential abnormality and the other binary value represents background. Moreover, further thresholding investigation has been done on 8-bit images keeping the background in black and the detected objects with its original grey-scale colour. This would provide more information out of the suspicious objects in the following chapter. The thresholding process basically provides selected regions for the next stage of feature extraction; to avoid the overhead of extracting and analysing features over the entire image.
-The implementation of the thresholding technique has been tested in two forms. First it has been applied to full mammogram images using a square filter. In the second implementation the thresholding method has been modified to be more focused and applied on ROI images with circular filters.
3.3.1. Using Square Filters
This section describes the first test done on a full mammogram image for microcalcifications detection. This thresholding approach has been adapted from a previous study by Kom et al. in [9] that investigated breast masses, which are larger scale abnormalities, and modified it to fit with this study and especially the much smaller microcalcifications.
This segmentation method uses a filter with two square windows, one inside the other, as shown in Figure 3.2.
Figure 3.2 Square windows filter used in the adaptive thresholding approach to microcalcification detection.
In Figure 3.2, I represents the inner window with a size of 5 × 5 pixels and O represents the surrounding border with a size of 20 × 20 pixels. These sizes were chosen empirically after testing several sizes for both the inner and outer window
-including 2 × 2, 3 × 3, 4 × 4, 5 × 5 and 6 × 6 for the inner window and 10 × 10, 13 × 13, 15 × 15, 18 × 18, 20 × 20 and 22 × 22 for the outer window. These filter sizes are more suitable for application on large mammogram resolutions rather than small resolution mammograms. The chosen sizes gave the best detection covering all the microcalcification peaks for a sample of images within a cluster. These two windows are scanned over the whole mammogram image and at each location the averages of the inner and border regions are calculated. The following criterion is applied to detect abnormal peaks in intensity from background tissue.
IF ((I > m) and (I > O + t)) pixel = 255 Else pixel = 0 (eq. 3.1)
Here I is the inner window intensity average, m is the minimum intensity value of microcalcifications, taken to be 120 after checking all microcalcifications pixel intensities in mammogram images from the MIAS database, to further confirm this value Adobe Photoshop is subjectively tested on microcalcifications; O is the outer boundary intensity average and t is a second intensity threshold value that was also found empirically and set equal to 10 when it was compared to other threshold values. An evaluation will be presented in section 3.3.2 comparing the square filter shape with circular filter shape using different threshold values.
There are two parts to this criterion used to decide whether to label the centre pixel with the value 255 to indicate a potential microcalcification pixel. The first part is a simple comparison between the inner window of pixel intensity average and the minimum intensity value of microcalcifications m. However, the density of breast tissue varies between each individual case and microcalcification can be found in regions with different background in different parts of a breast and in different
-mammograms. Therefore, to take account of this variation the second condition was added. Only if the inner average exceeds the border average by some minimum amount t, found after extensive experiments to be equal 10, is the current location marked as a possible abnormal region.
Figures 3.3 - 3.6 are illustrations from applying the square thr
![Figure 2.3 Images of 1mm x 1mm vignettes containing individual MCs from benign clusters [11]](https://thumb-us.123doks.com/thumbv2/123dok_us/417598.2547861/25.892.254.705.233.454/figure-images-vignettes-containing-individual-mcs-benign-clusters.webp)
![Figure 2.4 Images of 1 mm x 1 mm vignettes containing individual MCs from malignant clusters [11]](https://thumb-us.123doks.com/thumbv2/123dok_us/417598.2547861/26.892.262.701.109.327/figure-images-vignettes-containing-individual-mcs-malignant-clusters.webp)