Human-Centered Machine Learning Through
Interactive Visualization: Review and Open Challenges
Dominik Sacha1, Michael Sedlmair2, Leishi Zhang3, John Aldo Lee4, Daniel Weiskopf5, Stephen North6, Daniel Keim1
1-University of Konstanz, Germany 2-University of Vienna, Austria 3-Middlesex University, UK 4-Universit´e catholique de Louvain, Belgium
5-University of Stuttgart, Germany 6-Infovisible, Oldwick NJ, USA Abstract. The goal of visual analytics (VA) systems is to solve complex problems by integrating automated data analysis methods, such as machine learning (ML) algorithms, with interactive visualizations. We propose a conceptual framework that models human interactions with ML components in the VA process, and makes the crucial interplay between automated algorithms and interactive visualizations more concrete. The framework is illustrated through several examples. We derive three open research challenges at the intersection of ML and visualization research that will lead to more effective data analysis.
1
Introduction
Many real-world data analysis problems are intrinsically hard. On the one hand, data complexity and scale preclude simply looking at all the raw data, and make algorithmic approaches such as ML seem very attractive and even inevitable. On the other hand, the analytical power of ML cannot be fully exploited without effective human involvement. It remains a challenge to translate real-world phenomena and often ill-defined analy-sis tasks into ML-problems (including the application of appropriate methods). More importantly, it is crucial to incorporate the knowledge, insight, and feedback of the hu-man into the analytical process, such that hypotheses can be refined and the models can be tuned. By integrating ML algorithms with interactive visualizations, VA aims at providing a visual platform for the analyst to interact with their data and models [1]. Despite much effort to date, though, solutions from each field (ML and VA) are still not interwoven closely enough to satisfy many real-world applications [2, 3]. Toward effective integration, previous studies have proposed a series of conceptual frameworks that characterize the interplay between these approaches [1, 2, 3, 4]. However, these frameworks were mostly designed from an interactive visualization perspective, focus-ing on characterizfocus-ing the role of the “human in the loop”. A tighter connection with the different ML paradigms (unsupervised vs. (semi-)supervised learning; classification, regression, clustering, etc.) and their algorithmic implementation specificities (e.g., SVM vs. random forests in classification) is still largely missing. Therefore, a deeper focus on scenarios at which particular ML steps and VA methods can be supportive is desired. While illustrating inspiring examples, we identify aspects of ML methods that are amendable to be controlled interactively by the analyst. Our proposed conceptual framework opens the perspective for new ways of combining automated and interactive methods, which will lead to more tightly integrated and ultimately more effective data analysis systems.
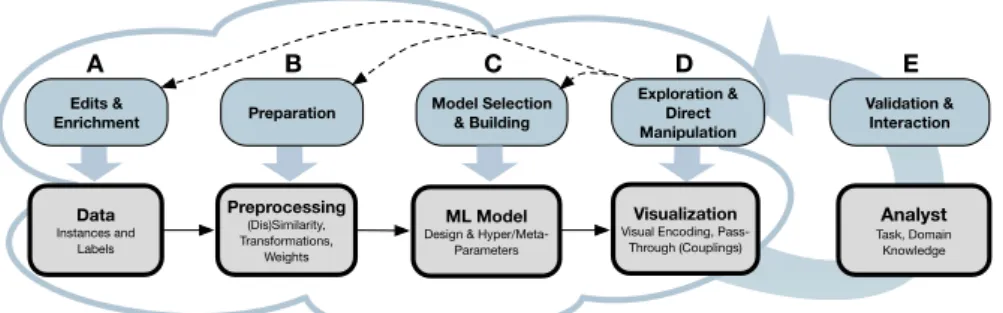
Edits & Enrichment Preparation Exploration & Direct Manipulation Model Selection & Building Data Instances and Labels Visualization
Visual Encoding, Pass-Through (Couplings) Preprocessing (Dis)Similarity, Transformations, Weights Analyst Task, Domain Knowledge Validation & Interaction A B C D E ML Model
Design & Hyper/Meta-Parameters
Fig. 1: Proposed conceptual framework: A typical interactive VA/ML pipeline is shown on the left (A–D), complemented by several interaction options. Interactions generate changes to be observed, interpreted, validated, and refined by the analyst (E). Visual interfaces (D) are the “lens” between ML models and the analyst. Dashed arrows indicate that direct interactions in the visualizations have to be translated to ML-pipeline adaptations.
2
Human-centered Machine Learning Framework
Our framework combines, embeds, and complements existing theories on interactive ML and VA by integrating and generalizing observations from examples that have emerged. The framework (Figure 1) consists of a typical VA/ML pipeline (A–D) and the analysts’ validation and refinement process (E). An analyst might interact with each single step in this pipeline through a visual interface (D), which acts as a mediator or “lens” between the human and the ML components (dashed arrows). The changes are then traversed back to the visual interface and shown to the analyst (solid arrows).
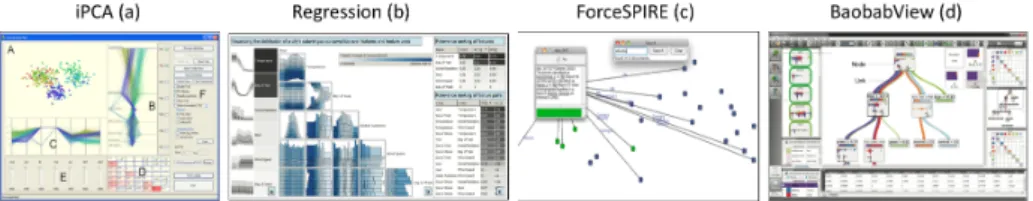
Edits & Enrichment (A):While in ML data is usually seen as “un-touchable”, many visualization systems allow and support analysts in cleaning, wrangling, editing, and enriching data [5], also during the analysis process. For example, a domain expert may iteratively add more labels in the training of a classification. Several strategies have been developed to make this process more efficient (e.g., inter-active learning [6]). Alternatively, an analyst might also simply want to run through some “what-if scenar-ios” to understand hypothetical assumptions about the data. Data operations are then followed by a “warm restart” of the ML pipeline, iteratively traversing through to the analyst. Consider iPCA [7] (Figure 2-a), an example that allows analysts to adjust a point in several views or spaces (e.g., projection or eigenvector view) and at the same time enables the analyst to observe the changes of that items’ values in data space. Re-moving data items allows observing how the projection changes. In ForceSPIRE [8] (Figure 2-c), analysts may add textual annotations to documents, which are then in-cluded into the analysis process (i.e., similarity calculation).
Preparation (B):Many ML models incorporate model-independent preprocessing steps. Whereas edit and enrich interactions focus on single observations, preprocessing affects a uniform transformation of features for a larger set of observations. Typical examples are transformations, such as standardization, scaling, or more complex methods (e.g., Fourier or wavelet transform), and weightings. Weightings may be filtering (0-weights) of data items, as well as feature selection. Feature weighting can be supported in the
Fig. 2: A selection of examples that effectively involve analysts into the ML processs. Courtesy of Jeong [10], M¨ulbacher [11], Endert [8], van den Elzen [12].
form of relevance, metric, or kernel learning. With this respect, we often observe a gap in the “judgment of (dis)similarity” between human and “default” ML methods. Ana-lysts often focus on specialized characteristics of their data. This requires us to include feature weightings or more complex (dis)similarity functions. The Dis-Function [9] system, for instance, allows analysts to drag and drop data points, causing the system to calculate a new distance function. By immediately revealing the resulting changes in the underlying model, such approaches give the analysts a convenient way to explore possible parameterizations of preprocessing steps.
Model Selection & Building (C):At the very core of VA, analysts might need to directly interact with ML models. We distinguish two general forms of model interactions. In
Model Selection, an analyst needs to choose among different ML algorithm families, or a set of pre-built model results, a process that can also be supported (semi-) auto-matically (e.g., cross validation, bootstrap) but also visually. For example, the analyst may select and refine regression models [11] (Figure 2-b) or build classifier ensembles by discovering several combination strategies [13]. Model Buildinginteractions focus on directly changing a given ML model through adjusting parameters. While internal parameters are optimized automatically, others such as design or form, and meta or hy-per parameters, need to be adapted by the analysts according to their assumptions. We found several model building interactions that can roughly be grouped into ML model changes that affect itsform,constraints,quality, oraccuracy. Formparameters define the basic structure (such as the number of neurons in a neural network), whereas con-straintsmay reflect more detailed assumptions (e.g., pinning a node in a force-directed layout [8]). Other examples allow for adjusting thequalityoraccuracyof the ML result, e.g., by interacting with the confusion matrix of a classifier [14].
Exploration & Direct Manipulation (D):Interactive visualizations serve as an aid or “lens” that facilitates the process of interpretation and validation, but also make ML interactions accessible to analysts. Usually, simple exploration interactions, such as changing the visual encoding or navigation, do not feed back to ML components. How-ever, the previous paragraphs contain various examples that allow interactions in visual interfaces, which are “passed through” to ML changes, indicated by the dashed arrows in Figure 1. This concept has become known as “semantic interaction” that maps intu-itive interactions to complex ML changes [8]. Therefore, different aspects of the ML parts may be visualized, such as data and model spaces (Figure 2-a), pre-built model variants including their characteristics (Figure 2-b) and quality (Figure 2-a/b/d), but also the ML structures (e.g., [12], Figure 2-d).
Validation & Interaction (E):In VA systems following our framework, analysts would be actively involved in an iterative process of observing, interpreting, and validating the system’s outputs followed by subsequent refinement. Such an approach would foster direct usage of ML tools by domain experts. Visual interfaces that are easy-to-use and -understand enable such analysts to bring in their domain knowledge more effectively (as illustrated in the previous paragraphs) and consequently adapt the ML components in order to further advance in data-intensive, yet ill-defined analysis tasks [15].
3
Challenges & Opportunities
Designing Interaction for ML Adaption:A variety of different ML algorithms includ-ing a large set of design options and parameters do exist. Yet, there is no general way to interface these with visualizations. Consequently, existing systems are often limited to a small set of ML techniques and parameters. Furthermore, when switching between the different ML models with current interfaces, such changes, however, would likely result in discontinuous interruptions of the human’s analysis process. Hence, novel ap-proaches will become necessary that smoothly support analysts to make sense of such changes. In addition, existing examples such as ForceSpire and iPCA have nicely illus-trated how understandable, direct interactions can be combined with model changes in a simple setup. Direct manipulation has been proven to be an effective and easy-to-use ac-cess to computational tools [16]. It has, however, been rarely explored in the context of ML so far. Often, ML models are designed for unique configurations, whereas in VA it-erative refinement is needed. Mapping user inputs to more complex algorithmic actions (along the entire ML pipeline) remains an open challenge, which is then to translate these inputs to data-, preprocessing-, ML model-adaptions, or combinations thereof.— Opportunities:At the core of our conceptual framework lies the idea that the underly-ing ML design options and meta-parameters (which cannot be optimized automatically) can be steered via iterative and accessible user interactions. Accessible interactions and smooth transitions between different ML models will support analysts to form an intu-ition or mental model [17] about the underlying data as well as the function or behavior of complex ML methods. Consider the case of switching between different ML mod-els: At which point does the system realize—from user feedback—that the chosen ML model might not be proper anymore? It then could select an alternative and smoothly transfer between the two. Instead of linear projection with PCA, it might for instance suggest some more complex nonlinear dimensionality reduction method like multidi-mensional scaling or t-SNE. Continuous model spaces [18] give first ideas towards such solutions, which are dependent on the ML models’ meta or hyper parameters and their interpretability. Further, more general ways to use and adapt ML through very sim-ple expert feedback (e.g., labeling or rating) would allow us to leverage a larger and more powerful set of ML methods. The previous examples illustrate that there is huge space for future research, given the large variety of ML techniques and their associated parameter spaces. A joint effort from both communities (ML and VA) is needed.
Guidance: Another major challenge is how to sufficiently support domain experts in steering this ML pipeline. Analysts are often overwhelmed, due to the variety of ML variants and parameters in addition to the large amount of data and tasks. Furthermore,
their analysis problems are often ill-defined, resulting in a rather exploratory or com-plex analysis process. Consequently, analysts may change, adapt, or switch between tasks very often. While the analyst may be able to provide crucial missing information towards solving ill-defined problems, they might lack programming and statistical ex-pertise and therefore require very individual guidance.— Opportunities:It will be im-portant to better understand the tasks, practices, and stumbling blocks of domain experts (which likely will differ from those of ML experts). The design study methodology is a viable approach towards gaining better understanding of such user characteristics [15] and providing appropriate guidance. Furthermore, enhanced measures and tools could be used in order to point analysts to interesting data, parameterizations, and ML mod-els through automatic recommendations. While many measures exist, both depicting data and perceptual characteristics, currently it is not well understood how they can be effectively leveraged in interactive analytical processes. Consider a relevance feedback learning approach, where an analyst provides iterative feedback about the interesting-ness of different ML models/visualizations. How could the system detect if a pattern was spotted and the analysis task changes from overview to detail? Therefore, we en-vision the usage of data and analytic provenance information (e.g., interaction logs) in order to guide the analysis process according to the analysts’ needs, which may be de-rived based on their behavior. In the VA community, research has been carried out on recording, visualizing, and reusing analysis provenance. However, no work has been carried out on modeling such information to help shape or refine analysis problems or even ML methods. This could be an interesting topic for involving the ML community.
Measuring Quality & Consistency: In the envisioned rich human-in-the-loop analysis process, it will be crucial to assure bothML model qualityandvisualization quality. Yet, the two types of quality assurance do not always align. For example in a visual embed-ding, there might be a trade-off between the preservation of the original data structure and the readability of patterns due to intrinsically high dimensionality. While quality measures exist for both aspects, the challenge will be to help analysts to find the right balance between the two, so meaningful analysis can be carried out. Beyond measuring ML and visualization quality, our framework suggests a third type of quality assess-ment, thelevel of consistency between the ML model and the analyst’s expectations. While an ML model will surely seek to “truthfully” reflect the data, essential pieces of information known by analysts may be unavailable to the machine. In this case, the set of ML assumptions may be incomplete, a common challenge in exploratory data analysis. —Opportunities: To externalize this missing human information, it is neces-sary to check the consistency between what the model presents, and what the analyst expects. If inconsistent, the analyst will either suspect a problem with the ML model and provide feedback about missing information, or accept that the expected patterns do not exist in the data. If consistent, analysts will usually conclude with a confirmation of their exception. Note, though consistency between human and machine is desirable, it does not guarantee correct reflection of the underlying ground truth in the data per se. Currently the consistency check is often done manually. Automatic methods that systematically check consistency, highlight inconsistencies, and recommend appropri-ate actions could help. Joint effort from both communities (ML and VA) is needed to enhance these measures, especially by combing and bridging them.
4
Conclusions
We propose a framework that characterizes potential forms of human interaction with ML components in a VA process. In general, VA tools have the potential for improved support of ML interpretation, understandability, validation, and refinement through in-teraction. However, current VA tools and ML components are posing many interesting challenges for future work. Towards addressing these challenges, closer collaboration between ML and visualization researchers is vital.
References
[1] D. Keim, J. Kohlhammer, G. Ellis, and F. Mansmann. Mastering the information age - solving problems with visual analytics, 2010.
[2] A. Endert, C. North, R. Chang, and M. Zhou. Toward usable interactive analytics: Coupling cognition and computation. InProc. Workshop Interactive Data Exploration and Analytics at KDD (IDEA), 2014. [3] D. Sacha, A. Stoffel, F. Stoffel, BC Kwon, G. Ellis, and D. Keim. Knowledge generation model for
visual analytics.IEEE Trans. Vis. Comput. Graph., 20(12):1604–1613, 2014.
[4] S. Amershi, M. Cakmak, W. Knox, and T. Kulesza. Power to the people: The role of humans in interactive machine learning.AI Magazine, 35(4):105–120, 2014.
[5] S. Kandel, J. Heer, C. Plaisant, J. Kennedy, F. van Ham, N. Riche, C. Weaver, B. Lee, D. Brodbeck, and P. Buono. Research directions in data wrangling: Visualizations and transformations for usable and credible data.Information Visualization, 10(4):271–288, 2011.
[6] B. H¨oferlin, R. Netzel, M. H¨oferlin, D. Weiskopf, and G. Heidemann. Inter-active learning of ad-hoc classifiers for video visual analytics. In2012 IEEE Conference on Visual Analytics Science and Technology, VAST 2012, Seattle, WA, USA, October 14-19, 2012, pages 23–32, 2012.
[7] D. Jeong, C. Ziemkiewicz, B. Fisher, W. Ribarsky, and R. Chang. iPCA: An interactive system for PCA-based visual analytics.Computer Graphics Forum, 28(3):767–774, 2009.
[8] A. Endert, P. Fiaux, and C. North. Semantic interaction for visual text analytics. InACM SIGCHI Conf. Human Factors in Computing Systems (CHI), pages 473–482, 2012.
[9] E. Brown, J. Liu, C. Brodley, and R. Chang. Dis-function: Learning distance functions interactively. In2012 IEEE Conference on Visual Analytics Science and Technology, VAST 2012, Seattle, WA, USA, October 14-19, 2012, pages 83–92, 2012.
[10] Dong Hyun Jeong, Caroline Ziemkiewicz, Brian D. Fisher, William Ribarsky, and Remco Chang. ipca: An interactive system for pca-based visual analytics.Computer Graphics Forum, 28(3):767–774, 2009. [11] T. M¨uhlbacher and H. Piringer. A partition-based framework for building and validating regression
models.IEEE Trans. Vis. Comput. Graph., 19(12):1962–1971, 2013.
[12] S. van den Elzen and J. van Wijk. Baobabview: Interactive construction and analysis of decision trees. In2011 IEEE Conference on Visual Analytics Science and Technology, VAST 2011, Providence, Rhode Island, USA, October 23-28, 2011, pages 151–160, 2011.
[13] J. Talbot, B. Lee, A. Kapoor, and D. Tan. Ensemblematrix: interactive visualization to support machine learning with multiple classifiers. InProceedings of the 27th International Conference on Human Factors in Computing Systems, CHI 2009, Boston, MA, USA, April 4-9, 2009, pages 1283–1292, 2009. [14] A. Kapoor, B. Lee, D. Tan, and E. Horvitz. Interactive optimization for steering machine classification. InProceedings of the 28th International Conference on Human Factors in Computing Systems, CHI 2010, Atlanta, Georgia, USA, April 10-15, 2010, pages 1343–1352, 2010.
[15] M. Sedlmair, M. Meyer, and T. Munzner. Design study methodology: Reflections from the trenches and the stacks.IEEE Trans. Vis. Comput. Graph., 18(12):2431–2440, 2012.
[16] B. Shneiderman. Direct manipulation: A step beyond programming languages. IEEE Computer, 16(8):57–69, 1983.
[17] Z. Liu and J. Stasko. Mental models, visual reasoning and interaction in information visualization: A top-down perspective.IEEE Trans. Vis. Comput. Graph., 16(6):999–1008, 2010.
[18] J. A. Lee, E. Renard, G. Bernard, P. Dupont, and M. Verleysen. Type 1 and 2 mixtures of Kullback-Leibler divergences as cost functions in dimensionality reduction based on similarity preservation. Neu-rocomputing, 112:92–108, 2013.