Department of Biological and Agricultural Engineering Department of Civil Engineering
Research and Extension Center 3793 N 3600 E
Kimberly, Idaho 83341-5076 U.S.A Telephone: 208-423-4691 Fax: 208-423-6559
Web site: http://www.kimberly.uidaho.edu/
The Need to Continue High Resolution Thermal Imagery (i.e.,
Land Surface Temperature) on the next Landsat Satellite System
for Water Resources Management
Dr. Richard G. Allen1, University of Idaho January 2004, revised August 2006
Western water resources of the United States are dominated by
diversions and consumption by irrigated agriculture. Management of
these diversions requires quantification of water consumption
(evapotranspiration) by irrigated crops that is possible only from
satellite imagery. The resolution of the quantification must be fine
enough to enable ‘seeing’ water consumption by individual fields and
land holdings.
The high resolution Landsat system
2has historically provided this
capability.
However, the high resolution thermal imager of past Landsat systems
necessary for accurate accounting of water consumption from
agriculture may not be included on any proposed future Landsat
replacement. If proposed satellite coverage at the high resolution (30
m) of Landsat does not incorporate coincidentally collected images of
surface temperature, then the current and extensive high resolution
mapping programs by state and federal agencies that quantify water
consumption from irrigated and other agricultural and natural
systems will be substantially impaired.
1
Professor of Water Resources Engineering, Kimberly Research and Extension Center, (208) 423-6601. [email protected]
2
The Landsat satellite orbits the earth from pole to pole at an altitude of 700 km. The satellite passes over every point on earth at least once each 16 days at about 1100 hours. The resolution of the visible and near-infrared imager on Landsat is 30 m (100 feet) and the resolution of the thermal imager on Landsat (for surface temperature measurement) has been 60 m (200 feet) on Landsat 7 and 120 m (400 feet) on Landsat 5. More information is available at http://landsat7.usgs.gov/
Justification
Accurate and detailed information on water consumption has been a long-standing critical need in river and water resources management. Quantification of consumption is increasingly needed as water resources come under more and more tension by more and more users and interests and as water is transferred to cities and environment. The scientific community has long been researching the use of dependable satellite information to fulfill this quantification need, and now image processing programs designed to utilize the long record of Landsat imagery are finally in place for application to extensive areas of the United States. These processing programs locate and
quantify the consumption of diverted water resources that occurs via the process of evapotranspiration (ET)3. These programs require and have taken strong advantage of the thermal imager of the Landsat system.
Unfortunately, the longstanding Landsat satellite system that is critical to serving these critical water resources needs is in jeopardy of phase-out and
abandonment by the US government. Only two Landsat’s are in orbit and one, Landsat 5 (1984 launch), is experiencing a problem with the solar energy array4 and the other, Landsat 7 (1999 launch), was damaged in 2003 and its usability for high resolution ET quantification is greatly impaired5. In addition, very recent plans to launch a temporary replacement Landsat satellite6 do not include the all-important thermal imager of past Landsat systems that is required for
determination of evapotranspiration.
In the short term, what is critically needed to service water management and administrative needs in water resources management is the following:
• An array of new Landsat or similar satellites (preferably a minimum of two) as a stand-alone system or in conjunction with some other satellite platform
• Each Landsat sensor system equipped with at least one thermal imager (for the calculation of surface temperature) having at 60 m resolution or better.
• The satellite array operated to provide images every 4 to 8 days over the entire United States.
3
Evapotranspiration is synonymous with the term “consumptive use” and refers to the conversion of liquid water at or below the surface into the vapor form through the process of evaporation and transpiration (through vegetation). ET by irrigated agriculture is by far the largest consumer of western rivers and ground water.
4
http://landsat7.usgs.gov/project_facts/project_news/December_Special_2005.php#topic_322
5
The capability of Landsat 7 to produce complete images each 16 days for use in creating ET maps based on energy balance has been lost. However, Landsat 7 is considered to still have value for other uses including the high resolution monitoring of vegetation and for producing ET information where only statistically sampled spatial samples are required.
6
Memo from John Marburger, Director of Office of Science and Technology Policy, Dec. 23, 2005: “Landsat Data Continuity Strategy Adjustment”
Background
The Landsat satellite system was inaugurated in 1972 and has provided routine high resolution imagery of the earth’s surface ever since. Landsat number 4, launched in 1982, was the first to include a special thermal imager for measuring temperature of the earth’s surface at high spatial resolution. This thermal imager has enabled the
calculation of evapotranspiration at the Earth’s surface via complex surface energy balances. Landsat 4 was followed in 1984 with Landsat 5 and in 1999 with Landsat 7 (the Landsat 6 satellite did not reach operational orbit following launch). Landsat 5 and Landsat 7 are still functioning today, although Landsat 7 was partially damaged by unknown causes on May 31, 2003 and since that time its images have not been useful for routine high resolution ET calculation (one or more calculations per month for complete images). In late 2005, Landsat 5 began to experience solar array problems and may be very near the end of its operational life.
The nearly explosive increase in the use of image data from Landsat for computing evapotranspiration since year 2000 is an outgrowth of:
1) the significant lowering of costs for Landsat images (by a factor of 10) since 1999;
2) successful research in developing dependable processes for computing ET from satellite images,
3) advances in computer data storage and data handling abilities within water resources administrative units and the ability to process and integrate water consumption maps;
4) increased litigation and mitigation between environmental needs, endangered species concerns, and historical water use, and
5) pressure from state water resources entities such as Idaho Department of Water Resources (IDWR) for such an operational product.
As an example of benefits derived from the Landsat thermal band, in Idaho, the Idaho Department of Water Resources uses water consumption maps based on ET derived from Landsat images, including thermal data, for:
1) water rights management and regulation;
2) purchase of water rights for endangered species and agreements with native American entities;
3) hydrologic modeling;
4) prediction of incidental ground-water recharge from surface irrigation; 5) quantification of water consumption during water rights litigation; 6) management of stream diversions for endangered species; and
7) prediction of water consumption changes due to the transition of land use from agriculture to city.
Other uses of water consumption prediction by satellite include:
1) impacts of deficit irrigation of orchards and vineyards to conserve water (California),
2) crop water demands for river management (New Mexico),
3) areal extent and amount of water consumption by riparian vegetation (New Mexico and California),
4) transferable water from land fallowing (California),
5) state wide consumption as part of a state water plan (California)
6) helping farmers determine actual irrigation water needs during state mandated conservation programs (Kansas),
7) compliance with limits on water consumption under interstate compacts (Wyoming, Nebraska, Utah, Idaho), and
8) impact of ground-water pumping by cities on surface hydrology and native vegetation (Florida).
With the 2003 malfunction of Landsat 7, useful satellite images for high resolution mapping of ET by energy balance (requiring every pixel every overpass) were available only from Landsat 5 and therefore only every 16 days. Now, with Landsat 5’s pending failure, a replacement Landsat system is desperately needed. It is critical that the replacement system contain the thermal imager or equivalent of past Landsat missions for measuring surface temperature. Clouds preclude the processing of images for evapotranspiration, so that water consumption maps can now be guaranteed only about once every 2 months if only a single Landsat satellite is functioning. This frequency is insufficient for closely following the seasonal changes of ET that result from plant growth and water availability. Therefore, two replacement Landsat satellites, each with a thermal imager, are recommended.
Specific Concerns
Specific concerns with the current Landsat satellite system and with the Landsat Data Continuity Mission (LDCM)7 are the following:
a) Landsat 7 malfunctioned in 2003 and no longer provides complete image information for all of its coverage (however, Landsat 7 is still useful for less periodic vegetation monitoring and for those areas lying along the center line of the flight path)
b) Landsat 5 became crippled in late 20058 and may have only one to two years of service life remaining before it fails completely.
7
http://ldcm.nasa.gov/
8
c) NASA may plan for a future Landsat satellite under the Landsat Data Continuity Mission and the NPOESS9 missions, but plans do not contain the high
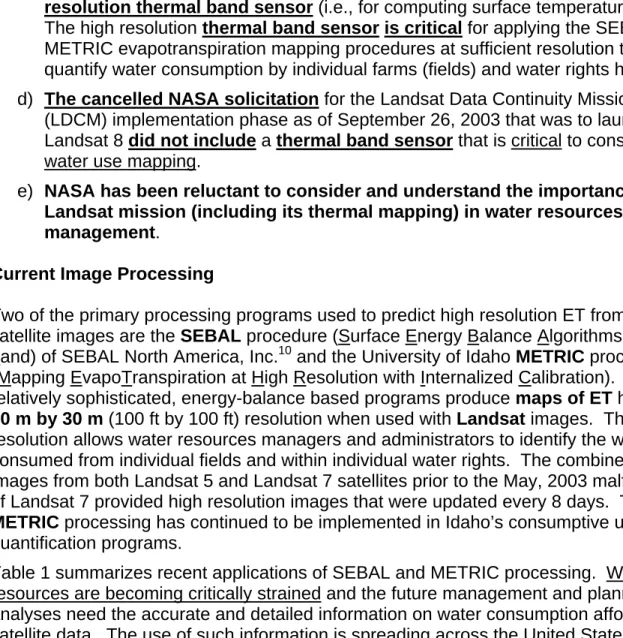
resolution thermal band sensor (i.e., for computing surface temperatures ). The high resolution thermal band sensor is critical for applying the SEBAL and METRIC evapotranspiration mapping procedures at sufficient resolution to
quantify water consumption by individual farms (fields) and water rights holdings. d) The cancelled NASA solicitation for the Landsat Data Continuity Mission
(LDCM) implementation phase as of September 26, 2003 that was to launch Landsat 8 did not include a thermal band sensor that is critical to consumptive water use mapping.
e) NASA has been reluctant to consider and understand the importance of the Landsat mission (including its thermal mapping) in water resources
management. Current Image Processing
Two of the primary processing programs used to predict high resolution ET from satellite images are the SEBAL procedure (Surface Energy Balance Algorithms for Land) of SEBAL North America, Inc.10 and the University of Idaho METRIC procedure11 (Mapping EvapoTranspiration at High Resolution with Internalized Calibration). These relatively sophisticated, energy-balance based programs produce maps of ET having 30 m by 30 m (100 ft by 100 ft) resolution when used with Landsat images. This high resolution allows water resources managers and administrators to identify the water consumed from individual fields and within individual water rights. The combined use of images from both Landsat 5 and Landsat 7 satellites prior to the May, 2003 malfunction of Landsat 7 provided high resolution images that were updated every 8 days. The METRIC processing has continued to be implemented in Idaho’s consumptive use quantification programs.
Table 1 summarizes recent applications of SEBAL and METRIC processing. Water resources are becoming critically strained and the future management and planning analyses need the accurate and detailed information on water consumption afforded by satellite data. The use of such information is spreading across the United States. State and federal water resources agencies are discovering the immense value of
evapotranspiration information produced by the SEBAL and METRIC processes and are incorporating this information into routine operations, as evidenced by a
9
National Polar-orbiting Operational Environmental Satellite System (http://www.ipo.noaa.gov/). The NPOESS VIIRs sensors have only 400 m resolution, which is too coarse for irrigated agriculture and water resources management (http://www.ipo.noaa.gov/Technology/viirs_summary.html). The NPOESS may be expanded to contain Landsat-scale (resolution) sensors (Memo from John Marburger, Director of Office of Science and Technology Policy, Aug. 13, 2004). However, the all-important thermal band is not planned for inclusion. Therefore, the expanded NPOESS - LCDM combination would not be useable for quantifying water consumption from individual irrigated and agricultural fields necessary for future management levels.
10
www.sebal.us
11
recent national conference on Evapotranspiration by Remote Sensing sponsored by the U.S. Bureau of Reclamation12.
SEBAL and METRIC are currently preferred over other satellite-based ET process models in the western United States because of the use of internalized calibration procedures13. These procedures index sensible heat fluxes from land surfaces (one of the major energy balance components) to satellite measured surface temperatures at specific surface boundary conditions. The indexing of the heat flux to available ground weather data eliminates the need for atmospheric correction of short-wave and thermal information in images and greatly reduces accuracy requirements of thermal images14.
12
Feb 8-10, 2005, Ft. Collins, Colorado. 13
Bastiaanssen, W.G.M., M. Menenti, R.A. Feddes, and A.A.M. Holtslag, 1998. A remote sensing surface energy balance algorithm for land (SEBAL): 1. Formulation. Journal of Hydrology 212-213:198-212.
8/14/00
Individual center pivot irrigated fields
near Minidoka County, Idaho
ET from
individual
Fields is
Critical
for
Water Rights,
Water Transfers,
Farm Water Management
8/14/00
Individual center pivot irrigated fields
near Minidoka County, Idaho
8/14/00
Individual center pivot irrigated fields
near Minidoka County, Idaho
ET from
individual
Fields is
Critical
for
Water Rights,
Water Transfers,
Farm Water Management
Landsat 7, August 14, 2000
Allen, R.G., A. Morse, and M.Tasumi. 2003. Application of SEBAL for Western US Water Rights Regulation and Planning. Proc. Int. Workshop on Use of Remote Sensing of Crop Evapotranspiration for Large Regions. 54th IEC Meeting of the International Commission on Irrigation and Drainage (ICID), Montpellier, France, Wednesday, 17 September, 2003. 13 pages. On web at:
http://www.kimberly.uidaho.edu/water/montpellier/p10/Allen_P.pdf
with presentation at http://www.kimberly.uidaho.edu/water/montpellier/p10/index.html
14
Tasumi, M. 2003. Progress in operational estimation of regional evapotranspiration using satellite imagery. Ph.D. Dissertation, University of Idaho, Moscow, Idaho.
Trezza, R. 2002. Evapotranspiration using a satellite-based surface energy balance with standardized ground control. Ph.D. Dissertation, Utah State University, Logan, Utah.
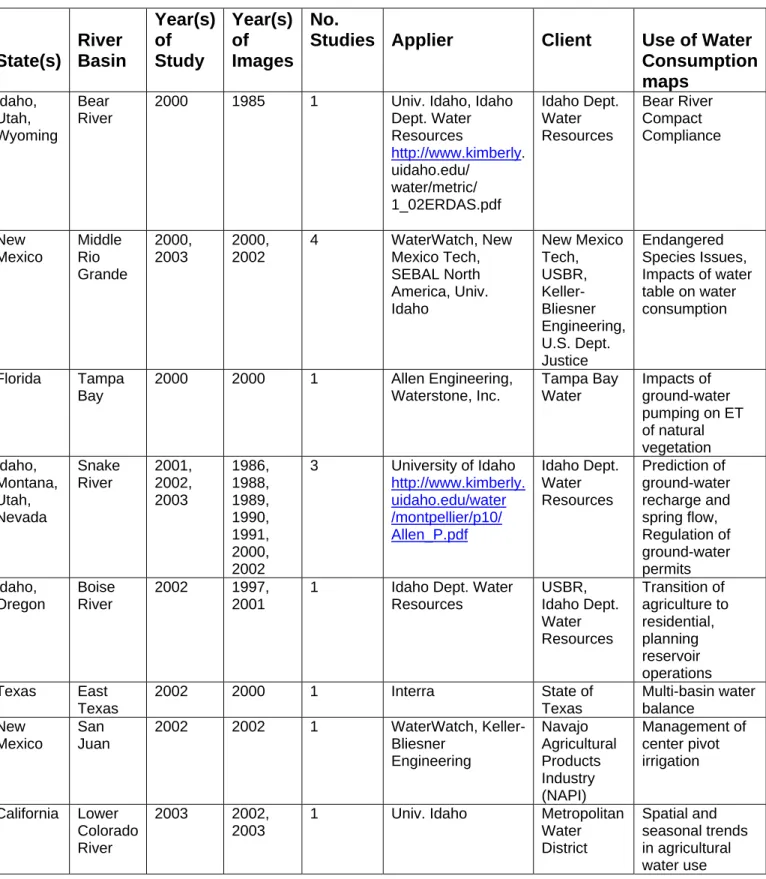
Table 1. Applications of SEBAL or METRIC in the United States that have relied on Landsat
satellite imagery (including the thermal band) to produce maps of water consumption
(evapotranspiration). State(s) River Basin Year(s) of Study Year(s) of Images No.
Studies Applier Client Use of Water Consumption maps Idaho, Utah, Wyoming Bear River
2000 1985 1 Univ. Idaho, Idaho
Dept. Water Resources http://www.kimberly. uidaho.edu/ water/metric/ 1_02ERDAS.pdf Idaho Dept. Water Resources Bear River Compact Compliance New Mexico Middle Rio Grande 2000, 2003 2000, 2002 4 WaterWatch, New Mexico Tech, SEBAL North America, Univ. Idaho New Mexico Tech, USBR, Keller-Bliesner Engineering, U.S. Dept. Justice Endangered Species Issues, Impacts of water table on water consumption Florida Tampa Bay 2000 2000 1 Allen Engineering, Waterstone, Inc. Tampa Bay Water Impacts of ground-water pumping on ET of natural vegetation Idaho, Montana, Utah, Nevada Snake River 2001, 2002, 2003 1986, 1988, 1989, 1990, 1991, 2000, 2002 3 University of Idaho http://www.kimberly. uidaho.edu/water /montpellier/p10/ Allen_P.pdf Idaho Dept. Water Resources Prediction of ground-water recharge and spring flow, Regulation of ground-water permits Idaho, Oregon Boise River 2002 1997, 2001
1 Idaho Dept. Water
Resources USBR, Idaho Dept. Water Resources Transition of agriculture to residential, planning reservoir operations Texas East Texas 2002 2000 1 Interra State of Texas Multi-basin water balance New Mexico San Juan 2002 2002 1 WaterWatch, Keller-Bliesner Engineering Navajo Agricultural Products Industry (NAPI) Management of center pivot irrigation California Lower Colorado River 2003 2002, 2003
1 Univ. Idaho Metropolitan
Water District Spatial and seasonal trends in agricultural water use
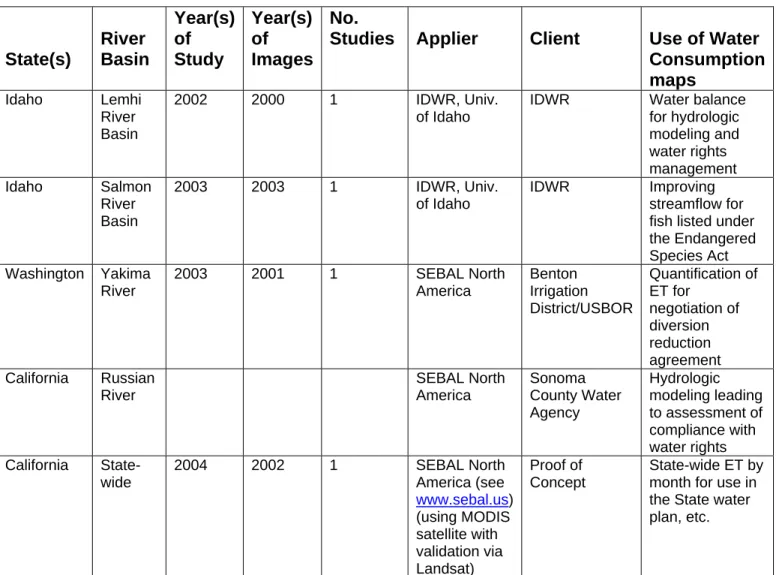
Table 1 Continued. Applications of SEBAL or METRIC in the United States that have relied on Landsat imagery (including the thermal band) to produce maps of water consumption. State(s) River Basin Year(s) of Study Year(s) of Images No.
Studies Applier Client Use of Water Consumption maps Idaho Lemhi River Basin 2002 2000 1 IDWR, Univ. of Idaho
IDWR Water balance
for hydrologic modeling and water rights management Idaho Salmon River Basin 2003 2003 1 IDWR, Univ. of Idaho IDWR Improving streamflow for fish listed under the Endangered Species Act Washington Yakima River 2003 2001 1 SEBAL North America Benton Irrigation District/USBOR Quantification of ET for negotiation of diversion reduction agreement California Russian River SEBAL North America Sonoma County Water Agency Hydrologic modeling leading to assessment of compliance with water rights California State-wide 2004 2002 1 SEBAL North America (see www.sebal.us) (using MODIS satellite with validation via Landsat) Proof of Concept State-wide ET by month for use in the State water plan, etc.
Landsat False Color (MRG)
8/26/2002 10:33am
MODIS False Color (MRG)
8/26/2002 11:02am
Need for High Resolution Imagery
Middle Rio Grande south of Albuquerque, NM
Landsat vs MODIS
Landsat False Color (MRG)
8/26/2002 10:33am
MODIS False Color (MRG)
8/26/2002 11:02am
Need for High Resolution Imagery
Middle Rio Grande south of Albuquerque, NM
Landsat vs MODIS
The Specific Need for Landsat and its high resolution Thermal band
A typical irrigated field in the western U.S. has dimensions of 800 x 800 m or less. Generally, with Landsat 7’s 60 m thermal pixel, we can obtain up to 100 thermal pixels that are completely contained within an individual field (after buffering in from edges). With Landsat 5’s 120 m thermal pixel, we can find about 15 thermal pixels within a single field. These numbers of pixels provide extremely valuable information regarding spatial variability of evapotranspiration within fields and uniformity of water use. They also ‘insure’ our capability to estimate accurately total water consumption by that individual field.
In the case of MODIS’s 1000 m thermal pixels (at nadir view) one average-sized field is ‘swallowed’ by a single thermal pixel, or worse yet, is split between two large thermal pixels, with specific thermal information for the field lost.
Other low (i.e., coarse) resolution satellites can be used to create maps of
evapotranspiration. However, these do not have the same, necessary moderately high (30 to 120 m) resolution of Landsat, or they lack the consistent return time of Landsat:
o Although the MODIS satellite (first launched in 1999) has a daily return time (one overpass per day) and provides adequate spectral and thermal information for ET mapping, its thermal resolution is only 1000 m (0.6 mile) actual and 2000 m useable (based on average view angles), which makes the identification of water consumption from individual fields (generally having dimensions of 200 to 800 m) and for individual crops impossible. (see figure above).
o The ASTER satellite sensor (1999 launch) has a potential 8 day return time, which is adequate for ET mapping, but communication downlink constraints prohibit continuous collection of image data. Therefore, the actual image return time for all areas of the western U.S. is on the order of months, rather than days. Thus, continuous coverage of large areas of the United States or even irrigated areas of the west is not possible.
o The AVHRR satellite of NOAA has similar resolution as MODIS and similar constraints. Although AVHRR and MODIS can be used to provide ET maps for large areas that are useful for hydrologic and global climate change studies, the resolution is not sufficient to provide the evapotranspiration information required for precision management of our seriously stretched water resources, especially in the irrigated areas of the west.
o The GOES satellite system provides continuous, near real-time coverage of all points of the United States. However, this satellite lacks the spatial resolution necessary for the accurate and detailed computation of water consumption by agriculture.
o The future “next generation” NPOESS (National Polar-orbiting Operational Environmental Satellite System) (earliest launch in 2009), while having superior spectral and thermal sensors and information, will suffer the same deficiencies of MODIS and AVHRR for energy balance and evapotranspiration determination, in that the image resolution will only be about 700 m in the bands required for ET modeling. NPOESS may be expanded to contain Landsat-scale (resolution) sensors (Memo from John Marburger, Director of Office of Science and
Technology Policy, Aug. 13, 2004). However, the all-important thermal band is not planned for inclusion at the current Landsat resolution. Therefore, the expanded NPOESS - LCDM combination will not be useable for quantifying water consumption by individual stakeholders in irrigated agriculture.
o Other high resolution satellites such as the French SPOT and Indian ISIS satellites do not contain thermal imagers to measure surface temperature and are therefore unusable with the energy-balance based SEBAL and METRIC processes for ET mapping
In NASA’s own words: “No other current or planned remote sensing system, public or private, fills the role of Landsat in global change research or in civil and commercial applications.”15
It was the intention of NASA and Congress since 199216 to continue support for this critical Earth-imaging program that includes monitoring of land surface temperature (critical to the calculation of evapotranspiration). The noted NASA publication on Landsat goes on to state: “Landsat 7 will fulfill its mission by providing repetitive,
synoptic coverage of continental surfaces; spectral bands in the visible, near-infrared, short-wave, and thermal infrared regions of the electromagnetic spectrum; spatial resolution of 30 meters (98-feet); and absolute radiometric calibration. No other current
or planned remote sensing system matches this combination of capabilities.” Unfortuntately, Landsat 7 is damaged and any follow-on system may not contain the high resolution thermal imager of previous Landsat systems.
Continued Landsat imagery that includes thermal imagery is imperative to western and southeastern water resources management for the following reasons:
1. Moderately High resolution. The 30 m short-wave resolution and 60 to 120 m thermal resolution of Landsat satellites is critical for the computation and mapping of evapotranspiration from individual irrigated fields. Water rights regulation and
administration are critically tied to identification and quantification of water consumption on a field by field basis. The current ET mapping by the Idaho Department of Water Resources (IDWR) could not have been developed if the high-resolution Landsat images with thermal (temperature) images had not been
available. The high-resolution Landsat images provide a means for identifying the crop type for each field that is useful for characterizing trends in evapotranspiration and for establishing relationships between water consumption and crop type (for example work by the U.S. Bureau of Reclamation in California and Arizona). The detailed and accurate computation of evapotranspiration using Landsat satellite data is not possible with the 1 km resolution of MODIS and AVHRR satellites.
2. Continuous coverage. Landsat satellite images are available for every portion of the United States for nearly every overpass date. This continuous coverage is critical for tracking the change of water consumption over time and space for individual fields, irrigation projects, river basins, and regions. Continuous surface coverage is not possible with the ASTER satellite. ASTER coverage must be ordered ahead of time and there is substantial competition within the scientific community for this information. In water resources management and conflict resolution and in issues involving endangered species, we often must look back in time to quantify historical water consumption and historical trends. Rarely do we have the foresight to “order on” a satellite platform such as ASTER ahead of the
15
http://pao.gsfc.nasa.gov/gsfc/service/gallery/fact_sheets/earthsci/landsat/landsat7.htm
needed date. Recent Idaho applications of SEBAL and METRIC have processed Landsat images as far back as 198517.
3. Long image history. Landsat images ( including thermal images) have been available for much of the United States since the early 1980’s. This historical data has been extremely valuable for water resources management because it provides information on changes in water consumption over time for specific areas. Long, continuous records are essential for hydrologic studies and ecological and endangered species studies on the impacts of land use change. The
implementation of the Landsat Data Continuity Mission is crucial to the future of water consumption mapping having adequate resolution, return cycle, and coverage. 4. Workable return time. The 16 day return time of Landsat (8 days with both
Landsat 5 and 7 satellite) has been sufficient to establish trends in water
consumption caused by growth and death of vegetation and change in weather. Shorter return times (i.e., with multiple Landsats) would be even better. However, two Landsat satellites are sufficient to provide three cloud-free high resolution images per month during summer in most western regions. Four Landsat satellites would provide even better temporal data for the western states and would provide some backup capacity in the event of satellite failure.
We see a tremendous future for the use of high resolution Landsat thermal band information in water resources management in the United States that would
justify the cost of a complete, fortified, stand-alone Landsat program. Morse18 has conservatively estimated cost savings of ground-water pumping monitoring over a ten year period for the western United States through the use of Landsat to estimate water consumption by agriculture as opposed to expensive and problematic pump flow measurements, site visits, and checking of electrical power consumption records. He has estimated the ten-year value of using Landsat imagery at about 1 billion dollars, which far exceeds the total cost for the Landsat 8 program. The potential savings for this one application, alone, are enormous. Mapping of consumptive use is critical for surface water management.
The Landsat satellite replacements or other satellite systems must measure surface temperature (i.e., have at least one thermal imager) coincident with the short-wave images for the computation of water consumption maps.
17
Morse, A., M. Tasumi, R.G. Allen and W.J. Kramber, 2000. Application of the SEBAL Methodology for Estimating Consumptive Use of Water and Streamflow Depletion in the Bear River Basin of Idaho through Remote Sensing: Final Report. Idaho Department of Water Resources, Idaho
18
Morse, A. 2003. Comparison of Ground Water Monitoring Costs as a Reason to Maintain the Thermal Band on the Landsat Data Continuity Mission: A Quick Look. Internal Report to the Idaho Department of Water Resources, Boise, Idaho. Feb. 18, 2003, 5 p.
Evapotranspiration from Vegetation Indices Alone
Evapotranspiration has a high correspondence with the amount of vegetation cover. However, ET is also impacted by wetness of soil beneath and around vegetation or even in the absence of vegetation. The following figure of ET on a single day for more than 50 fields of potatoes in southern Idaho demonstrates that high levels of ET (in this case in the range of 8.8 to 9.2 mm per day) can occur over a broad range in a
vegetation index (NDVI) due to impacts of soil surface wetness. Thus, using a
vegetation index alone is in general incapable of quantifying ET for specific instances. Surface temperature imagery is needed to quantify impacts of surface wetness.
8.4
8.6
8.8
9.0
9.2
9.4
9.6
Evapotranspiration, mm/day
0.00
0.20
0.40
0.60
0.80
1.00
NDVI
Potato Fields in Southern Idaho Path 40, 19 June, 2000
Reasons given in the past by NASA19 for not including a thermal band sensor in future Landsat missions are:
1 The cryogenically-cooled, older technology used on present Landsat satellites is too expensive and heavy to put on the future Landsat Data Continuity Mission (LDCM). 2 New microbolometer technology for measuring earth surface temperature is still
relatively immature and perhaps too risky to incorporate on the LDCM. However, we believe that thermal images acquired with a microbolometer imager would provide sufficient accuracy to be used in METRIC and SEBAL image processing procedures for consumptive use quantification. These processes can tolerate several degrees of measurement bias.
19
Dr. Ghassem Asrar, NASA Associate Administrator for Earth Science in a letter dated August 7, 2003 to Drs. Paul Pinter and Bruce A. Kimball, USDA-ARS, Phoenix, AZ
3 NASA has not been able to identify a sufficient customer base for thermal (surface temperature) data.
Other short term pathways:
In the short term, to fill in before new Landsat class satellites with thermal bands can be designed, funded and launched, what might serve as a fill-gap is to utilize the Chinese-Brazilian CBERS satellite system20. However a ground-station for North
America, operated by the USGS EROS center or other federal center, would need to be constructed to download CBERS images, since these are currently only downloaded over Brazil and China.
The CBERS system is comprised of two (soon to be three) satellites launched in 1999, 2003 and 2006 that have somewhat coarser resolution in the thermal band (80 to 160 m as compared to 60 m for Landsat 7’s thermal band). However, this system, that does contain thermal imagers, could help fill in for Landsat while a new Landsat constellation (having a high resolution thermal band) is designed and launched. The CBERS
satellites are only designed for mission lifespans of two years, however, so the CBERS system may not be a viable long-term solution. However, CBERS may be the only solution if a high resolution thermal band is not included on future Landsat data
continuity missions. Presently, CBERS data are only downloaded over Asia and Brazil. No ground-station exists in North America to download images for the United States. Some kind of a mutual-use agreement may enable the use of the CBERS program for the short-term. The quality and reliability of the CBERS images are in question and must be investigated.
20
Summary and Conclusions
The current ET mapping in Idaho, Utah, Wyoming, Montana, Washington, New Mexico, Texas and Nevada and California requires the high resolution of Landsat satellites (as opposed to MODIS or AVHRR) to identify ET from individual fields for purposes of water rights and irrigation water management. The ET mapping process requires the
consistent return time and coverage of the Landsat system (as opposed to ASTER, which is intermittant at best). In addition, the process requires the high resolution thermal imager of past Landsat systems.
1 With the damage to Landsat 7, we are now down to one single high-resolution, continuous coverage, thermal-sensor equipped satellite (Landsat 5) and, since
December 2005, its ability to continue to generate operational power is questionable;
2 High-resolution, continuous coverage thermal information is essential for the mapping of water consumption (evapotranspiration) in the U.S. Mapping of water consumption is imperative for
a) quantifying actual depletions to the water resource caused by evapotranspiration of diverted water
b) monitoring ground-water pumpage by individual landholders;
c) mediating and mitigating water rights conflicts and impacts of water transfers; and
d) solving endangered species issues related to water resources;
3 Several states besides Idaho are beginning or considering a substantial application of SEBAL, METRIC or related procedures for quantifying ET from satellite including New Mexico, Texas, California, Wyoming, Colorado, Florida, and Nebraska. 4 The western U.S. has suffered an extended drought that has shown that better
management of the water resource through more effective and economically efficient water use is essential.
5 A short term solution could be the establishment of a ground-station for
downloading image data from the Sino-Brazilian CBERS satellite system that has spatial resolution and thermal band similar to Landsat.
We need a working Landsat system that (ideally) is:
• An array of two to four Landsat satellites
• Each satellite is equipped with at least one thermal band sensor (for measurement of surface temperature) at a maximum of 60 m resolution.
• The array is operated to provide images every four days for all points within the United States.
For more information on the need for high resolution thermal imagery in water resources management and land surface processes, please contact:
Dr. Richard G. Allen
Professor of Water Resources Engineering
University of Idaho
Kimberly Research and Extension Center
Kimberly, Idaho 83341 (208) 423-6601
Dr. David Tuthill
Idaho Department of Water Resources 1301 North Orchard Street
Boise, ID 83706 (208) 327-7900
Mr. Anthony Morse
Idaho Department of Water Resources 1301 North Orchard Street
Boise, ID 83706 (208) 327-7900
Dr. Bryan Thoreson Project Manager SEBAL North America
1772 Picasso Avenue, Suite A Davis, CA 95616-0550
(530) 757-6107 ext. 15
Dr. Jan Hendrickx Professor of Hydrology
Dept of Earth & Environmental Science New Mexico Tech, Socorro, NM 87801 MSEC 240
(505)835-5892
Mr. Jerry Robb
Associate Resources Analyst Westlands Water District
PO Box 6056, Fresno, CA 93703 (559) 241-6237
Dr. Martha C. Anderson
USDA-ARS-Hydrology and Remote Sensing Lab Bldg. 007, BARC-WEST, Rm. 104 Beltsville, MD 20705 Voice: (301) 504-6616 Fax: (301) 504-8931 [email protected] Dr. Christopher Neale
Department of Biological and Irrigation Engineering
Utah State University Logan, UT 84322-4105 (435) 797-2785
Mr. David Jordan, PE, Senior Hydrogeologist INTERRA 6501 Americas Parkway NE Suite 820 Albuquerque, NM 87110 (505) 246-1600 [email protected]
Annual Evapotranspiration for a 200 mile x 100 mile section of southern Idaho during year 2000 as determined from Landsat visible and thermal imagery by the METRIC processing algorithms. Resolution of the ET map is 30 m x 30 m.
ETr Fraction 0.0 0.2 0.4 0.6 0.8 1.0 1.1 Evapotranspiration (mm/day) 0.0 1.5 3.0 4.5 6.0 7.5 8.2 24-hour ET – southcentral Idaho – August 14, 2000
basalt basalt recent burn recent burn Lake Walcott Lake Walcott North North
Wood River Valley
Wood River Valley
Craters of the Moon
Craters of the Moon
Thousand Springs Thousand Springs Twin Falls Twin Falls Burley Burley ETr Fraction 0.0 0.2 0.4 0.6 0.8 1.0 1.1 Evapotranspiration (mm/day) 0.0 1.5 3.0 4.5 6.0 7.5 8.2 24-hour ET – southcentral Idaho – August 14, 2000
basalt basalt recent burn recent burn Lake Walcott Lake Walcott basalt basalt recent burn recent burn Lake Walcott Lake Walcott North North
Wood River Valley
Wood River Valley
Craters of the Moon
Craters of the Moon
Thousand Springs Thousand Springs Twin Falls Twin Falls Burley Burley North North North North
Wood River Valley
Wood River Valley
Wood River Valley
Wood River Valley
Craters of the Moon
Craters of the Moon
Craters of the Moon
Craters of the Moon
Thousand Springs
Thousand SpringsThousand Springs
Thousand Springs
Twin Falls
Twin FallsTwin Falls
Twin Falls Burley Burley Burley Burley 40 60 50 30 20 Temperature (oC)
Surface Temperature – southcentral Idaho – August 14, 2000
basalt basalt recent burn recent burn Lake Walcott Lake Walcott North North
Wood River Valley
Wood River Valley
Craters of the Moon
Craters of the Moon
Thousand Springs Thousand Springs Twin Falls Twin Falls Burley Burley 40 60 50 30 20 Temperature (oC)
Surface Temperature – southcentral Idaho – August 14, 2000
basalt basalt recent burn recent burn Lake Walcott Lake Walcott basalt basalt recent burn recent burn Lake Walcott Lake Walcott North North
Wood River Valley
Wood River Valley
Craters of the Moon
Craters of the Moon
Thousand Springs Thousand Springs Twin Falls Twin Falls Burley Burley North North North North
Wood River Valley
Wood River Valley
Wood River Valley
Wood River Valley
Craters of the Moon
Craters of the Moon
Craters of the Moon
Craters of the Moon
Thousand Springs
Thousand Springs
Thousand Springs
Thousand Springs
Twin Falls
Twin FallsTwin Falls
Twin Falls
Burley
BurleyBurley
Burley
Surface temperature image from Landsat (left) for southcentral Idaho and associated evapotranspiration ‘map’ (right) derived from the Landsat visible and thermal images.