THESIS FOR THE DEGREE OF LICENTIATE OF ENGINEERING
A present state analysis method for
performance measurement systems
ANNA LANDSTRÖM
Department of Technology Management and Economics CHALMERS UNIVERSITY OF TECHNOLOGY
A present state analysis method for performance measurement systems ANNA LANDSTRÖM
©ANNA LANDSTRÖM, 2018.
Licentiate thesis ISSN 1654-9732
Licentiate thesis report no L2018:105
Department of Technology Management and Economics Chalmers University of Technology
SE-412 96 Gothenburg Sweden
Telephone + 46 (0)31-772 1000
Printed by Chalmers Digitaltryck Gothenburg, Sweden 2018
A present state analysis method for performance measurement systems ANNA LANDSTRÖM
Abstract
Most companies use a performance measurement (PM) system to support strategic management and operations management processes. This is especially important in today’s dynamic environment, which leads to changes in company strategy and PM systems. To achieve an efficient PM system, it is important to measure the things that matter to the organization but at the same time measure as little as possible. A life cycle approach to the PM system is useful in handling these changes, since it helps companies regularly review and design their performance indicators and keep them relevant. Several framework and methods exist for reviewing PM systems, and their main focus is on how well the performance indicators align with the company strategy. However, a research gap has been identified in how performance indicators are designed and used in the lower levels of an organization. Therefore, the purpose of this thesis is to identify areas of improvement and to develop a method to help companies review and design an efficient PM system.
The present state analysis method (PSAM) developed in the thesis focuses on reviewing operational performance indicators, using the strategic goals of the studied organization as input. The data is collected both from interviews with top management and from a mapping of the performance indicators used in the organization. This gives a view both of the top management’s perspective as well as of the operational use of the PM system. The strategic alignment of the mapped performance indicators are analyzed by visualizing the connection between the strategic goals and the performance indicators at each organizational level in a tree diagram. In addition, the standardization and rationalization potentials of the existing PM system are analyzed through a set of matrices that determine whether any performance indicators measure the same thing or have the same purpose.
The PSAM was tested at 7 manufacturing sites in Sweden to investigate the present state of their PM systems and to identify areas of improvement. The findings show similar structure of PM systems within the companies, where the performance indicators were divided into categories that were derived from the strategy. More than half of the manufacturing sites had processes for all four stages in the KPI-life cycle; however, processes for reviewing the PM systems must be improved. The results also show that the companies used a large number of performance indicators that were well-aligned to the strategy. The studied companies were asked to identify common pitfalls related to their PM system, and eight groups of pitfalls were identified. One of the most important procedures to avoid these pitfalls is to make sure that the organization has defined processes for all stages in the KPI life cycle.
This thesis contributes to the theoretical field of performance measurement systems with an empirical verification of the use of existing theories and frameworks, as well as a standardized and systematic method to review the operational performance measurement system within a single manufacturing site.
Keywords:Performance measurement systems, Performance indicators, Present state analysis method
Acknowledgements
This two and a half year long process resulting in this thesis would not have been possible without the support from several people.
First, I would like to thank my supervisor Peter. Thank you for giving me the opportunity to discover the academic world and introducing me to performance measures. Your support and feedback during this process has taught me a lot about how to conduct research and to believe in my own ability to do it. I would also like to thankMats, my co-supervisor and examiner, for all interesting discussions and the support.
I am grateful to all the participants in the research project SuRE BPMS. All the discussions and feedback from the academic colleagues have helped me a lot to develop thoughts and ideas into academic results and findings and I am very thankful to the industrial participants for allowing me to visit and study their organizations, the input from all of you has been invaluable.
These two and a half years would not have been the same without all colleagues and friends. Your support means a lot. Especially Maria, Victor and Simon, your support during the rough times has been invaluable. Also, Dan and Daniel, my best study buddies from the master who inspired me to start this journey towards a PhD.
Last but not least, my family. Thank you, Mum, Dad and Johanfor always believing in me, I would not have come this far without you! AndJens, thank you for being my rock, helping me to get back on track when my confidence fails. I love you.
I could not have done this without any of you. Thank you!
List of appended papers
This thesis is based on the work contained in the following papers:Paper 1
Landström, A., Almström, P., Winroth, M., Andersson, C., Ericson Öberg, A., Kurdve, M., Shahbazi, S., Wiktorsson, M., Windmark, C. and Zackrisson, M. (2018). ”A life cycle approach to business performance measurement systems”. Presented at the Swedish Production Symposium 2018 in Stockholm.
Paper 2
Landström, A., Almström, P., Winroth, M., Andersson, C., Windmark, C. Shahbazi, S., Wiktorsson, M., Kurdve, M., Zackrisson, M.Ericson Öberg, A., and Myrelid, A. (2016). ”Present state analysis of business performance measurement systems in large manufacturing companies”. Presented at the Performance Measurement Association Conference 2016 in Edinburgh.
Paper 3
Landström, A., Almström, P., and Winroth, M. (2016). ”Performance indicators at different organizational levels in manufacturing companies”. Presented at the Swedish Production Symposium 2016 in Lund.
Paper 4
Landström, A., Almström, P., and Winroth, M. (2017). ”Review of a performance measurement system at shop-floor level”. Presented at the EurOMA Conference 2017 in Edinburgh.
Contents
1 Introduction 1
1.1 Purpose and research questions . . . 2
1.2 Scope . . . 2
2 Frame of reference 3 2.1 Performance measurement systems - Definitions and purpose . . . 3
2.2 The KPI life cycle . . . 3
2.2.1 Design of performance measurement systems . . . 3
2.2.2 Implementation of performance measurement systems . . . 5
2.2.3 Use of performance measurement systems . . . 5
2.2.4 Review of performance measurement systems . . . 6
3 Methodology 9 3.1 Research design . . . 9
3.2 Research quality . . . 10
4 Contributions and summaries of appended papers 13 4.1 Paper 1 . . . 13
4.2 Paper 2 . . . 14
4.3 Paper 3 . . . 14
4.4 Paper 4 . . . 15
5 Present state analysis method 17 6 Synthesis of empirical findings 19 7 Discussion 23 7.1 Comparison of review frameworks . . . 23
7.2 Avoiding pitfalls through better design . . . 25
7.3 Research quality . . . 26
8 Conclusion 29
1. Introduction
The importance of aligning corporate strategy with manufacturing function has been well known since 1969, when Skinner (1969) described the missing link between corporate and manufacturing strategy. One way to create this alignment is to translate the strategy into strategic goals, which can be deployed through the organization in a performance measurement (PM) system. Today, most companies use a PM system to support both the strategic management process and the operations management process. The PM system helps in achieving a better basis for decision making, improves business financial results, improves insight into business performance, and improves the quality of the delivered products or services (Andersen et al., 2014).
In industry, the most used frameworks are the balanced scorecard and performance dashboards (Andersen et al., 2014). The balanced scorecard emphasizes the use of non-financial performance indicators and divides performance indicators into four perspectives: financial, internal processes, customer, and learning and growth (Kaplan and Norton, 1992). Many frameworks inspired by the balanced scorecard have been developed within the academic field of performance measurement systems and are commonly known as contemporary performance measurement (CPM) systems (Franco-Santos et al., 2012). The use of CPM has positive effects on communication processes, strategy development, implementation and review, and the behavior of employees, ultimately leading to improved performance in the organization (Franco-Santos et al., 2012). However, the use of a CPM is often time-consuming, which leads to increased costs; still, according to Andersen et al. (2014), the efforts required to use the PM system are generally far outweighed by the benefits generated.
To assure that the benefits of a PM system outweigh the efforts, it is important that the system is efficient (Neely and Bourne, 2000). To increase the efficiency of the PM system, “the trick is to measure as little as possible, but to ensure that you are measuring the things that matter” (Neely and Bourne, 2000). To achieve this, the life cycle perspective of the PM system is useful, since it encourages frequent reviews of the system. The life cycle of a PM system has four stages: design, implementation, use, and review (Bourne and Bourne, 2011). These perspectives have become even more important in today’s dynamic environment, where companies tend to change their strategies without revising their PM system (Melnyk et al., 2014). This might be one reason for the quickly-increasing number of performance indicators used in industry today (Salloum, 2013).
To make sure that a PM system is reviewed in a structured and systematic way, a review framework or method is needed. Several review frameworks and methods exist in the PM system literature (Dixon et al., 1990; Bititci et al., 1997b; Medori and Steeple, 2000; Kennerley and Neely, 2003), which reviews the PM system for a whole organization. The frameworks’ main focus is to ensure that the performance indicators are aligned with the strategic goals of the organization, and that the PM processes are efficient and effective. However, less attention has been paid to the interaction between sub-systems in the organization, and how different organizational units use their PM system. This research gap can be seen in the PM system research field (Choong, 2013) and is not limited to the review frameworks. A research gap also persists in how performance measures are used at lower levels within a manufacturing organization. Limited empirical research has been conducted in the PM field in this context, a fact confirmed by Van Camp and Braet (2016), who have identified a lack of empirical research about failures and successes in PM systems.
problem should be addressed in all phases of the PM system’s life cycle; however, this research will only study the design and review phases. Based on this identified problem, the following purpose is formulated for the research project.
1.1
Purpose and research questions
The purpose of this research project is to identify areas of improvement in PM systems and to develop a method to help companies review and design an efficient PM system. An efficient PM system provides the managers with important information about the performance of the processes in the organization, which will help managers make decisions based on facts, which in turn will increase the quality of the decisions. Well-informed decisions in line with the company strategy will likely increase the competitiveness of the company.
RQ1
How can the PM system be analyzed in a structured and systematic way? RQ2
How are PM systems designed and used in manufacturing companies ? RQ3
How can a PM system be designed to avoid common pitfalls identified in manufacturing companies?
1.2
Scope
This research is limited to operational PM systems and how to ensure that long-term strategic goals are incorporated into the set of performance indicators used. A strategic performance measurement system that incorporates business strategy is not included; therefore, the use of the PM system to challenge and formulate the operations strategy is not studied. The operations strategy with its strategic goals can be seen as the input to the studied process. Another limitation in scope is the focus on the production function and some of the support functions such as maintenance, quality assurance, and internal logistics. This limitation affects the results, since the performance indicators used in other functions in the organization (such as finance, human relations, marketing, and purchasing) are excluded in these studies.
2. Frame of reference
2.1
Performance measurement systems - Definitions
and purpose
Performance management is the process wherein the performance of the company is managed and the performance measurement system is an information system that provides managers with all relevant information from the various systems within the company (Bititci et al., 1997a). Several definitions exist concerning performance measurement systems, performance measurement, and performance measure, but the most-used definitions in the literature are those of Neely et al. (1995):
• “A performance measurement system can be defined as the set of metrics used to quantify both the efficiency and effectiveness of actions”
• “Performance measurement can be defined as the process of quantifying efficiency and effectiveness of actions”
• “A performance measure can be defined as a metric used to quantify the efficiency and effectiveness of actions”.
In addition to performance measures, which are quantitative whole numbers (Choong, 2013), the performance measurement system also consists of metrics and indicators. A metric is a fraction with a denominator that does not change easily (Choong, 2013). An indicator is used to show softer measurements and is set to a prescribed state, based on either qualitative or quantitative information from the process. In this thesis, the term performance indicator will be used for all three ways of showing the performance of processes.
Types of performance indicators differ. First, performance indicators can be either performance-oriented or result-performance-oriented (Parmenter, 2010), also called leading and lagging indicators. Within both the performance and the result indicators, some indicators are highlighted as key indicators that show critical success factors and how the performance can be improved more dramatically (Parmenter, 2010).
2.2
The KPI life cycle
The KPI life cycle consists of four stages: design, implementation, use, and review. The design stage consists of defining indicators and setting targets, which are introduced to the organization in the implementation stage. The advantage of the PM system begins to show in the use stage, where feedback and information from the PM system are provided to the managers. To ensure that the right indicators are used, a review stage is needed, wherein the relevance of the indicators are evaluated (Bourne and Bourne, 2011).
2.2.1
Design of performance measurement systems
Much research has been conducted on the topic of designing performance measurement systems or individual performance measures. Several frameworks have been developed to design both the set of measures (i.e., balanced scorecard and performance prism) and the individual measures (i.e., performance measurement record sheet).
Balanced scorecard
The balanced scorecard (BSC) was developed in the early 1990s by Kaplan and Norton (1992) and consists of four perspectives. The purpose of the framework is to connect the financial perspective with non-financial indicators through the perspectives of customers, internal business, and innovation and learning. The focus of the balanced scorecard framework is on the strategy and vision of the company, not on control of the processes. Therefore, the framework is not a replacement for the day-to-day measurement system in organizations (Kaplan and Norton, 1996). The balanced scorecard framework does not only include the measures in the perspectives but also the causal links between measures in different perspectives. These causal links show how all measures are linked to the financial measures, since the measures in the customer perspective affect the financial measures, the internal business measures affect the customer measures, and the learning measures affect the internal business measures. Due to the causal links between the measures in the different perspectives, sub-optimization can be avoided with this framework, since managers can see how changes in one measure affect measures in other perspectives.
Performance prism
The performance prism is a framework consisting of five interrelated facets (Neely et al., 2001). The purpose of this framework is to assist in the selection of performance measures by encouraging managers to think about links between measures in a new way. The first facet concerns stakeholder satisfaction and asks the managers: “Who are the stakeholders and what do they want and need?” The second facet involves determining which strategies are required to ensure the stakeholders’ wants and needs; in the third facet, the processes needed to deliver the strategies should be identified. The fourth facet asks the managers what capabilities are required to operate the identified processes. As the fifth facet, Neely et al. (2001) also include the contribution of the stakeholders to the company’s performance.
Performance measurement record sheet
The performance measurement record sheet is a framework used to design and document individual performance measures. The framework consists of the following 10 elements, which must be addressed and documented for each measure (Neely et al., 1997):
1. Title 2. Purpose 3. Relates to 4. Target 5. Formula 6. Frequency 7. Who measures? 8. Source of data 4
9. Who acts on the data? 10. What do they do?
The framework provides managers with a structure to support the process of designing individual performance indicators by asking questions about the elements that are required for a “good” performance indicator. For example, why do we need to measure this performance indicator (purpose), or what actions do we need to take in order to improve the performance and reach our targets (Who acts, what do they do)?
2.2.2
Implementation of performance measurement systems
Franco-Santos and Bourne (2005) describe implementation as “the stage in which a BPM system and its procedures are put in place.” This stage in the KPI life cycle is affected by several factors found in change management theories, and three factors have been identified by Franco-Santos and Bourne (2005) as facilitating effective implementation of a performance measurement system. The first factor is top management agreement and commitment, wherein the top management must agree and commit to the strategic goals and performance measures that are to be implemented in the organization. The second factor consists of three parts: empower, enable, and encourage, which all are related to the needs of people working with the PM system. It is important that people from different functions within the organization are involved in developing the PM system (empower), since their different areas of expertise and knowledge are very useful. The next part (enable) highlights the importance of education and training for employees working with the PM system, to make sure that they know how to use the PM system effectively. The last part (encourage) encourages people to use the information from the PM system by creating actions and activities to motivate all employees. The final factor that enables effective implementation of PM systems is communication. Communication should be used both to clarify different aspects of the performance measures and to provide feedback from the results of the measures. A common hurdle to successful implementation of PM systems is poor IT infrastructure within an organization (Bourne and Bourne, 2011). A good IT platform should be an information system that is designed not only to maintain the PM system but also to handle simple rules, such as alarm signals and warning notices, based on the data (Bititci et al., 2000). It is also important that the IT platform for the PM system is integrated with the other business systems used within the organization (Bititci et al., 2000).
2.2.3
Use of performance measurement systems
The use of the PM system can be divided into two different parts, strategy implementation and decision making (Jääskeläinen and Luukkanen, 2017). Both parts can be visualized as processes in which PM data is used. The strategy implementation process starts by setting targets, which are monitored, and based on the results, actions are created to reach the target. This process can also include a review of the strategy, in which the strategy is evaluated based on the PM data. In the decision-making process, problems are identified based on the PM data, and then different actions are developed and evaluated before the chosen action is taken (Jääskeläinen and Luukkanen, 2017). The problem identification process can be further divided into data collection, analysis, and interpretation of the results (Bourne and Bourne, 2011). When it comes to making decisions, visualization is a powerful tool that creates a vivid picture of the operations and communicates the understanding to the managers who are making the decision (Bititci et al., 2016).
One commonly used tool for visualization of performance data is control charts, which highlight the natural variation in the performance of the process (Bourne and Bourne, 2011). One key factor to achieving effective use of the PM system is to have clear management processes (Franco-Santos and Bourne, 2005). One of these processes is meetings wherein the PM system is discussed. It is important to have regular meetings that are attended by the managers who are responsible for the performance being measured (Bourne et al., 2000). The frequency of the meetings depends on what type of performance is discussed, but for strategic implementation, monthly meetings are recommended.
2.2.4
Review of performance measurement systems
In order to keep the performance measurement system up to date, it is important to review the set of performance indicators in order to make sure that all of them are relevant and to determine whether any are missing. There are four levels of reviewing performance measurement systems (Bourne et al., 2000):
1. Reviewing targets
2. Developing individual measures 3. Reviewing set of measures
4. Challenging strategic assumptions
Levels 1-3 relate to the design, implementation, and use of the PM system in order to assess the implementation of strategy, while level 4 focuses on challenging the strategic assumptions (which fall outside the scope of this thesis). The first two levels should be reviewed periodically, since organizational circumstances are continuously changing and the frequency of the review depends on the organization and the measure itself (Najmi et al., 2012). Level 3 should not be reviewed periodically; according to Najmi et al. (2012), the review should be trigged by:
• New stakeholder’s needs • New strategy
• New process or operational system • New opportunity or capability • Invalid strategic assumption • Invalid strategy
Review frameworks
Several frameworks exist for auditing or reviewing performance measurement systems. In this section, four frameworks are reviewed: the performance measurement questionnaire (Dixon et al., 1990), the integrity and deployment audit (Bititci et al., 1997b), a review framework by Medori and Steeple (2000), and the reflection phase of the evolution cycle (Kennerley and Neely, 2003).
The performance measurement questionnaire is a tool developed by Dixon et al. (1990) that helps organizations change their performance measures. The questionnaire is used to collect
data and consists of four parts: data about the respondent, improvement areas, performance factors, and personal performance metrics. The first part (data about the respondent) is used to classify the respondents based on their location, the hierarchical level they work in, which function they belong to, etc. In the data collection for the second part (improvement area), the respondents are asked to rate the long-term importance of an improvement and the effect of current performance measures on the improvement area. The third part uses the same structure as part 2 but focuses on performance measures, and the respondent rates a set of performance measures concerning their relative importance to the company and the organizational emphasis on the specific measure. In the last part of the questionnaire, the respondents are asked to describe the most important performance measures that measure their individual performance at five different time frames (daily, weekly, monthly, quarterly, and yearly).
The data from the questionnaire is analyzed through four different analyses: alignment analysis, congruence analysis, consensus analysis, and confusion analysis. The alignment analysis analyzes the alignment between the strategy, the most important improvement areas, and the most emphasized measures. In the congruence analysis, gaps and false alarms are identified for parts 2 and 3 by comparing the importance of the improvement area with the effect of current performance measures on the improvement area (part 2), and by comparing the relative importance of the performance factor to the company with the emphasis of the measure (part 3). The last two analyses are connected to the consensus of the answers in the questionnaire. The consensus analysis deals with the differences in perception between different organizational levels and functions, and the confusion analysis identifies the level of consensus within a group about the improvement areas and performance measures.
Bititci et al. (1997b) have developed a review framework consisting of 3 phases: data collection, integrity audit, and deployment audit. In the data collection phase, data are collected on strategic business units and their market requirements and objectives, as well as on performance measures for the executive management team and for each function or business unit. Data are also identified concerning personal objectives and incentives, responsibilities of review, reporting, and performance. The integrity audit reviews how well the PM system is able to promote integration among the different parts of the organization. The framework used for this audit is the viable systems model developed by Beer (1979), which states that a system must have 5 different components or systems. The five systems from a PM system perspective are described by Bititci et al. (1997b) as:
• System 1 – The operational unit that produces products and consists of performance measures for a business activity.
• System 2 – Management system that coordinates the activities of the operational units and measures the performance of the business processes.
• System 3 – Sets targets and priorities for systems 1 and 2, focuses on deploying strategies and priorities to the operational system. It also monitors the performance of system 1. • System 4 – This system focuses on the external environment and the performance
measures used are often comparative.
• System 5 – Sets the corporate policies and objectives, is responsible for setting corporate targets and priorities.
The deployment audit consists of three stages that are assessed through a series of matrices (Bititci et al., 1997b). The first stage concerns how the environmental requirements are deployed trough business objectives, the second stage reviews how the business objectives are
deployed through strategic performance measures, and the third stage focuses on how the strategic performance measures are deployed to functional levels.
In the review framework developed by Medori and Steeple (2000), a new set of performance indicators are designed that are based on a performance measurement grid that combines the competitive priorities and the strategic requirements of the organization. This set of new performance indicators is then compared to the existing performance indicators used in the organization to identify gaps or false alarms. A gap is defined as a performance indicator in the new set that do not exist in the current set of performance indicators, which indicates that the new performance indicator must be included in the PM system. A false alarm occurs when a performance indicator in the existing set of performance indicators is not present in the newly-designed set of performance indicators. This means that this performance indicator does not help the organization achieve their strategic goals and should therefore be excluded from the PM system.
Kennerley and Neely (2003) have developed an evolution cycle for effective evolution of performance measurement systems. The cycle consists of three phases: 1) Reflection to identify the need for enhancements and the measures that are no longer appropriate, 2) Modification of the system based on the findings in the reflection, and 3) Deployment of the modified measurement system. The reflection phase corresponds to the review step in the KPI life cycle.
The reflection phase is divided into reflection on individual measures, on the set of measures, and on the infrastructure of the performance measurement system. The performance measurement record sheet has been proposed as suitable to use when reflecting on the individual measures, and it presents a set of tests for the relevance of the measure. The set of performance measures can be reflected on by the support of the frameworks developed for selecting measures (i.e. balanced scorecard) or by the performance measurement questionnaire. The goal of this part of the reflection is to consider whether the measures are balanced, aligned to strategies, comprehensive, and consistent. The last part of the reflection involves assessing the effectiveness and efficiency of processes connected to the performance measurement system (data acquisition, sorting, analysis, interpretation, etc.).
The four frameworks are compared and analyzed further in section 7.1.
3. Methodology
3.1
Research design
The qualitative research approach seeks to capture the ways of living and doing in diverse milieus and subcultures (Flick, 2014). The research is often inductive, that is, the concepts and theories that are developed are based in data (Bryman and Bell, 2015). A strong emphasis is placed on descriptive context and on trying to see the studied phenomena through the eyes of the people being studied (Bryman and Bell, 2015). Qualitative research is also characterized by the flexibility and limited structure of the methodology. A limited structure helps the researcher see through the eyes of the people, as it might reveal different perspectives (Bryman and Bell, 2015).
The inductive approach used in this research project drives the use of a qualitative research design. The research is not based on an existing theoretical framework but rather on empirical findings that are later compared to existing theories. The perceptions of the people working with the PM systems in the studied companies are an important part of this research, since the perceptions of the users might help us explain problems persist around the PM system at companies despite the large amount research in this area.
In this research project, a mix of case study, comparative study, and cross-sectional methods was used. A comparative study observes and compares specific dimensions between multiple cases; however, there is a risk of neglecting the context and inherent structures in the cases (Flick, 2014). The cross-sectional research design focuses on general findings from several cases (compared to the comparative study, which focuses more on differences between individual cases) (Bryman and Bell, 2015). A case study gives a precise and detailed description of one case, however, generalization is a problem, due to the focus on only one specific case (Flick, 2014). All data collection will only give a snapshot of the organizations at the time of the study. This affects the findings, since the studied system is dynamic and changes frequently within the organizations. The research project consisted of three separate studies connected to the three research questions, which are summarized in Table 3.1.
Research question Data needed Appropriate research
design How can the PM system be
analyzed in a structured and systematic way?
General information about the PM systems in different organizations to test the analysis method.
Multiple case study research design (Study 1) (Bryman and Bell, 2015)
How are PM systems designed and used in manufacturing companies?
General information about how PM systems are designed and used in different organizations.
Comparative research design (Study 1) and case study research design (Study 2) (Bryman and Bell, 2015) How can a PM system
be designed to avoid common pitfalls identified in industry?
In-depth information about the common pitfalls in industry and how they can be avoided.
Cross-sectional research design with expert interviews (Study 3) (Bryman and Bell, 2015)
Table 3.1: Connections between research question, needed data, and research design
of how PM systems are designed and used in manufacturing companies, as well as to identify whether any differences exist between the different companies. This study also tested the present state analysis method, developed to answer RQ1. Qualitative interviews were conducted with managers in order to collect data that would aid understanding of the strategic goals of the company and the intended use and design of the PM system. The interviews were analyzed and documented in a standardized form. Quantitative data was collected through observations and documentation of all indicators used at the company. The collected data was documented and quantitatively analyzed, then presented in bar and pie charts. The results from the qualitative and quantitative analyses were then combined into the conclusion of the whole study. In this section, differences and similarities were identified between the findings in the qualitative and the quantitative analyses.
To deepen understanding of the design and use of PM systems in Swedish manufacturing companies, a case study was performed in study 2. The research design was chosen because in-depth descriptions are needed of how the current system works, which stakeholders that are involved, and what requirements are present in the newly designed system. In this study, the data was collected using the same method as in study 1 except for the interviews; this was recorded and transcribed in study 2. More interviews were conducted within the same organizations in study 2.
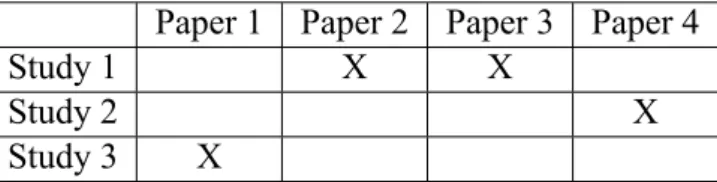
For Study 3, a cross-sectional research design was adopted to identify common pitfalls within the companies studied in study 1. In this study, data was collected by an open question posed to PM experts in the company about which pitfalls (related to the PM system) they have identified in their organizations. The aim for this study was not to compare the companies but to get a more general understanding of common pitfalls within the studied context. The results from studies 1, 2, and 3 will contribute to four conference papers, as seen in table 3.2.
Paper 1 Paper 2 Paper 3 Paper 4
Study 1 X X
Study 2 X
Study 3 X
Table 3.2: Connection between studies and papers
3.2
Research quality
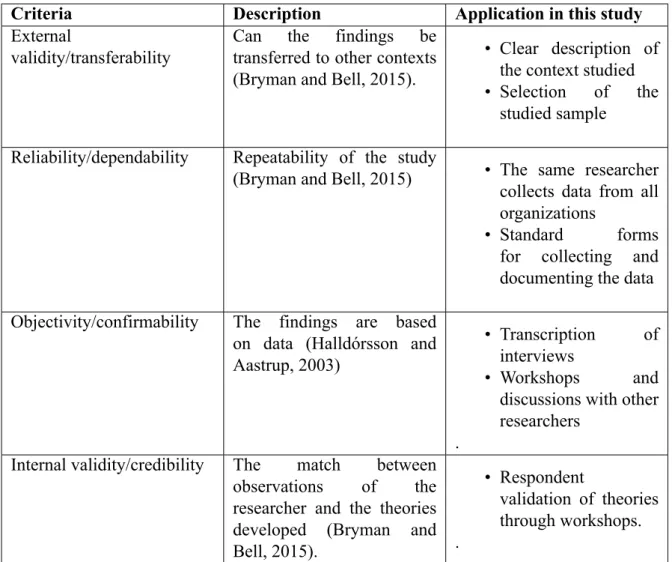
Traditional research quality criteria might not be suitable for qualitative research design. Therefore, Halldórsson and Aastrup (2003) propose the use of trustworthiness as a quality criteria instead. The criteria within trustworthiness include transferability, dependability, confirmability, and credibility, as summarized in table 3.3. When it comes to qualitative research, true generalization is not possible (Halldórsson and Aastrup, 2003), since the findings depend on the context or social world in which they are studied (Bryman and Bell, 2015). Instead, the quality criterion of transferability is used, which refers to the ability to transfer the findings into other contexts. To make this possible, it is important to provide the reader with a detailed description of the context so that the reader can make a judgement of whether the findings can be transferred to a new context. In these judgements, the similarities between the studied context and the new context to which the findings are applied are evaluated (Halldórsson and Aastrup, 2003). In addition, the selection of the studied samples or cases affects the ability to describe the context and therefore the transferability. In qualitative
research, it is most common to use purposive sampling, in which the samples are selected in a strategic way related to the research questions and not on a random basis (Bryman and Bell, 2015). The dependability of the findings corresponds to the traditional quality criterion reliability, which indicates the repeatability of the study and the findings (Bryman and Bell, 2015). To assure dependability, an audit from peers is often employed. This audit is based on the documentation of the process as well as on the method decisions made during the study (Halldórsson and Aastrup, 2003). Confirmability of the findings refers to the potential bias of the researcher and that the researcher has acted in good faith (Bryman and Bell, 2015). This can be assured by tracing the findings back to the data collected in the study (Halldórsson and Aastrup, 2003) and by having peers audit the findings and the research process (Bryman and Bell, 2015). The last quality criterion in trustworthiness is credibility, which describes the match between the respondent’s or study object’s perception of reality and the researchers’ understanding of this (Halldórsson and Aastrup, 2003). This can be assured by following good research practice and by confirming the findings with the members of the studied social world (Bryman and Bell, 2015).
Criteria Description
External
validity/transferability
Can the findings be transferred to other contexts (Bryman and Bell, 2015).
Reliability/dependability Repeatability of the study (Bryman and Bell, 2015)
Objectivity/confirmability The findings are based on data (Halldórsson and Aastrup, 2003)
Internal validity/credibility The match between observations by the researcher and the theories developed (Bryman and Bell, 2015).
4. Contributions and summaries of
appended papers
4.1
Paper 1
Title of paper: A life cycle approach to business performance measurement systems.
The purpose of paper 1 is to shed light on common pitfalls related to the performance measurement systems in industry. To fulfill this purpose, the following two research questions were studied:
• Which pitfalls related to performance measurement systems are present in Swedish manufacturing companies?
• How can these pitfalls be avoided?
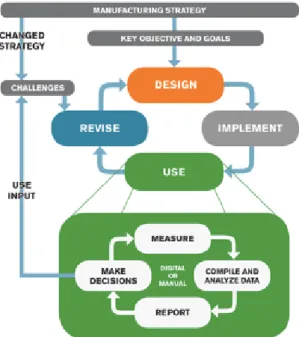
To answer the first research question, performance measurement experts within the studied companies were asked to describe pitfalls related to their PM system. These descriptions were then discussed in a work shop with both experts from industry as well as the researchers in this project. For the second research question, a model was developed in a workshop with the researchers in the project. The model was based on the knowledge gained by the researchers throughout the project, such as the present state analysis described in paper 2 and several other case studies. Eight groups of pitfalls were identified from the answers of the PM system experts in the studied companies: strategic connection, design of performance measurement system, design of performance indicators, target setting, support systems and verification, visualization of performance indicators, use of performance indicators, and revision of performance indicators. To help companies avoid these pitfalls, an extended version of the KPI life cycle by Bourne and Bourne was developed (see figure 4.1). In the extended version, the use phase has received its own cycle, showing the different stages in how to use the performance indicators, and the strategic connection has also been highlighted in the model to show how it affects the design and revise phase of the KPI life cycle.
4.2
Paper 2
Title of paper: Present state analysis of business performance measurement systems in large manufacturing companies.
The purpose of paper 2 is to present a methodology and initial results from a present state analysis of performance measurement systems. The following three research questions are addressed in the paper:
• Is a methodology that is based on a combined bottom-up and top-down approach for analyzing PM systems applicable to the case companies?
• What is management’s view of the structure and function of the PM system, and how does the PM system life-cycle function at a particular company?
• What performance indicators are used for operation control and follow-up purposes at different hierarchical levels, and what is the associated cost?
The methodology developed and presented in the paper combines both a bottom-up and top-down approach. The top-top-down view of the PM system is studied by interviewing managers and mapping management’s view of the structure and use of the PM system. The bottom-up approach focuses on mapping the actual performance measures used within the organization and documenting them in a standardized form based on the performance measurement record sheet (Neely et al., 1997). To be able to compare the results between different organizations or organizational units, all performance measures are categorized into 12 different topics. This method also includes a cost estimation for parts of the use phase by collecting the time that is spent on meetings where the results of performance measures are discussed.
The analysis method was used at 7 different factories located in Sweden, which are part of 6 large multinational companies. When it comes to the top-down approach, one can see that the factories have similar structures and uses of the PM systems, with only small variations in the different perspectives they used to structure their performance measures. A difference was also seen in the maturity of the PM system life cycle in the companies, especially in the review phase. The results from the bottom-up analysis showed differences in the number of performance measures used, the time spent on meetings discussing the result of performance measures, and the distribution of performance measures among the categories. However, the distribution of performance measures between categories corresponded to the categories that the specific company uses to structure their performance measurement system.
4.3
Paper 3
Title of paper: Performance indicators at different organizational levels in manufacturing companies.
It is important to recognize that the suitable performance indicators for an organization or department vary, both within companies and between organizations. Therefore, the purpose of this paper is to study how performance is measured at different levels within organizations, to highlight the different needs of performance indicators at different levels in an organization. The following research question will be answered:
• What are the differences in performance indicators used at different organizational levels?
This paper uses the same data as in paper 2, which was collected through interviews and documentation at the companies. The factories are divided into three organizational levels in the analysis: site, area, and work center. Four analyses were performed. First, the number of performance indicators used at each organizational unit in the different levels was calculated, and the mean value within each level was compared. The second analysis concerns the topic of performance indicators used within each level. Here, the distribution between the performance indicators at each level is used to rank the topics based on the number of performance indicators in each topic. The third analysis studied the frequency of measuring or reporting the results for the performance indicators. The performance indicators were divided into indicators that are measured more than once a day, daily, weekly, monthly, or less than monthly. The last analysis studied which types of performance indicators are most used at the different levels. The performance indicators were divided into four types of indicators: rates, ratios, absolute values, and status indicators.
The results show that the number of performance indicators increases in higher organizational levels. The topics used on the area and work-center levels were similar, but different than the site level. On the site level, more focus was paid to financial, productivity, and supply-chain performance indicators, and less focus paid to performance indicators related to safety, speed, and equipment. The frequency of measuring and reporting the results of the performance indicators can be seen to decrease in the higher levels. With the fourth analysis examining the types of performance indicators, the results show that the type of performance indicator spans from more advanced types of indicators (mostly rates and ratios) in the higher levels to simpler type of indicators (mostly absolute values and status indicators) in the lower levels.
4.4
Paper 4
Title of paper: Review of a performance measurement system at shop-floor level.
This article describes how the analysis method described in paper 2 can be used to evaluate the efficiency of the PM system of an organizational unit. To evaluate the efficiency of the PM system, two research questions were formulated:
• Are the performance indicators measured adequate considering the performance objectives?
• Does the performance measurement system efficiently support the decision making, operational as well as strategical?
The method used in this paper is based on the method described in paper 2. The first step was to identify which performance indicators are used by the organizational unit, and to identify the stakeholder for the PM systems for the organizational unit. The identified performance indicators were documented according to the set list of items presented in paper 2. The next step was to interview the identified stakeholders of the PM system, with the purpose of identifying which performance indicators they use and how they communicate targets and results with other stakeholders. To answer the first research question, it is assumed that the indicators used in the policy deployment report sheet at the level above the organizational unit, represents the performance objectives of the organization. Since the performance measurement system is structured with 7 categories that are used within all levels in the factory, it is easy to follow how the performance indicators used in the organizational unit are related to the performance objectives. In addition, the structured annual process of deploying
new targets and goals from the factory management ensures that the performance indicators are aligned with the performance objectives.
For the second research question regarding how efficiently the PM system supports decision making, it was found that the organizational unit uses their performance measures for two different purposes. On the one hand, they have a policy deployment process that translates performance objectives into targets and actions. The policy deployment process has weekly meetings, with the main focus on the actions that they are working with and less focus on the results from the performance measures (only once a month). On the other hand, the second use of performance measures is daily visual management meetings, in which the results of daily operational indicators are discussed only to identify deviations. No actions are discussed during these meetings, but if a deviation is identified, a group of employees affected by the deviation discuss actions to solve the deviation outside the daily visual management meeting. This division of the meetings gives an efficient use of the performance measures, as the focus on each meeting is clear.
5. Present state analysis method
To answer the first research question, a present state analysis method (PSAM) was developed. The data needed for the analysis was collected using the method described in paper 2. The PSAM consists of two analysis steps: rationalization and standardization of performance indicators, and alignment between strategic objectives and performance indicators at different organizational levels.
The first step in the PSAM is to analyze the rationalization and standardization potential within the PM system. The purpose of this analysis is to review the set of unique performance indicators in order to spot redundancies. The analysis consists of pair-wise comparison of the identified indicators to determine whether they are:
1. Measuring the same thing – The indicators measure the same parameter, even though they have slightly different definitions, visualizations, or names.
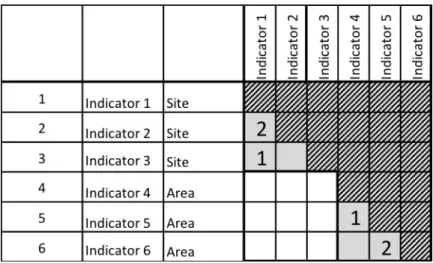
2. Having the same purpose – The indicators measure different parameters but they are measured for the same purpose (e.g., employee attendance and employee absence). The analysis is structured and documented in a matrix (see figure 5.1) and can be done either for the whole site or for each hierarchical level within the site.
Figure 5.1: Example of rationalization potential matrix.
The results from this analysis at one of the studied factories, which had 432 unique performance indicators, showed that 3% of indicators in the different categories were measuring the same thing, with a variation within the different categories from 0-13%. Moreover, 3% of the indicators had the same purpose with a variation within the different categories from 0-18%. This indicates a good standardization of the indicators being used; however, there is still room for rationalization and standardization of the performance indicators to reduce the number of different performance indicators used in the factory.
To analyze whether the performance indicators are aligned with the strategic goals, a second analysis was performed. The purpose of this analysis was to determine whether the strategy deployment process at the company is working as intended, and whether all strategic goals of the company are cascaded down to the work-center level. It is also important to identify which performance indicators are not directly related to any performance measure at the level above. The analysis starts by determining the relations between the strategic goals of the company and the performance indicators used at the site level. Then, the performance indicators at area level
are related to performance indicators at site level; finally, the performance indicators at the work-center level are related to the performance indicators at the area level. The relations between performance indicators at different hierarchical levels are categorized into:
• Aggregation of the same performance indicator (e.g., addition of the performance indicator at the work units within an area to get an indicator for the entire area).
• Mathematical relation between the performance indicators (e.g. subset of another performance indicator or part of a ratio or rate).
• Other logical relation between the performance indicators (e.g. the number of incidents and risks influence the number of accidents and injuries).
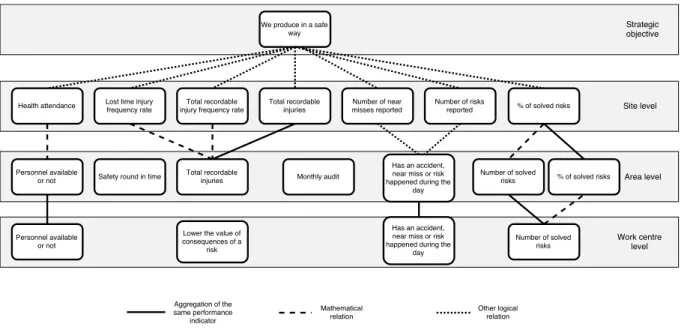
To visualize the results, a tree diagram is created (see figure 5.2).
Figure 5.2:Example of diagram showing relations between strategic goals and performance measures.
As can be seen in the example in figure 5.2, three performance indicators do not have a clear relation to the indicators on the other levels. This does not mean that they need to be removed, but the purpose of these indicators should be revised to make sure that they are relevant to the organizational level where they are used. It should also be said that the tree diagram is a simplification of all the relations within the factory. For example, no relation among measures within one organizational level is shown in the tree diagram, and for larger factories, it is often necessary to make one tree diagram for each category or strategic objective of the factory, to avoid too large diagrams that are hard to read.
6. Synthesis of empirical findings
To answer research questions 2 and 3, the empirical findings from the appended papers are combined into a synthesis in this section. The pitfalls identified in paper 1 will be used to structure the discussion, and the findings from the other papers will explain how the studied companies’ performance measurement systems are designed to avoid the pitfalls.
Strategic alignment
The first pitfall is related to how the companies’ strategies and goals are connected to the performance indicators. The company representatives identify performance indicators that are not clearly related to the strategic goals, but when looking at the results in papers 2 and 3, it is clear that processes are available to avoid this problem. Paper 2 shows that most of the companies design their performance indicators based on the strategic goals of the factory, and the studied production unit in paper 3 has a well-developed policy deployment process that breaks down the strategic targets, from the factory to the shop-floor, in a structured way.
Design of the PM system
Several pitfalls have been identified as connected to the design of the PM system itself. First, there are problems of having too many performance indicators, which can be seen in the empirical findings in paper 2, where the studied companies have 15-20 performance indicators per organizational unit. The structure of the PM systems is related to several of the pitfalls in this category. The findings from paper 2 show that all the studied companies structure their PM systems into 4-8 categories, into which all the measures are sorted. These categories are often connected to the overall goal of the company and can be found at all levels in the factory. This structure will help managers to avoid this pitfall related to aligning with the strategic goals of the factory, but the structure can also cause a pitfall of not understanding the relation between different performance indicators in different categories. The policy deployment process described in paper 4 might also affect the imbalance between leading and lagging indicators, since most of the performance indicators that are broken down to the shop-floor level are lacking performance indicators that shows the results of the unit.
Design of performance indicators
When it comes to the design of the individual performance indicators, one common pitfall is that the organizational unit that measures it can’t affect the results of the performance indicator. This is related to the findings in papers 3 and 4. As seen in paper 4, the used performance indicators differ between different organization units and levels, depending on how they use the information. A more general finding is presented in paper 3, where differences in topic, type, frequency, and number of performance indicators are studied among different organizational levels.
Target setting
Several pitfalls are related to target setting, despite much previous research about how to design and set targets. One common problem is the lack of long-term thinking, which also is related to the problem of adjusting targets to show improvements even if there aren’t any. To solve these problems, a well-defined design process (as described in paper 1) is needed.
Visualization
Too aggregated performance indicators, and indicators that do not show the variation and trends in the results, are common pitfalls related to visualizing the results of the performance indicators. This is related to the findings in paper 3, where the type of measures varies between each organization level. The type of indicator has a large impact on how the results can and should be visualized. For example, for the status indicators, trends and variations are not needed, since their purpose is to only show the status for the last time period. If we want to analyze the trends and variations, we need more information, and not just about whether we are on target or not. Therefore, the purpose of the performance indicator also affects how the data should be visualized in order to make sure that the right information is presented in a clear and understandable way.
Use of PM system
When it comes to using performance indicators, most problems are related to actions or lack thereof. Using performance indicators to decide and take actions without understanding them, or using them for benchmarking in an unfair way, can create more problems than the actions that were taken can solve. The findings in paper 2 show that only two of the factories use their operational performance indicators for benchmarking between factories. When it comes to actions, most companies have meetings to discuss the results of the performance indicators and to decide on new actions. Paper 2 reveals that all companies have monthly and daily meetings; the monthly meetings focus on strategic and more long-term decisions and actions, while the daily meetings focus on production control to identify deviations and to create actions that reduce the risk of future deviations. However, when paper 4 is examined, the results are a bit different. Their daily production control meetings focus only on the current state and deviations, and no actions are created during these meetings. The actions are discussed in weekly meetings, where the focus is to follow up and discuss the progress of different actions and only every third meeting focuses on the results of the performance indicators.
Review of PM system
The last pitfall relates to lack of reviewing and redesigning the PM system, which leads to a static and irrelevant system. To avoid this, half of the studied companies in paper 2 have a yearly review process for their performance indicators where they break down new performance indicators from factory management. This process is often called policy deployment. All companies do review their targets every year. This difference can occur because the reasons for reviewing are different for performance indicators and targets. For performance indicators, the trigger for review is changes in strategy and new challenges,
although the targets need to be regularly reviewed as described in section 2.2.4. When a review of the PM system and the performance indicators is triggered, it is important to follow a structured approach for the review by using the method described in paper 2 and chapter 5.
Summary
Most of the studied companies have processes to avoid most identified pitfalls; however, the level of maturity of the different processes varies among the different studied companies. All four stages in the KPI life cycle are addressed by all the studied companies, but companies need to focus more on reviewing existing performance indicators and how they are used. The existing processes for reviewing performance indicators focuses mainly on deploying new strategic performance indicators, while there is no clear process for reviewing the existing operational performance indicators.
7. Discussion
7.1
Comparison of review frameworks
Several review frameworks already exist within the field of performance measurement, which are described in the literature. In the following section, PSAM will be compared to four of these frameworks: performance measurement questionnaire (Dixon et al., 1990), the integrity and deployment audit (Bititci et al., 1997b), a review framework by Medori and Steeple (2000), and the reflection phase of the evolution cycle (Kennerley and Neely, 2003).
The performance measurement questionnaire (Dixon et al., 1990) differs markedly from the PSAM. The biggest difference is the use of a questionnaire, which gives the respondents’ perceptions of the improvement areas and performance measures, while the PSAM has an external reviewer collecting the data in a more objective way. The forms also differ in that the analysis in the performance measurement questionnaire is based on a predetermined set of performance indicators, while the PSAM only gathers data about the performance indicators that are used in the studied organization. When it comes to the analysis of the data from the performance measurement questionnaire, some similarities appear with the PSAM. The alignment analysis and congruence analysis have similar purposes as the strategy alignment analysis in the PSAM, but the consensus and confusion analysis are not a part of the PSAM. However, the difference in the performance indicators used in the different organizational levels and functions can be analyzed based on the data collected in the PSAM (see the analysis in paper 3).
The data collection method in the framework by Bititci et al. (1997b) and in the PSAM are similar. Both frameworks collect data about the strategic objectives for the organization, the performance indicators used at different levels in the organization, and the processes and responsibilities related to the PM system. However, the framework by Bititci et al. (1997b) collects data at a higher level in the organization than the PSAM, e.g. market requirements for different business units and how they are translated to objectives and strategic measures while the PSAM starts with the strategic measures or goals and focuses only on how they are operationalized. The PSAM does not include an integrity audit, but the data for determining whether the first three systems exist can be found in the top-management interviews, where the top-management is asked questions about how the PM system is designed, used, and reviewed. However, system 4 and system 5 lie outside of the scope of the PSAM. The connection between the strategy and the performance indicators is reviewed in both the PSAM and the framework by Bititci et al. (1997b). This is carried out by looking at the deployment of the strategic goals through the organization; however, as in the other phases in the framework by Bititci et al. (1997b), the first two steps in the deployment audit lie outside the scope of the PSAM. Another difference is the work procedure for doing the review: in the framework by Bititci et al. (1997b), the deployment is assessed through a series of matrices, while in the PSAM, a tree diagram is used to map the deployment of the strategic goals.
The biggest difference between the framework by Medori and Steeple (2000) and the PSAM is the starting point. Medori and Steeple (2000) start by designing a set of new performance indicators, while the PSAM focuses only on the performance indicators that already exist in the organization. The strategic connection receives more attention in the framework by Medori and Steeple (2000), while the PSAM focuses more on the operational performance indicators. One similarity is the identification of gaps and false alarms, which is used in both frameworks. In Medori and Steeple (2000), the gaps and false alarms are found when comparing the new set
of performance indicators with the existing set, while in the PSAM they are identified in the alignment analysis, where the performance indicators used at different levels are connected to the strategic goals of the organization.
The reflection phase of the evolution cycle by Kennerley and Neely (2003) differs from the PSAM since it also includes an analysis or reflection about the effectiveness and efficiency of the process, as compared to the PSAM, which only identifies whether the processes are present in the organization or not. Another difference is the scope of the frameworks. Kennerley and Neely (2003) propose to use the balanced scorecard framework to review the set of measures, which focuses mostly on strategical measures while the PSAM mainly focuses on the performance indicators used in the internal business perspective in the balanced scorecard. Some similarities also exist between the two frameworks. For example, the individual performance indicators are analyzed using the performance measurement record sheet, although the framework by Kennerley and Neely (2003) focuses more on analyzing the individual performance indicators, and proposes several different tests to evaluate these performance indicators. They also propose to use the performance measurement questionnaire to reflect on the set of indicators, which also have some similarities and differences with the PSAM.
From the discussion above, similarities and differences can be seen between the PSAM and previously developed review frameworks. The differences and similarities are summarized in table 7.1. Dixon et al. (1990) Bititci et al. (1997b) Medori and Steeple (2000) Kennerley and Neely (2003) PSAM Scope - focus Strategic X X X X Operational X Data collection Questionnaire X Strategic objectives X X X X Performance indicators X X X X Processes X X X Analysis Strategic alignment X X X X X Consensus X Integrity audit X Process effectiveness and efficiency X Individual indicators X Rationalization X
Table 7.1: Differences and similarities between review frameworks.
All frameworks analyze the connection between the strategy of the organization and the performance indicators used. However, the PSAM has a different scope than the other
frameworks, since it focuses mainly on the design and use of operational performance indicators, while the others focus more on how strategy is translated into strategic performance indicators. The framework that is most similar to the PSAM is the integrity and deployment audit framework by Bititci et al. (1997b), which has a similar data collection method but a wider scope than the PSAM and also audits the integrity of the system. None of the previously developed review frameworks analyze the standardization of the individual performance measures, which is performed in the PSAM’s rationalization potential analysis. This analysis will help the company ensure that they have a common definition of the performance indicators within the organization as lack of common definition is one of the common failures identified by Van Camp and Braet (2016). Without a common definition within the organization, the communication between different functions and between hierarchical levels becomes harder, since the same measure might have different meanings. This problem also affects the benchmarking between different sites or operational units, since they might measure and interpret the indicator in different ways. The rationalization potential analysis also looks into whether two or more indicators have the same purpose. This part of the analysis will help the company to reduce the number of different performance indicators used in the organization.
7.2
Avoiding pitfalls through better design
All pitfalls described in the synthesis chapter, except the ones related to target setting and benchmarking, can also be found in the taxonomy of failures developed by Van Camp and Braet (2016). This work indicates that the common failures identified in the literature exist in practice, and it also gives an indication of which failures or pitfalls found in literature are most important to practitioners.
Since most of the pitfalls already are identified in the literature, theoretical solutions to most of them abound, which is interesting to compare to how the studied companies design and use their PM systems to avoid these pitfalls. This discussion will contribute to the theoretical field by verifying the pre-existing theories in the literature by an empirical study of several companies based on interviews, documentation of the company’s performance measures, and observations.
Strategic alignment
The importance of alignment between the performance indicators and the organization’s strategy is clear in the literature, since most design frameworks start with the strategy and then translate it into performance indicators through different steps or perspectives (e.g., balanced scorecard (Kaplan and Norton, 1992)). Other literature describes an ongoing strategy deployment process that is similar to the one used at the studied companies. This process includes several feedback loops, where the goals and performance indicators are discussed between different hierarchical levels of the organization (Hutchins, 2008). This process starts at the top of the organization and deploys the strategy and targets down through the organization.
Design of PM system and performance indicators
To make the design process and strategy deployment easier, the PM system is structured into several categories that are aligned with the overall vision and strategy of the company. This structure is similar to the balanced scorecard by Kaplan and Norton (1992), but the perspectives are adjusted to the operational settings instead of to the strategic view of the entire company. When it comes to designing and documenting individual performance indicators, the structure and process vary among the different studied companies. One of the companies has an IT-system where most of the measures are documented with a definition and the results, while most of the studied companies only have a standardized definition of the performance indicators that are used and deployed on the site level. This can be seen in the results of the rationalization potential analysis, which show a potential for improving in this area in reducing the number of different definitions and performance indicators, in order to reduce the misunderstandings in communication between different organizational units. This standardization should preferably be done by documenting all performance indicators according to the performance measurement record sheet (Neely et al., 1997), which also can help reduce the number of indicators, as the purpose of the individual indicator should be discussed to see if it is contributing to achieving the strategic goals of the company.
Use of the PM system
Another common problem is lack of or wrong action connected to the performance indicators, since the connection between actions, strategy, and performance indicators is essential for improving production processes (Dixon et al., 1990). To avoid this problem, the studied companies have developed a meeting structure where the results and actions are discussed at different levels. All companies have separated daily operational control and action taking from more strategic, long-term results and actions. However, a difference can be seen between papers 2 and 4 in the operational control. In paper 2, the companies discuss both the results and the actions in all their daily meetings while in paper 4, the daily meetings only focus on control of the processes, and actions are mainly discussed at weekly meetings. These different meetings, at all levels within the organization, are important to making sure that the PM system is used for identifying changes that affect the strategy and for decision making at both management and operational levels. The use of PM system at the operational level is strongly emphasized, which is consistent with the more decentralized management system that is common in Swedish companies (Nilsson and Kald, 2002).
To summarize the discussion around research questions 2 and 3, it can be seen that much research in this area already exists and the empirical findings from studies 1, 2, and 3 verify common pitfalls and failures, and several of the theoretical frameworks for designing and using the PM system within organizations. One of the most important measures to take to avoid the common pitfalls is to make sure to comply with all the phases in the KPI life cycle, to ensure that the PM system and its performance indicators are relevant, well-defined, and clearly connected to the strategy and to improvement projects.
7.3
Research quality
The quality of this research will be discussed based on the four quality criteria of trustworthiness. The quality criteria are summarized in table 7.2.