Computer Integrated Construction Research Program Department of Architectural Engineering The Pennsylvania State University 104 Engineering Unit A University Park, PA 16802
U
SING
4D
M
ODELING TO
A
DVANCE
C
ONSTRUCTION
V
ISUALIZATION IN
E
NGINEERING
E
DUCATION
by
Lingyun Wang
Technical Report No. 51
May 2007
ABSTRACT
Students in construction and engineering disciplines typically learn how to develop a building construction schedule by visualizing 2D design documents for a building project. This learning process is difficult since a student first needs to associate components in the 2D documents with their related construction activities, and then mentally visualize the construction sequence. 4D modeling technologies, visually representing the construction schedule time along with the 3D model components, has the potential to aid this learning process by providing a common visual language for students. This research examines the value of implementing 4D modeling technologies in construction engineering education for learning how to develop building construction schedules, and the associated concepts regarding sequencing and resource utilization. This research also targeted the development of a new process for creating a 4D model which is implemented in the Virtual Construction Simulator (VCS) application. This approach allows a student to generate a construction schedule directly from a 3D model without first creating a critical path method (CPM) schedule, which is required by current commercial 4D modeling applications.
To assess the effectiveness of using 4D modeling to visualize a construction schedule, a case study research project was performed where small student groups developed a construction schedule with the aid of a 4D learning module. The 4D learning modules were developed using two different 4D modeling applications (a commercial 4D modeling application and the VCS). An experiment was conducted to assess, compare and determine the pedagogical value of the two applications.
The 4D learning modules were found to be beneficial based on quality of the resulting solutions presentation effectiveness, and the perception of the students. The VCS application was more valuable than the commercial 4D application since it encouraged more collaborative group work, engaged students, and provided a greater focus on solution development.
iv
TABLE OF CONTENTS
LIST OF FIGURES ... viii
LIST OF TABLES... x
Chapter 1 Introduction ... 1
1.1 Current Construction Schedule Visualization in Engineering Education... 3
1.2 Current 4D Model Generation Process... 4
1.3 Description of the Research Problem ... 6
1.3.1 Research Goal... 6 1.3.2 Objectives ... 7 1.3.3 Research Approach... 8 1.3.4 Research Steps... 9 1.3.5 Research Contributions ... 11 1.3.6 Research Scope... 11 1.4 Thesis Organization ... 12
Chapter 2 Research Methodology... 14
2.1 Research Methods Introduction... 14
2.2 Research Techniques ... 15 2.2.1 Case Study ... 15 2.2.2 Controlled Experiment ... 16 2.2.3 Direct Observation... 17 2.2.4 Survey... 18 2.2.5 Content Analysis ... 19
2.2.6 Inter-rater Reliability Test ... 19
2.3 Research Process ... 22
2.3.1 Literature Review ... 22
2.3.2 Development, Incorporation and Evaluation of a Preliminary 4D Learning Module ... 22
2.3.3 Identification of Assessment Parameters... 23
2.3.4 Development and Incorporation of the VCS ... 23
2.3.5 Assessment of the VCS ... 24
2.3.6 Documentation of Conclusions and Lessons Learned... 24
Chapter 3 Literature Review... 25
3.1 Construction Schedule Visualization... 25
3.1.2 3D CAD Visualization ... 27
3.1.3 4D CAD... 28
3.1.3.1 Definition of 4D CAD... 28
3.1.3.2 Development of A 4D Model... 29
3.1.3.3 Benefits of 4D CAD ... 29
3.1.3.4 4D CAD Applications in Construction Projects ... 32
3.2 Design and Construction Team Communication... 35
3.3 Virtual Reality ... 40
3.3.1 Definition of Virtual Reality ... 40
3.3.2 Virtual Reality Display... 41
3.3.3 VR Used in Engineering Education ... 43
3.4 Summary... 45
Chapter 4 Case Study and Preliminary 4D Learning Module ... 47
4.1 The Case Study Project... 47
4.1.1 SIPS Method Introduction ... 47
4.1.2 MGM Grand Hotel Renovation Project ... 48
4.2 Previous Offering of the MGM Grand Hotel SIPS Assignment ... 49
4.3 The Preliminary 4D Learning Module ... 50
4.3.1 Development of the Preliminary 4D Learning Module... 50
4.3.2 Incorporation of the Preliminary 4D Learning Module ... 51
4.3.3 Assessment of the Preliminary 4D Learning Module ... 52
4.3.3.1 Assessment of the Final Solution Quality ... 52
4.3.3.2 Observation of the SIPS Presentation and Discussion ... 54
4.3.3.3 Student Perceptions ... 55
4.4 Metrics for Future Module Assessment... 56
Chapter 5 Virtual Construction Simulator ... 58
5.1 The Interface ... 58
5.1.1 Basic Components ... 59
5.1.2 Main Program Functions ... 61
5.2 The Development Process ... 66
5.2.1 The Modeling ... 66
5.2.2 The Programming ... 68
5.2.3 The SQL Database... 69
5.2.4 Summary of the Development Process... 75
vi
6.1 The Experiment ... 77
6.1.1 Display Systems ... 77
6.1.2 Experiment Procedures... 79
6.2 Data Collection ... 82
6.2.1 Data for Measuring Group Process ... 82
6.2.2 Data for Measuring Group Product ... 85
6.2.3 Data for Measuring Student Perspectives... 86
6.3 Data Analysis & Results... 87
6.3.1 Video Analysis & Results ... 87
6.3.1.1 Coding Scheme ... 87
6.3.1.2 Reliability Test ... 92
6.3.1.3 Video Analysis Results ... 94
6.3.2 Quality of the Initial Schedule, Final Schedule and SIPS Assignment... 96
6.3.3 Survey Results ... 97
6.3.4 Summary of the Experiment Results ... 105
Chapter 7 Conclusions ... 107
7.1 Research Summary ... 107
7.2 Research Contributions... 108
7.2.1 Identification of the Value of 4D learning Modules in Engineering Education... 108
7.2.2 Advancement of the Current 4D Model Generation Process ... 109
7.2.3 Time Study of Group Communications for Two Different 4D Generation Processes... 109
7.3 Limitations ... 110
7.3.1 Limited Case Study Application ... 110
7.3.2 VCS Interface Limitations... 111
7.4 Future Research ... 111
7.4.1 An Improved VCS ... 111
7.4.2 Paper-based Scheduling Process Communication... 112
7.4.3 Effect of the 3-Screen Display System... 113
7.4.4 Construction Plan Communication... 113
7.4.5 Implementation of the VCS on Complex Projects ... 113
7.5 Concluding Remarks ... 114
Bibliography ... 115
Appendix A MGM Assignment Scoring Rubrics ... 121
Appendix C AE 473 SIPS Exercise Survey I ... 123 Appendix D AE 473 SIPS Exercise Survey II... 126
viii
LIST OF FIGURES
Figure 1: Current 4D Modeling Process ... 5
Figure 2: The Virtual Construction Simulator as a Schedule Generation Tool... 6
Figure 3: Figure 3 Sequence of Design Activities for Two Design Teams during the Same Design Session ... 36
Figure 4: Current and Future Communication Diagram... 38
Figure 5: Time Spent of Decision Making Tasks on Design Development, Scheduling and Value Engineering Meetings... 39
Figure 6: ICon Lab Rendering ... 43
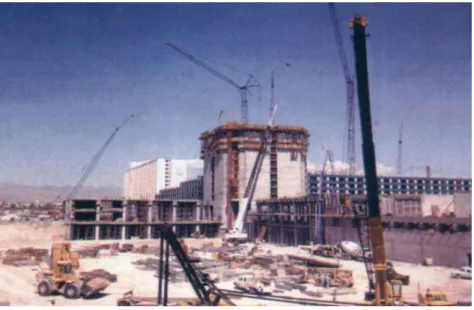
Figure 7: MGM Grand Hotel Construction Site ... 49
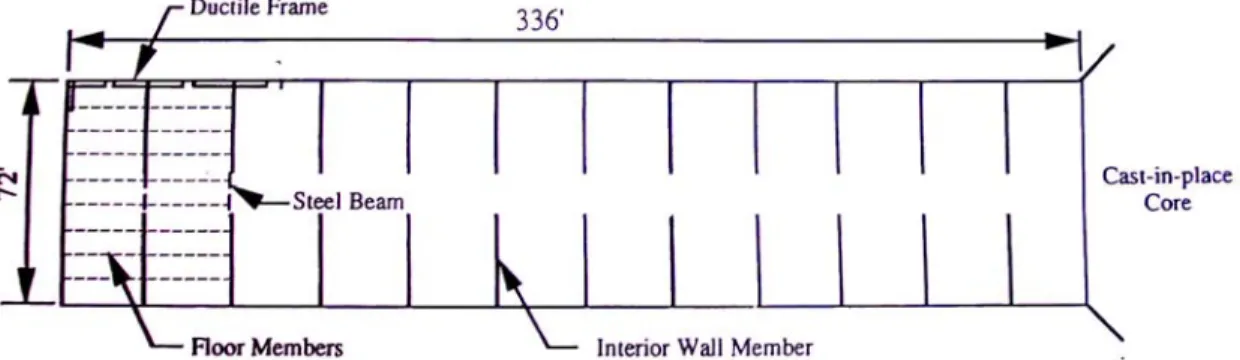
Figure 8: 2D Plan of a Typical Floor ... 50
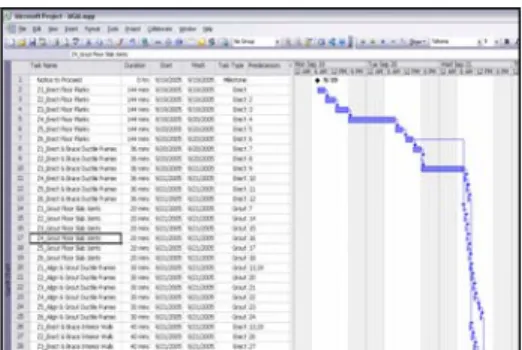
Figure 9: 3D Model of a Typical Floor and Schedule Template in MS Project... 51
Figure 10: A Student Group Presentation in the ICon Lab from 2005 ... 52
Figure 11 Student Perception Surveys from 2005 Regarding the Benefits of 4D Modeling... 57
Figure 12: Virtual Construction Simulator Interface ... 59
Figure 13: Group Function... 62
Figure 14: Create Function ... 63
Figure 15: Sequence Function ... 64
Figure 16: MGM Grand Hotel 3D Model... 67
Figure 17: Lisp Editor in Deep Creator ... 68
Figure 18: Object Table of the Database ... 71
Figure 19: Activity Table of the Database ... 72
Figure 20: Relationship of the Four Tables ... 73
Figure 22: Timer Table of the Database ... 75
Figure 23: Workflow of the VCS Development Process... 76
Figure 24: Display Systems in the ICon Lab ... 78
Figure 25: One Control Group... 80
Figure 26: One Experimental Group... 81
Figure 27: Group Presentation of a 4D Model in Class... 82
Figure 28: Audio & Video Recording Equipment ... 84
Figure 29: Group Process Coding Scheme ... 88
Figure 30: Inter-rater Reliability Test Result... 94
Figure 31: Comparison of the 3D Model Value ... 99
Figure 32: Comparison of the 3D Model Utilization... 100
Figure 33: Comparison of Idea Generation ... 100
Figure 34: Comparison of the Group Communication ... 101
Figure 35: Comparison of the Group Common Focus... 101
Figure 36: Comparison of the Initial Confidence ... 102
Figure 37: Comparison of effectiveness of the Schedule Review ... 102
Figure 38: Comparison of the Extent Students Enjoyed the Schedule Development Process ... 103
Figure 39: Ease of Presenting Solutions ... 103
Figure 40: Ease of Understanding Alternatives ... 104
x
LIST OF TABLES
Table 1: Assessment Plan for 4D Learning Module... 57
Table 2: Survey Response Rate for the Control and Experimental Groups ... 87
Table 3: Time Percentages of Each Communication Categories... 95
Table 4: Frequency Percentages of Each Communication Categories ... 95
Table 5: Collaborative vs. Cooperative Interaction Time Percentages... 96
Table 6: Comparison of the initial schedule, Final Schedule and SIPS Assignment .. 97
ACKNOWLEDGEMENTS
I would like to thank all those who gave me the opportunity to complete this thesis. I would like to express my deep and sincere gratitude to my advisor, Dr. John Messner. His deep knowledge, insights regarding this research, stimulating suggestions and compassion have been of great value for me. His encouragement and support have provided strong motivation for all the time put into my research and writing this thesis.
Sincere thanks to Dr. David Riley and Dr. John Wise for showing great enthusiasm in my research, providing their valuable suggestions and managing to provide such thorough feedback on my thesis.
This research would not have been possible without the friendship, support and help of the all the CIC Research group members: Rob Leicht, Kurt Maldovan, Russ Manning, Dragana Nikolic, Nevena Zikic and Alexandre Zolotov. I also would like to thank Clement Fung who helped me with my MGM Grand Hotel model and all of the undergraduate students who participated in my research.
I am very grateful to my friend, Qiankun Zhao, who helped me with my programming. Special thanks to my friends, Hien T. Nguyen and Kyu Yon Lim, for stimulating discussions of my research.
Finally, I want to say 'thank-you' to all my friends and family. I am most grateful to my husband, Guoliang Jiang and my parents for their everlasting encouragement and support.
Chapter 1 Introduction
When a student in design and engineering disciplines is learning to develop a construction schedule for a building, they will typically develop the schedule by interpreting 2D drawings, identifying activities and building a logic sequence network. Developing a construction schedule is difficult since one has to construct the building step-by-step in their mind after visualizing the 2D drawings. 4D modeling technologies, visually representing the construction schedule time along with the 3D model components, can provide a common visual language for students when learning how to develop construction schedules for buildings.
Benefits of 4D modeling technology used in the Architecture, Engineering and Construction (AEC) Industry have been studied and documented in recent years. 4D modeling allows project teams to visualize construction plans; identify construction consequences and space conflicts; identify safety issues; and improve communication of the project team members (Koo and Fischer 2000). While there are an increasing number of successful applications of 4D modeling in the AEC Industry, its implementation in engineering education is still limited. This research focused on the implementation of this visualization tool in construction engineering education and the quantitative assessment establishing its effectiveness.
In addition to investigating the effectiveness of the implementation of current 4D modeling tools in construction engineering education, this research also focused on
advancing the current 4D model generation process by developing a Virtual Construction Simulator (VCS) application. This VCS allows a student group to generate a construction schedule directly from a 3D model instead of first having to develop a CPM schedule for a project, and then perform an additional step to connect the schedule to the 3D model components. The educational value of the VCS in construction engineering education was assessed in comparison to a current commercial 4D modeling application.
To assess the effectiveness of using a 4D model to visualize a construction schedule, a case study research project was undertaken where small student groups developed a construction schedule with the aid of a 4D learning module. The value of the 4D model learning module was examined by investigating a small student group activity. The value was assessed by investing the groups effectiveness based on their group communication and interaction; evaluating their final activity results; and investigating the student perception of their learning experience and the impact of the technology.
This chapter introduces the current construction schedule visualization techniques used in engineering education and the current status of 4D modeling process, and describes the limitations of using these techniques and process. Then, it provides a description of this research study with a discussion of the research goal, objectives, research questions, research steps, research contributions and scope. It concludes with a discussion of the thesis organization.
3
1.1 Current Construction Schedule Visualization in Engineering Education
2D drawings and Critical Path Method (CPM) schedules are the traditional tools used in the construction engineering discipline to analyze a project design and plan the construction of the project. Individuals require training to interpret 2D drawings and visualize projects based on their previous experience and knowledge. With building geometry getting more and more complex, even experienced construction planners can misinterpret the designer’s intention, which can lead to poor construction plans which cause an increase in time and project cost.
To generate a CPM schedule from a set of 2D drawings, construction planners need to associate components in 2D drawings with their related construction activities and build their sequential relationships mentally. Such schedules force planners to visualize and interpret the activity sequence in their minds. Also, some planners will have different interpretations of the same schedule, which makes it difficult to communicate and discuss whether a certain problem actually existed or not. So it is difficult to conceptualize the construction process and detect problems by viewing the CPM schedule alone, especially for a novice with limited construction experience.
With recent advancements in 4D modeling technologies, it is now possible to provide our students with visual models that allow them to experience and experiment with 3D and 4D virtual models of construction projects. This advanced visual communication can significantly improve the ability of students to comprehend, learn, and gain experience with reviewing designs for constructability and planning the construction of complex building and infrastructure projects. The models can also help
students improve their visualization skills so that they will be more prepared to interpret and visualize 2D drawings in 3D.
4D model development has already been implemented in undergraduate Architectural Engineering Department at Penn State. In a previous study, the educational value of having students develop 4D models for a building project using a desktop computer monitor was assessed, and it was found that the 4D models can enhance the ability for students to understand typical planning documents (Messner et al. 2003). By using 4D models, students can visualize the built environment and gain experience and intuition related to construction method selection, construction sequencing, site planning, and site logistics.
1.2 Current 4D Model Generation Process
The current process used to develop a 4D model is: 1. Develop or obtain a 3D model;
2. Develop a construction CPM schedule;
3. Separate the 3D model into appropriate construction assemblies; and
4. Link the 3D model components with their corresponding activities specified in the CPM schedule in a 4D modeling application.
Once the 3D model and the schedule are linked, the 4D model can be viewed as a visual simulation of the construction process for the project.
One limitation of the current 4D modeling process is that it requires additional time to develop the model since a planner must first generate a schedule, and then link
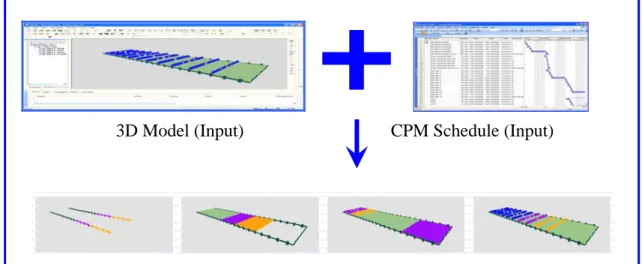
5 the schedule to a 3D model of the project. Therefore, the 3D model and the schedule are inputs to this process, and the 4D model is the final product and used in a schedule review process. Figure 1 shows the process of a current 4D model generation process. The current method of using a CPM modeling application for generating the schedule limits the utility of the 3D model during the planning process since the planners need to first create the activities mentally, and later link them to their related 3D components in a 4D modeling application.
3D Model (Input) CPM Schedule (Input)
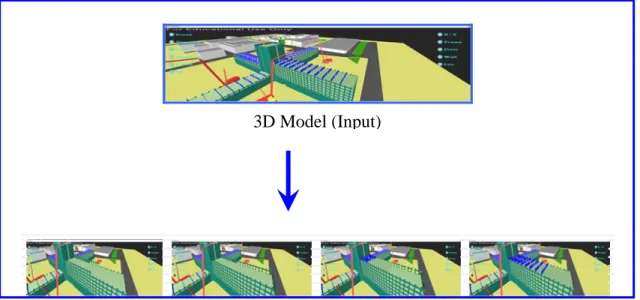
A Virtual Construction Simulator (VCS) prototype with a 4D CAD generation interface has been proposed, which allows a user to develop a construction schedule and a 4D CAD model by selecting objects from within a 3D model. The input to the process is only the 3D model, and the output is a CPM schedule and a 4D CAD model. Figure 2 illustrates the process of the VCS as a schedule generation tool. This is a
4D Model (Output)
different approach from the current 4D CAD applications which require a CPM schedule input.
3D Model (Input)
4D Model (Output)
Figure 2: The Virtual Construction Simulator as a Schedule Generation Tool
1.3 Description of the Research Problem
This section provides an overview of this research, which includes the research goal, objectives, approach, steps, contributions and scope.
1.3.1 Research Goal
The goal of this research is to investigate the effectiveness of 4D modeling implementation in construction engineering education for schedule visualization, and to
7 advance the current state of 4D modeling techniques by developing a Virtual Construction Simulator (VCS) prototype application for implementation in engineering education.
1.3.2 Objectives
To achieve the goal of this research, the following objectives were completed: 1. Investigate the value of current 4D modeling tools used for schedule
visualization in construction engineering education. A preliminary 4D learning module was developed and implemented in an advanced project management course at Penn State to aid students in the development of a construction schedule. An initial assessment plan was used to evaluate the effectiveness of the 4D learning module in comparison to paper based schedule generation.
2. Develop a VCS that advances the current 4D model generation process. The VCS was developed to allow students to interactively generate a construction schedule (in a 4D model format) directly from a 3D model. The objective is to allow rapid 4D model generation for alternative construction schedules so that the schedule can be visualized, assessed, justified and optimized in an efficient and visual manner.
3. Assess the impact of the VCS compared to the current 4D modeling process in engineering education. Based on the experience of implementing the preliminary 4D learning module, assessment metrics were identified and a
detailed assessment plan was utilized to evaluate the value of the VCS compared to current 4D modeling applications used in construction engineering education. This was performed through a case study evaluation of small group effectiveness.
1.3.3 Research Approach
Since 4D model implementation in engineering education is limited, this research was first established as an exploratory investigation to study the value of 4D model implementation for schedule visualization through a case study methodology. Through this exploratory study, the value of 4D modeling and important metrics for assessing its effectiveness were identified.
In addition to exploring the educational value of current 4D modeling tools, A VCS was developed and its value in engineering education was assessed. A hypothesis testing method was used to evaluate the effectiveness of the VCS in construction engineering education in comparison to current 4D modeling applications. The hypothesis for this research is that the VCS application, when compared with a current 4D modeling application, is more effective in improving small student group communication and interaction; help students develop higher quality construction schedules, and contribute to the student enjoyment during the schedule learning experience.
9 1. How effective are current 4D modeling tools for aiding students to
visualize and develop construction schedules? What are the potential opportunities for improving the current 4D modeling tools?
2. What parameters should be used to examine the value of 4D modeling in construction schedule visualization?
3. What are the additional values gained by using the proposed VCS for learning scheduling in construction engineering education?
4. What is the perception of students towards 4D modeling tools?
1.3.4 Research Steps
This research aims to evaluate the value of 4D modeling used in construction schedule visualization and advance the current 4D process. The research steps are as follows:
1. Literature review: A literature review was conducted in the areas of construction schedule visualization, design and construction team communications, virtual reality, and virtual reality applications in engineering education.
2. Development, incorporation and evaluation of a preliminary 4D learning module: A preliminary 4D learning module was developed which required students to use a commercial 4D modeling application for analyzing their construction sequence solution for an assignment. This assignment was implemented in a 5th year project management course at Penn State. The
value of the learning module was assessed and student perspectives of this technique were investigated.
3. Identification of assessment parameters: By conducting the exploratory research, the researcher was able to identify critical parameters that can be used to evaluate 4D modeling learning modules used in engineering education.
4. Development, incorporation and evaluation of the VCS: The VCS was developed using a commercial 3D game engine. The interface was assessed through an experiment where 5 student groups used the VCS and 5 groups used a commercial 4D modeling application for reviewing a schedule generated in a CPM application.
5. Data collection and analysis: While performing Step 4, student group activities were observed and videotaped. A detailed content analysis was conducted to analyze the videos. Quantitative and qualitative surveys were taken to measure students’ perspectives of two different interfaces and the quality of the final schedules was assessed.
6. Documentation of conclusions and lessons learned: By conducting a preliminary study and an experiment to compare the VCS and the current 4D modeling process, the value of the VCS and the current 4D model applications used in engineering education was identified. Suggestions and recommendations for improvements were documented in the results. This will help guide future research and implementation efforts.
11
1.3.5 Research Contributions
The primary research contributions of this research are:
1. A VCS prototype which advances the current process of 4D model generation. Instead of focusing on improving the efficiency of developing a 4D model from a 3D model and an existing construction schedule, the VCS prototype allows a user to generate a CPM schedule and a 4D model by interacting with a 3D model of a building.
2. An assessment plan used to evaluate the effectiveness of a 4D modeling learning activity.
3. A detailed study of student group meetings which describes the frequencies/time of different categories of communications.
4. Documentation of the experiences and lessons learned from the student exercise, including students’ perceptions of 4D learning tools and suggestions for improvements.
1.3.6 Research Scope
This research focuses on understanding the value of 4D modeling in engineering education, specifically for construction schedule visualization. Two different 4D modeling interfaces: a commercial 4D modeling application and the VCS were evaluated regarding their values in aiding engineering students in the scheduling and planning process. Though the case study selected was a special repetitive scheduling method (the Short Interval Production Scheduling (SIPS) technique), the 4D model generation process
would be the same for a non-repetitive scheduling activity. It is also important to note that both interfaces have only been tested through the detailed analysis of one case study project and they have not been tested on a large scale project.
1.4 Thesis Organization
This thesis is divided into three sections. The first three chapters explain the concept and need for 4D model implementation and advancement in construction engineering education. This chapter has presented an overview of this research. Chapter Two describes the detailed research techniques used for this study. Chapter Three summarizes the existing relevant literature for this study, including literature on 4D modeling, design and construction plan communication, and virtual reality displays and applications in engineering education.
The second section of the thesis consists of Chapters Four through Seven, which focus on the development, implementation and evaluation of 4D modeling (current 4D modeling and VCS) learning modules. Chapter Four describes the case study project and the preliminary 4D learning module development and incorporation. Chapter Five presents the interface and the development process of the VCS. Chapter Six introduces the experiment conducted to evaluate the value of the VCS in comparison to a current 4D modeling tool. Chapter Seven describes the data collection and analysis process and results.
13 The final section of the thesis is contained in Chapter Eight. This chapter provides a summary of research results, the research limitation, and an outline for future research in this area.
Chapter 2 Research Methodology
This chapter describes the methods and techniques used for conducting this research. The basis for the selection of the research methods is also presented. This chapter concludes with a detailed description of the research process.
2.1 Research Methods Introduction
Research can be divided into three main categories: exploratory, hypothesis testing and problem solving (Phillips and Pugh 2000). The research methods designed for this research are a hybrid of exploratory and hypothesis testing approaches.
Exploratory research is often conducted because a problem has not been clearly defined as yet, or its real scope is as yet unclear at the outset of the project. It is usually used to investigate little understood problems, identify important variables or generate hypotheses for future research. This research aims to investigate the value of using 4D modeling in construction engineering education. Since limited research has been conducted in this area, an exploratory research method was extensively used in this research. Two common research strategies used in an exploratory research are field studies and case studies (Marshall and Rossman 1999). With consideration of this specific research topic, a case study method was selected.
15 Hypothesis testing research usually takes place in a structured environment with clear measurement criteria. A hypothesis predicts an experimental outcome and it is made without knowing whether or not it is correct. An experiment is usually performed to support or deny a hypothesis. The hypothesis for this research is that the VCS interface is more effective in improving small student group effectiveness in schedule visualization than a current 4D modeling application. To test this hypothesis, an experiment was conducted, where 5 student groups using the VCS interface and 5 groups using a current 4D modeling application generated a SIPS for a case study project.
2.2 Research Techniques
Research techniques used in the research process are detailed in the following sections. These techniques include a case study, controlled experiment, direct observations, surveys, content analysis, and reliability test.
2.2.1 Case Study
“A case study is an empirical inquiry that investigates a contemporary phenomenon within its real-life context, especially when the boundaries between phenomenon and context are not clearly evident” (Yin 2003). It encourages in-depth investigations of particular instances within the research subject (Fellows and Liu 2003). The case study method is very useful for exploratory research since an exploratory case study is theory-driven. A case study may be selected when it is “a representative
sample, demonstrates particular facets of the topic, or shows the spectrum of alternatives” (Yin 2003). The case study used for this research is the construction planning process for the precast concrete structure systems of the MGM Grand Hotel in Las Vegas, Nevada. Though the case study selected was a specific repetitive scheduling method (the Short Interval Production Scheduling (SIPS) technique), the 4D model generation process would be the same for a non-repetitive scheduling activity. Therefore, this case study can be stated as a representative sample of the research topic. It investigated the effectiveness of 4D modeling applications in helping students learn scheduling and the project planning process.
2.2.2 Controlled Experiment
An experiment is usually conducted to test a hypothesis about the role of the independent variable on the dependent variable. A controlled experiment generally compares the results obtained from an experimental sample against a control sample. Two or more sample groups are created at the beginning of an experiment, which are probabilistically equivalent. This equivalency is determined by the amount of variation between individuals and the number of individuals in each group. Once equivalent groups have been formed, they will be treated identically by the experimenter except for the one independent variable.
In this research, students from a senior level construction management class (AE 473) were randomly assigned to ten small groups. The groups were generated by using the “Random Team Generator” tool in ANGEL, Penn State's Course Management
17 System (CMS). Then five student groups were assigned randomly to the control group and the other five were in the experimental group. Among these ten groups, two groups consisted of 4 students each, and the other eight groups consisted of 3 students each. Due to the absence of some students, there was a 2-student group in each of the control and the experimental group. The treatment for the control group was a current 4D modeling interface which aided students to develop a construction schedule for the case study project. The treatment for the experimental group was the VCS interface which helped students to develop a construction schedule for the same project. Student group effectiveness in schedule visualization was examined to compare the impact of these two 4D modeling tools in engineering education.
2.2.3 Direct Observation
Direct observation is a simple method to gather data about how users interact with products (Yin 2003). It is powerful for gaining user insight. To gain maximum benefit, careful planning is needed. Without care, observation may affect what people do and bias results may produce. It is important to make the person being observed comfortable with the process. Observation can be combined with video for better data capture.
There are two types of direct observation methods: structured observation and unstructured observation (Yin 2003). A structured observation is used when the researcher determines what behaviors are to be observed before the observation starts. Usually the research uses a standard checklist or a certain theoretical framework to record
the frequency or time of the behaviors observed over a specified time period. In an unstructured observation, there is no predetermined plan about what to be observed. The researcher records behaviors as they occur and analyze them afterwards.
In the implementation of the preliminary 4D learning module, unstructured observation techniques were used to observe student presentations and discussions since no research had been done in this area and the researcher had no predetermined plan about what to be observed. When comparing the VCS and a current 4D modeling application, a theoretical framework was used to examine student group communication. Structured observation was used to observe the student group meeting process since the researcher predetermined what to be observed from the available theoretical framework.
2.2.4 Survey
A survey is a process of examining a social phenomenon involving an individual or a group, by gathering information through observation or asking (Corbetta 2003). Commonly, surveys are conducted through questionnaires and interviews (Fellows and Liu 2003).
Questions have two primary types, open and closed. Open questions are designed to allow the respondents to answer in whatever form and content they wish. This kind of questions is easy to ask but difficult to analyze the data. Closed questions have a set number of predetermined responses that respondents can choose.
Questionnaire surveys were used in this research. Closed questions were asked to measure student perceptions regarding the value of 4D learning module in the group
19 meeting and presentation process. These questions were measured on a Likert scale (Corbetta 2003). Open questions were designed to investigate the challenges of using 4D modeling that students encountered and suggestions for future improvements of the module.
2.2.5 Content Analysis
Content analysis is defined as "any technique for making inferences by objectively and systematically identifying specified characteristics of messages" (Holsti 1969). Content analysis is a widely accepted technique to systematically analyze data obtained through qualitative research. It is a phase of information processing in which communication content is transformed, through objective and systematic application of categorization rules, into data that can be summarized and compared.
A content analysis was performed for each video recorded from student group meetings. The specific method that was used to develop the content analysis was to use a video analysis application to document the frequency/time for each category that was predefined by a coding scheme. Following coding, quantitative scales were derived for further analysis.
2.2.6 Inter-rater Reliability Test
Inferences drawn from the content analysis need to be verified and the reliability must be tested. There are three types of reliability for content analysis (Milne et.al. 1998):
1. Stability refers to the ability of the same coder to code data the same way over time. The coder usually experiences a test-retest procedure.
2. Reproducibility (inter-rater reliability) is to measure the extent to which coding produces the same results when the content is coded by multiple coders. This type of reliability measure is usually referred to as inter-rater reliability. The measurement involves assessing the proportion of coding errors between various coders. The reliability is verified by either reporting that the discrepancies between the coders are few, or that the discrepancies have been reanalyzed or the differences have been resolved.
3. Accuracy involves assessing the coding performance of coders against a set of predetermined standard. Such a standard is set by a panel of experts, or known from previous studies.
In this study, there were 10 videos recorded, with an average duration of 3 hours for each video. The researcher coded the videos and performed a stability test. Later, an inter-rater reliability test was performed. Since each minute of the video took approximately 4 minutes to code on average, it is unrealistic to have other coders test the reliability of the entire data set. Therefore a 12-minute video was randomly identified and three other coders coded the video. Included amongst the three coders, the researcher’s academic advisor has experience in content analysis and expertise in 4D modeling and construction planning, and two graduate students in the construction engineering and management option have familiarity with 4D modeling techniques but limited experience with content analysis.
21 The co-agreement levels reached among coders were used to test the reliability. The measure of the co-agreement level is the coefficient of agreement or percentage of agreement. The coefficient of agreement involves calculating a ratio of coding agreements to the total number of coding decisions taken by all the coders.
Reliability is usually tested by meeting a certain standard of reliability. However, it does not necessarily require a formal calculation of reliability. If multiple coders are used on the entire data set and all the discrepancies are examined and resolved or they observe very few discrepancies, the research can feel assured that the data set is reliable for those researchers. Determining an appropriate level of inter-rater reliability should be very careful since “defining an acceptable level of acceptable level of reliability is one of the many problems in content analysis for which there is no single solution” (Holsti 1969). The reliability standards need to be answered within the context of a given research problem (Krippendorff 1980). A detailed description of the reliability test is provided in Chapter 6.
2.3 Research Process
Detailed descriptions of the major research processes for this study are introduced in this section.
2.3.1 Literature Review
To provide a background for this research, a literature review was conducted in the areas of construction schedule visualization, design and construction team communications, virtual reality, and virtual reality applications in engineering education.
2.3.2 Development, Incorporation and Evaluation of a Preliminary 4D Learning Module
An exploratory study was conducted, where a preliminary 4D learning module was developed using a current 4D modeling application and implemented into an advanced project management course (AE 473) in 2005 at Penn State. The module was used to help students learn Short Interval Production Scheduling (SIPS) for a typical floor of the MGM Grand Hotel precast structural system. Final 4D model solutions were exported into video files so that student groups could present their solutions to their classmates and the instructor.
A scoring rubric was used to compare the quality of the final solutions with the previous year’s solutions, when a paper-based 2D drawing was used to develop the schedule. Student group presentations and discussions in class were directly observed, and a preliminary survey was conducted to investigate student perspectives of the 4D learning module. The results of this module implementation are presented in Chapter 4.
23
2.3.3 Identification of Assessment Parameters
From the implementation of the preliminary module, the researcher was able to identify important parameters that can be used to evaluate the value of the 4D learning modules. These parameters were identified by direct observation of student group presentations and in class discussions; analysis of the survey results; and the development of a summary of lessons learned from this research.
2.3.4 Development and Implementation of the VCS
The VCS was developed using a 3D game engine. It allows students to generate a construction schedule and a 4D model by interacting with a 3D model. The VCS learning module and a 4D learning module in a current 4D application of the MGM Grand Hotel project were incorporated into the same advanced project management course in 2006. The AE 473 class was randomly divided into eight small groups of 3 and two groups of 4 students. The control group consisted of 5 student groups that used the current 4D modeling interface, and the experimental group consisted of 5 groups that used the VCS application. The experiment was conducted in the Immersive Construction (ICon) Lab where students can visualize the 3D and 4D model on a large 3-screen display system. The experiment was observed and videotaped with student permissions for further analysis.
2.3.5 Assessment of the VCS
Data were collected both during and after the experiment for examining the student group process, group product and perception towards the learning modules. The experiment for each group was observed and recorded so that the student group process could be analyzed. Initial schedules, final submitted schedules and overall SIPS assignments were documented so that their quality could be compared between the control and experimental groups. Surveys were conducted after the experiment and student presentations to gain their perceptions.
The videos were analyzed using content analysis techniques. Student group communications were coded and quantitative data were obtained by conducting frequency/time studies of different communication categories predefined by a coding scheme. Initial schedules, final submitted schedules and overall SIPS assignment were graded using scoring rubrics. Qualities were evaluated by comparing the grades. Survey results were used to examine and compare student perspectives from both control and experimental groups. The results are presented in Chapter 6.
2.3.6 Documentation of Conclusions and Lessons Learned
The benefits and limitations of the 4D learning module used in engineering education were identified through this study. Conclusions as well as lessons learned were documented. Suggestions for future improvement of learning modules were provided, and directions for further research were recommended.
Chapter 3 Literature Review
This chapter provides an overview of significant literature related to this research. Construction schedule visualization, design and construction team communications, virtual reality (VR) display system, and virtual reality applications in engineering education are covered.
3.1 Construction Schedule Visualization
To understand the value of 4D visualization technologies for schedule visualization, it is very important to know the traditional schedule visualization methods and their limitations, and background knowledge of 4D modeling. This section introduces traditional 2D and CPM scheduling methods, 3D visualization, the concept and process of 4D modeling, and the applications and values of 4D modeling in the AEC Industry.
3.1.1 Traditional 2D CAD & CPM Scheduling
2D drawings and CPM scheduling are the traditional tools used in the Architecture, Engineering and Construction (AEC) Industry to analyze project designs and plan their construction. Designers use 2D drawings to describe their ideas to other project participants. Visualization of the facility is communicated using 2D drawings
and project information is primarily exchanged via paper documents. Individuals need training to interpret 2D drawings and visualize projects based on their previous experience and knowledge. With building geometry getting more and more complex, even experienced personnel misinterpret the designer’s intention, which can lead to additional time and cost.
CPM was invented by the aerospace industry and has been adopted in the construction industry since late 1950s. Though it has been well served in this industry in many aspects, the CPM has been widely criticized in terms of its inability to cope with non-precedence constraints, difficulty to evaluate and communicate interdependencies, and inadequacy for work-face productions (Sriprasert and Dawood 2002). They use only titles to designate activities and numbers to indicate activity durations. They are separated from the visualization of the planned construction (Collier 1996).
Schedulers need to interpret the 2D drawings, identify activities and build a logical sequence network. Then they determine activity and project durations. This process results in a CPM network or a Gantt chart. Developing a construction schedule is hard since one has to build a project step-by-step in their mind after visualizing the 2D drawings.
It is difficult to conceptualize the construction process and detect problems by viewing the CPM schedule alone, especially for a novice with limited construction experience. Such schedules force users to visualize and interpret the activity sequence in their minds. Components in 2D drawings have to be associated with their related activities mentally. The processes are a sequence of events not physical objects, therefore, it is more difficult to validate and evaluate them (Retik 1993). Sometimes a
27 novice cannot even detect problems from a small CPM schedule. Also people have different interpretations of the same schedule, which makes it difficult to communicate and discuss whether a certain problem actually existed or not.
3.1.2 3D CAD Visualization
Simulation modeling and visualization are used to overcome the deficiencies of the traditional scheduling techniques. Advanced visualization techniques such as 3D visualization, 4D models and virtual reality models can be utilized for more effective generation, communication and evaluation of schedule information.
3D modeling has been around for more than three decades, and it is becoming a more useful and economically viable tool. 3D modeling can better present the physical reality of a structure than 2D drawings. 3D models have been increasingly used in a number of different areas such as automobiles, aerospace vehicles, buildings and so on. Various computer-based 3D visualization activities have been used for construction planning. Kamat et al. (2001) described a 3D visualization system for construction operations simulation. The construction system can be analyzed at the operation level of detail to plan the construction process. Interactions of various resources, such as materials, labor, equipment and temporary structures can be viewed when the building is being virtually constructed.
Thabet (2001) proposed a virtual construction model to integrate the design and construction process to improve project constructability during the pre-construction stage. The model allows the users to virtually and interactively construct 3D models of the
projects from predefined construction CAD assemblies or components. The construction process can be rehearsed, which allows the users to analyze and criticize designs as well as perform what-if scenarios.
Songer et al. (2001b) quantified the benefits of 3D models and walk-thrus for schedule development for construction projects. Completeness, reasonable activity duration and valid activity relationships were used to measure the “correctness” of a schedule. Critical path and total float, workflow and resource use were used to define “goodness”. Schedulers can generate more correct and better construction schedules by using a 3D model and a walk-thru than by using 2D plans. The walk-thru model enhanced the spatial comprehension, which enabled the schedulers to schedule concurrent activities without the fear that they were scheduling too many activities in the same area or at the same time. The walk-thru enabled experienced schedulers to develop correct schedules, as well as effectively minimized the disadvantage of inexperience.
3.1.3 4D CAD
3.1.3.1 Definition of 4D CAD
A 4D CAD model results from the linking of 3D graphical images to the fourth dimension of time (Koo and Fischer 2000). The idea of linking 3D CAD models to the construction schedules began in Bechtel Corporation in 1986-87 when they collaborated with Hitachi Ltd. to develop the Construction 4D-Planner (Smith 2001). While the
29 spatial and temporal dimensions of construction schedules are not effectively represented and communicated by traditional bar charts and network diagrams, a 4D model simulates the construction schedule and actually shows which pieces of projects will be constructed in what sequence (Adjei Kumi and Retik 1997). By combining 3D models with construction activities, 4D CAD animations can display the progression of construction over time, which provides the opportunity to improve the quality of construction plans and schedules (Rischmoller et al. 2001).
3.1.3.2 Development of A 4D Model
The current process used to develop a 4D model is: 1. Develop or obtain a 3D CAD model.
2. Develop a construction schedule. This information is captured from the experience and knowledge of the construction planner.
3. Separate the 3D model into appropriate construction elements or assemblies. 4. Link the components of the 3D model with their activities specified by a CPM
schedule in a 4D CAD schedule. Once they are linked, the 4D model can be viewed as a simulation of the construction plan.
3.1.3.3 Benefits of 4D CAD
4D CAD models enable more people to understand a schedule quickly and identify potential problems, since it allows people to visualize the construction process as
it would be actually built before the construction starts. Koo et al. (2000) studied the effectiveness of a 4D model in conveying a construction schedule. 4D models are useful in conveying which components are being built at a certain time and location. 4D CAD is effective in:
• verifying the completeness of the schedule;
• finding inconsistencies in the level of detail among the schedule activities;
• discovering any impossible schedule sequences;
• identifying potential time-space conflicts; and
• anticipating accessibility problems.
4D models are effective in evaluating the executability of a construction schedule. They allow users to detect mistakes or potential problems prior to construction. The main benefits that a 4D model provides are as a
• visualization tool- ability to convey planning information;
• analysis tool - enhance collaboration among project participants; and
• integration medium - support users to conduct additional analyses.
4D modeling also enables the identification of potential conflicts between building elements and work spaces, safety hazards created due to proximity of construction activities, and the visualization of construction plans (McKinney et al. 1998).
Songer (2001a) quantifies the advantages of 3D/4D presentations for schedule review of construction projects. Once a schedule has been created, 4D animation is useful to review and analyze it. 4D media can improve a schedule reviewer’s ability to
31 identify the “correctness” and “goodness” of the schedule. With the aid of 4D CAD animation, missing activities and logic errors in the schedule are dramatically reduced, safety and overcrowding issues are easily identified, and better work flow can be achieved. 4D animation is a valuable tool for schedule analysis, especially for analyzing portions of the schedule that involve complex design drawings, which are difficult in 2D review.
4D Planning and Scheduling (4D-PS) uses 4D models to accomplish project construction planning and scheduling tasks (Rischmoller et al. 2001). It allows simulating and interacting with construction schedule through graphic display devices. The application of 4D-PS to a case study shows that 4D model reviews can help construction planners to optimize construction sequences, identify and resolve schedule conflicts, and provide feedback from construction teams to design teams. It also gives planners the ability to track and manage workers and resources. By allowing planners to make important decisions regarding deadlines, sequence and resource utilization ahead of time, 4D model reviews can dramatically improve project constructability and avoid rework.
4D CAD modeling offers the opportunity for planners to perform detailed trade sequencing and production planning (Riley 1998). Workspace congestion and inference between crews and stored materials can be predicted and minimized through visual analysis of construction sequences, so that productivity rates can be maximized.
3.1.3.4 4D CAD Applications in Construction Projects
3D and 4D models have been used on large projects and process plants. More and more companies realized the benefits and began to explore the possibilities of this tool as a means to increase their competitiveness. The Center for Integrated Facility for Engineering (CIFE) at Stanford University has lead several significant research projects related to 4D CAD in construction industry.
4D modeling was used on the Walt Disney Concert Hall Project to test the benefits and challenges of using 4D models for projects with complex geometry (Haymaker and Fischer 2001). 4D models benefited the project in the following aspects:
• Schedule creation: The GC used the 4D models to assist in planning the laydown areas for the enclosure contractor, to visualize overall project access at critical junctures in the project, to refine the interior and exterior scaffolding strategy, and to plan the installation of the complex ceiling of the main concert hall.
• Schedule analysis: The GC’s project management team used 4D models to discover several conflicts in the schedule which were not discovered in the CPM-based Gantt chart.
• Communication: The GC used the 4D models in training sessions with as many as 40 people, where subcontractors, owners, designers, and the GC reviewed the models and discussed the strategy and constraints for erecting the project
33
• Team building: The 4D models helped the construction team find many schedule inconsistencies, resolve access, scaffolding and hoisting issues for the exterior and interior construction in a timely manner, inform more stakeholders of the approach to construction and of the schedule, and engage subcontractors in the scheduling process.
Challenges encountered in building the 4D models included:
• Geometry issues: Inconsistencies, lack of data, level of detail, and too much data.
• Schedule issues: Inconsistencies and lack of data.
• Issues with linking of 3D model and schedule: Inconsistencies, other data, and representation of activities with no geometry.
The documentation of the use of 4D modeling on small projects is very limited. The San Mateo County Health Center project is an example of using 4D modeling and animation on a daily basis on a small project. 4D schedule animation is a good tool in explaining the proposed construction sequence. Even people with minimal previous involvement were able to view the animation and quickly understand the impact of the planned construction on their department, office and daily operation. Video of the animation can be created and used to disseminating the construction information to a large number of people (Collier 1996).
Disney's Imagineers found tremendous value of 4D in terms of increased productivity and decreased waste on job sites. The main value is conflict resolution since 4D allows visualization of construction sequence. Another benefit is the ability to run what-if scenarios to determine optimum scheduling and resource management.
Also, all project stakeholders, from the owner to the tiling subcontractor, can see how the project is supposed to progress by using 4D.
In another case study by Staub et al. (1999), a 4D CAD model was used for the most extensive and difficult construction work of a pharmaceutical plant, leading to fewer unanticipated problems during construction. The results of using 4D on this project were:
• The piping and mechanical subcontractors fabricated all the large and expensive ducts and pipes directly from the 3D CAD model, and both reported far greater productivity and virtually no rework.
• There was only one contractor-initiated change order on the work that had been modeled in 3D.
• Requests for information were reduced by 60% percent compared with a similar project designed and built by traditional means.
The model benefited various trades on the project. It lowered the construction cost by helping subcontractors to avoid sequencing conflicts. The project manager found the 4D model valuable in coordinating construction tasks and communicating the intent of the schedule. The project designer could make modifications to one model when the design changed, whereas they had to change plans, sections, and elevations when using traditional 2D drawings.
These cases have shown that more project stakeholders can benefit from 4D models. They can understand a construction schedule more quickly and completely with 4D visualization than with the traditional construction management tools, and they have much better communication with different trades related to the project. With
35 successful applications of 4D CAD in the industry, it is feasible that 4D CAD may be very beneficial in construction engineering education. It can provide the opportunity to improve construction engineering education by allowing students to experience the dynamic nature of construction.
3.2 Design and Construction Team Communication
This research will investigate the value of the VCS by comparing with traditional 4D modeling tools. One critical evaluation parameter that will be used is the team communication effectiveness. This section provides a review of important work in design and construction team meeting communication.
Different criteria are available in defining communication types during design and construction team meetings. There are two main theoretical frameworks that were reviewed for this research: design team meetings by Stempfle and Badke-Schaub (2002) and construction project team meetings by Liston (2000).
Stempfle et al. (2002) discussed the four basic thinking operations (exploration, generation, comparison and selection) and analyzed design team meetings and defined six steps concerned with the communication content of a design team meeting:
1. Goal clarification: goal related communicative acts; 2. Solution generation: a solution concerning the design task;
3. Analysis: question, answer, hypothesis, exchange of information concerning a solution;
5. Decision: decisions for or against a solution idea; and 6. Control: Control of the implementation of a solution idea.
Stempfle’s research shows that the most frequent types used by the design teams are analysis and evaluation in a collective design process.
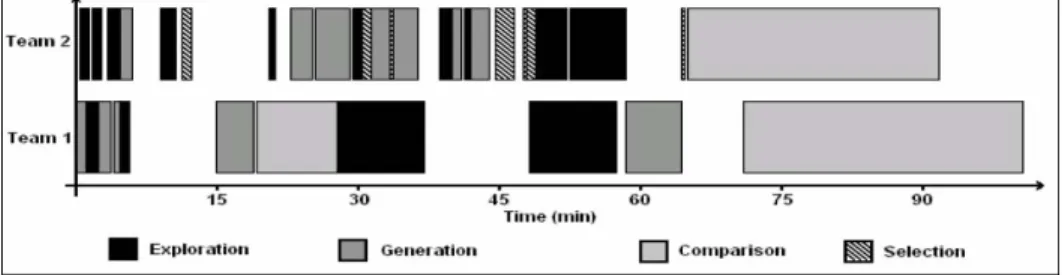
Rao and Kremer (2005) used the four basic thinking operations discussed by Stempfle et al. and studied design team communications by audio recording design team meetings. Recorded audio was transcribed to text and the transcriptions were categorized into one of the four basic design activities of exploration (of concepts and analysis of designs), generation (of alternate concepts and solutions), comparison (of concepts and solutions) and selection (of viable design solutions). They studied the sequence of design activities to examine how information sources were utilized. Two design team communications were analyzed and Figure 3 shows the sequences of design activities for these two groups. One design group spent smaller amounts of time on each activity, but iterates much more frequently between the different activities. Both teams spent most of their time on comparison, then exploration, generation and selection in descending order.
Figure 3 Sequence of Design Activities for Two Design Teams during the Same Design Session Source: Rao and Kremer (2005)
37 Liston (2000) analyzed the amount of time spent on different categories of communication types (descriptive, explanative, evaluative and predictive) in a construction project team meeting.
• Descriptive: describing various tasks and asking questions like “who, what, when, where, how” of a project.
• Explanative: explaining project decisions or schedule rationale. Questions like “why, why not” are usually discussed.
• Evaluative: Evaluating the project goals and checking that project requirements are met. This consists of the assessment of possible alternatives to a problem or situation.
• Predictive: predicting the possible consequences of a decision or estimating the value of an unknown variable during a meeting.
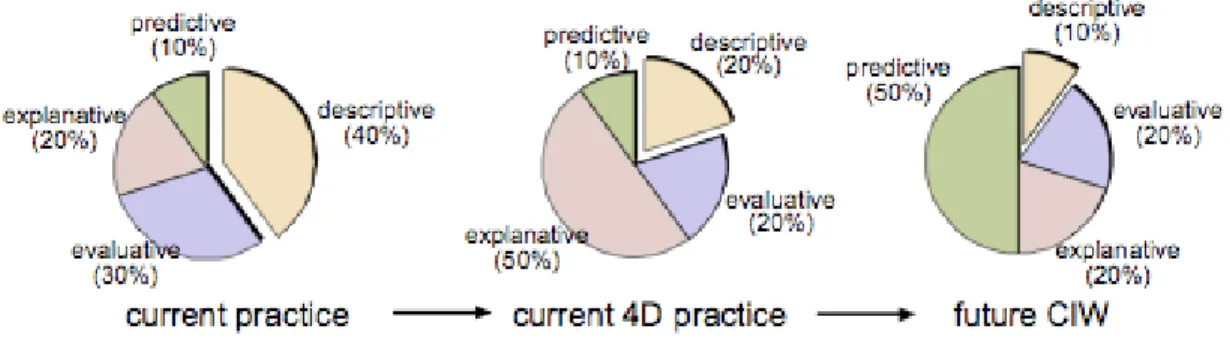
According to Liston’s study, it has been observed that significant time during the meetings is involved in describing various tasks (Descriptive) to other participants. 4D CAD modeling and immersive virtual environment can enhance the construction planning and plan communication process (Yerrapathruni 2003). It can also serve as an excellent tool for communication among the project participants, stakeholders and potential customers (Gopinath 2004). This fact illustrates an opportunity to introduce advanced visualization techniques and to make improvement in the way project information is communicated. A new type of Construction Information Technology (CIT) was proposed by Liston (2000) to change the time spent on the communication categories in the future Construction Information Workspaces (CIW). The current and future communication diagram by Liston is shown in Figure 4.
Figure 4: Current and Future Communication Diagram Source: Liston (2000)
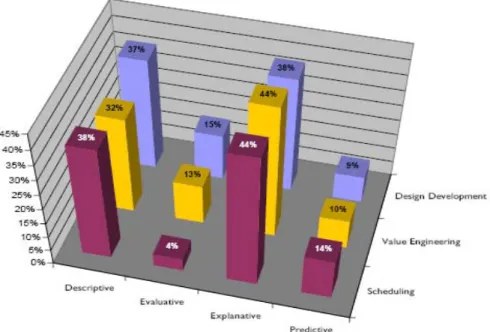
Fard (2006) adopted Liston’s proposed framework and conducted an observational study of collaborative decision-making in order to assess the performance of project teams in design development and coordination meetings. Three different types of meetings (traditional design development meetings, value engineering meetings, and scheduling meetings) were video recorded and coded to study how the various participants in these meetings spent their time on decision-making tasks. Figure 5
shows the time study results of these three types of meetings. It shows that most of the time is spent on descriptive and explanative tasks, and less time is spent on evaluative and predictive tasks for all these three types of meetings. This research provided a validation of the collaborative decision-making framework proposed by Liston (2000).
39
Figure 5 Time Spent of Decision Making Tasks on Design Development, Scheduling and Value Engineering Meetings
Source: Fard (2006)
In this research, student group meetings were examined using Stempfle’s theoretical framework, because students were trying to develop a construction schedule for a project and they functioned more like a design team to design a process (a construction schedule). Liston’s categories were considered, but the detailed categorization of discussions of student groups performing the scheduling task was difficult.
3.3 Virtual Reality
In the experiment conducted for this research, the Immersive Construction (ICon) Lab was extensively used, which provided students a virtual environment to interact with the 3D and 4D model. This section introduces the concept of virtual reality (VR), various types of VR display systems, and the applications of VR in engineering education.
3.3.1 Definition of Virtual Reality
Virtual reality (VR) is an experience in which a person is “surrounded by a three-dimensional computer-generated representation, and is able to move around in the virtual world and see it from different angles, to reach into it, grab it, and reshape it (Rheingold 1991).” VR includes graphics applications that allow users to walk through a simulated environment and, possibly, to interact with objects in it. Interactivity means “the interaction between computer and user which takes place through changes of viewed locations, typed commands, voice commands, mouse clicks, or other means of interfacing (Shiratuddin et al. 2004).” Interactivity is the most important features of VR and relates what people see in the virtual environment to the real world. An effective virtual environment must give the user as much control as possible over their surroundings.
VR has been used in the design process and found to be more efficient to check the design solutions than the traditional media (Petric et al. 2002). VR used in construction equipment simulation provides the planners visualization of assembly sequences and real-time virtual interactive modeling of construction equipment (Bosch
41 and Hastak 2002). VR was also used to visualize construction plans and schedules (Waley and Thabet 2003; Whisker et al. 2003), enable architectural walk-through (Shiratuddin et al. 2004), optimize site facility layout (Tam 2002) and communicate with project teams (Haymaker and Fischer 2001).
VR can enhance the simulation by providing (Petric et al. 2002):
• Immersion: Users are completely surrounded by the environment;
• Presence: Users have the sense of being in the environment;
• Interactivity: The environment allows the participant to be involved and the result of the actions done by the participant can be visualized in the VE;
• Autonomy: Participants are neither constrained in paths nor in views preset by others. They have the freedom and autonomy to explore any single part of the environment;
• Collaboration: Multiple users are able to take part and to interact in the same VE.
3.3.2 Virtual Reality Display
While previous construction visualization mainly focused on the enhancement of product design, a significant amount of work has been done to develop graphic display techniques which allow users to view and interact with 3D models. The graphical interface between computers and humans has greatly improved. Virtual environments use stereo-graphics, audio and several other input devices to provide users the ability to visualize and interact with data in 3D (Nelson et al. 1999).
Non-immersive desktop VR and Immersive VR have been used to simulate the construction process (Retik 1993). A desktop monitor is used by the user to interact with a virtual model in desktop VR. For immersive VR, a large scale display or head mounted display is used to immerse the user in the virtual environment. Kasik et al. (2002)summarized 14 different displays and their characteristics.
CAVE (CAVE Automatic Virtual Environment), which was designed in 1991, was the first large immersive projection display (Cruz-Neira 1993). It is a 10’×10’×10’ theater with three rear-projection screens for walls and a down-projection screen for the floor. A user’s head and hand are tracked with electromagnetic sensors. Stereographics’ LCD stereo shutter glasses are used to provide user 3D visual effect. CAVE and CAVE-like facilities have been successfully used in research for visualizing various complex systems. Usually these systems are used on a limited number of high-end research projects (Kalisperis et al. 2002). Due to the high cost and limited footprint of these display systems, they are not viable to be used for large scale educational purpose.
This research focuses on the use of an affordable, open footprint, three screen passive stereoscopic display system in the Immersive Construction (ICon) Lab at Penn State. Figure 6 is a rendering of the ICon Lab. The three screens, each is 6’ high by 8’ wide, provide a panoramic virtual reality environment by using rear projectors. Students can use all three screens to display a construction project to get the feeling of presence. Alternatively, they can use two screens to display the building geometry and the third screen to display construction schedule. The three screens can also be utilized Left Screen Middle Screen Workstati