Evaluation of Four Vertical Jump Tests:
Methodology, Reliability, Validity, and
Accuracy
Luis F. Aragón-Vargas
Escuela de Educación FísicaUniversidad de Costa Rica
Vertical jump performance tests can give considerably different results, even when different methods are used to analyze the same jump trial from the same subject. To evaluate and compare 4 different methods commonly used to measure vertical jump performance, 52 physically active men each performed 5 maximal vertical jumps. Ki-netic and kinematic data were used to analyze each trial using the 4 methods: a crite-rion test based on body center of mass displacement (VJPT), 2 methods based on ver-tical takeoff velocity as calculated from the force platform, and 1 method based on time in the air (JUMPAIR). All 4 methods showed excellent reliability (R > .97). Using VJPT as the criterion, the other 3 methods showed excellent coefficients of va-lidity (R > .95) but poor accuracy: The obtained vertical jump height scores were sta-tistically different among all methods (p < .01). JUMPAIR is considered a relatively simple and inexpensive method to obtain valid and reliable measures of vertical jump performance without an arm swing, provided the appropriate adjustments are made to the jump results.
Key words: reliability, validity, vertical jump
Vertical jumping is regarded as an important and attractive element of many sports such as basketball and volleyball. Papers are regularly published in exercise sci-ence publications, both lay and scientific, about training methods for vertical jump performance improvement (Adams, 1984; Bobbert & Van Soest, 1994; Brown, Mayhew, & Boleach, 1986; Clutch, Wilton, McGown, & Bryce, 1983; Cross, 1993; Kraemer & Newton, 1994; Miller, 1982; Newton, Kraemer, & Häkkinen, 1999; Wilson, Newton, Murphy, & Humphries, 1993). A key step in any jump training study is vertical jump measurement. Vertical jump tests are also common
Requests for reprints should be sent Luis F. Aragón-Vargas, FACSM, P.O. Box 686, 2350 San José, Costa Rica. E-mail: [email protected]
in physical education, fitness, and sports programs as a means to assess lower limb “power.” However, vertical jump performance scores may be considerably differ-ent depending on the test used, even when differdiffer-ent methods are used to analyze the same jump (H. Hatze, personal communication, November 11, 1992).
Traditionally, the most commonly used method is Sargent’s test (1924; cited in Johnson & Nelson, 1974), also known as the jump and reach test (e.g., Blattner & Noble, 1979; Clutch et al., 1983; Davies, Greenwood, & Jones, 1988; Genuario & Dolgener, 1980). This method is simple to use, requiring only a wall or board and chalk powder to make marks with your fingers. Johnson and Nelson (1974) re-ported a reliability of .93 and an objectivity of .93 for this test. Many scientists, however, have resorted to other methods using video systems, landing mats, or force platforms to be able to measure jump height during jumps without an arm swing or under more natural settings, or as an attempt to obtain a higher accuracy or more credibility.
The method called Vertical Jump Performance Test (VJPT) involves calculat-ing the exact position of the body center of mass (BCOM) over time, uscalculat-ing cine-matography or video techniques. Jump height is obtained by subtracting the position of BCOM when the participant is standing, from the peak BCOM position during flight (Aragón-Vargas, 1997; Bobbert, Huijing, & van Ingen Schenau, 1987; Pandy & Zajac, 1991). Because this method involves mechanically correct concepts, because the equipment used may be precisely calibrated, and because all the assumptions involved are generally accepted, VJPT is usually considered the standard or criterion method to evaluate vertical jump performance (Bobbert & Van Soest, 1994; Pandy & Zajac, 1991). However, only Aragón-Vargas (1996) provided an objective estimate of reliability for VJPT.
Alternative methods include applying particle dynamics equations to calculate takeoff velocity (TOVEL) of the body and jump height from force plate data (Dowling & Vamos, 1993), or using basic particle kinematics equations to calcu-late jump height from flight time, as measured by different timing devices (Asmussen & Bonde-Petersen, 1974; Bosco & Komi, 1979; Bosco, Luhtanen, & Komi, 1983; Komi & Bosco, 1978). Because the necessary equipment is often costly and difficult to use, and given that some of the calculations involve assump-tions that are not always acceptable, it is important to know the differences among jump height scores obtained using each method.
This study does not deal with an issue relatively common in measurement: How well does the score (in this case, the vertical jump height value obtained) represent the true performance of an individual? Instead, it deals with the following question: Given a particular performance (true or not), how well do different methods assess that performance? The reliability of four different methods commonly used to mea-sure vertical jump performance was under investigation, as well as the calculation of the actual test result differences among methods. Furthermore, the ability of each test to predict “actual” vertical jump performance, according to the VJPT standard,
was also under investigation. These are useful quantitative tools for the exercise sci-entist who wants to compare studies that have used different methodologies, or for the coach, trainer, or physical educator who needs to find out how much his or her test results are improved by using more costly and sophisticated methods.
METHOD Data Collection
Physically active male college students (N = 52) each performed five maximal ver-tical jumps, starting from the position of their choice, with their hands on their hips (arms akimbo). All participants gave their informed consent in accordance with the policy statement of the University of Michigan. They completed three practice jumps before data collection, and were required to wait for 1 min after each trial. Participants performed the jumps barefooted, wearing only a swimsuit or pair of shorts. Five reflective markers were placed on the right side of the body, on the glenohumeral joint (shoulder), the greater trochanter (hip), the lateral condyle of the femur (knee), the lateral malleolus (ankle), and the fifth metatarsal (toe). All five trials of all the participants were used for calculating reliability, but only the trial corresponding to the highest jump, as assessed using Equation 1, was used for the other comparisons. This is in agreement with the procedure used in sports com-petitions and performance testing involving several trials—the best trial is usually registered as the test or competition score.
Ground reaction forces and moments of force were collected with a Bertec force plate (Model 4060A), and were sampled at 300 Hz. A video-based (60 Hz), real-time, three-dimensional motion analysis system (Motion Analysis Corp.) was used to collect and process kinematic data. Kinematic data were filtered with a low-pass, fourth-order Butterworth filter with an effective cutoff frequency of 8 Hz.
Basic anthropometric data were obtained using standard sliding calipers, tape mea-sures, and the force platform. Body mass and body height were measured according to Lohman, Roche, and Martorell (1988). Thigh length, midthigh circumference, shank length, calf circumference, malleolus width, malleolus height, and foot length were obtained according to Vaughan, Davis, and O’Connor (1992). These data were used for the calculation of segmental centers of mass (see following).
Data Analysis
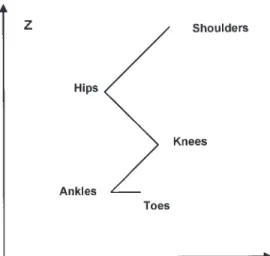
The biomechanical model used and all analytic procedures have been described in detail elsewhere (Aragón-Vargas, 1994, 1997). Briefly, the human body was mod-eled as a planar, rigid-body system comprising four segments linked by frictionless, hinge joints (Figure 1). Kinetic and kinematic data were used to obtain the four different measures of jump height.
The VJPT requires a precise calculation of the BCOM position throughout the movement from video data. Calculation of the BCOM position was performed using the method of summation of torques, which in turn requires the calculation of the center of mass position of each segment over time. Segmental centers of mass were calculated according to the procedure of Vaughan et al. (1992), with the exception of head, arms, and trunk (HAT), which was calculated according to Aragón-Vargas (1994), based on Clauser, McConville, and Young (1969) and Hinrichs (1990).
VJPT was obtained directly from the BCOM position data by subtracting the vertical position of BCOM while standing from the peak vertical position of BCOM during flight:
VJPT = zBCOMpeak– zBCOMstanding (1)
VJPT is used in this study as the criterion or standard for comparison. Two al-ternate methods used in biomechanics for the calculation of jump height require calculating vertical TOVEL. TOVEL was obtained from the instantaneous vertical velocity versus time curve, which in turn was calculated integrating the propulsive force with respect to time and normalizing by body mass (mass) according to
zBCOM F dt mass zp t tto =
∫
0 (2) FIGURE 1 Biomechanical model. Segments (i = 1 to 4) are defined by the following markers: Segment 1 (head, arms, and trunk), from shoulder to hip; Segment 2 (thighs), from hip to knee; Segment 3 (shanks), from knee to ankle; and Segment 4 (feet), from ankle to toe.where Fzpis propulsive force, obtained from subtracting body weight from the
ver-tical ground reaction force; t0is the beginning of data collection, and ttois the instant
of takeoff.
Theoretically, jump height depends on both vertical TOVEL and BCOM posi-tion at takeoff (Bobbert & van Ingen Schenau, 1988), according to the equaposi-tion
[
]
JUMP2= (TOVEL) * (2 2g)−1 +zBCOMto−zBCOMstanding (3) where g is the acceleration due to gravity, 9.81 m · s–2.
Equation 3 uses information from both the force platform and the video equip-ment, and therefore is not very practical to use, although it is conceptually correct. Ignoring BCOM elevation before takeoff, vertical jump height may be obtained from vertical TOVEL alone, requiring only force plate data:
JUMP3 = (TOVEL)2* (2g)–1 (4)
Lastly, the height of a vertical jump is reflected on the time the body is in the air. Time in the air (tair) may be calculated as the difference between the instant of takeoff and the instant of landing. Takeoff and landing times were obtained from the vertical ground reaction force (Fz) data, when Fz < 3.0 N and Fz > 3.0 N, re-spectively. Jump height is then obtained using the equation
JUMPAIR=g tair − * * 2 2 2 1 (5) Statistical Analysis
The first step in assessing the usefulness of a test is to determine its reliability; that is, the ability of the test to give consistent results. According to Kerlinger (1988), a correlation coefficient for reliability (rtt) may be obtained by partitioning the
vari-ance obtained from m measurements applied to n subjects, into three components (variance among subjects, variance within subjects, and variance due to error or re-sidual variance), using a one-way repeated measures model (also called a two-way analysis of variance by some authors). The sums of squares are used to obtain the ratio r MSS MSE MSS MSE MSS tt = − = −1 (6)
where MSS is the Subjects Sum of Squares divided by (n – 1) and MSE is the Resid-ual (Error) Sum of Squares divided by [(m – 1)(n – 1)]. (See Kerlinger, 1988; Table 26.2 and Equation 26.5.)
The standard error of measurement (SEM) is then computed by using the group standard deviation (SD) and the reliability of the test (Rtt; Baumgartner, 1989)
SEM = SD 1−Rtt (7)
which is equal to MSE if calculated according to Kerlinger.
Validity coefficients, regression coefficients, and prediction errors were calcu-lated using simple linear regression techniques, with VJPT as the dependent vari-able and each of the other methods as the independent varivari-able, according to the general linear model
y =β0+βx + Ej (8)
This evaluation of validity is in agreement with common procedures to assess criterion-related evidence of validity (Kerlinger, 1988; Wood, 1989). Usually, when such procedures are used, the criterion test and the “new” test have different units of measurement and have been administered on separate occasions. In this case, however, there was actually only one test, and all results are given in milli-meters. Therefore, it is possible to evaluate not only the correlation of the measure-ments (concurrent validity) and the regression coefficients (predictive validity), but also whether all methods provide the same results, a reasonable expectation given that they are all measures of the same performance of the same participants. This agreement between methods is called accuracy in this article.
To evaluate the accuracy, each individual’s best trial was used. Group aver-age jump heights obtained using each of the four methods were compared using Student’s t test for paired samples, making Bonferroni’s adjustment for multiple comparisons, at an acceptable significance level (p < .01). The 95% family con-fidence intervals for the difference between VJPT and each of the other three methods were also calculated, using Bonferroni’s adjustment for family confi-dence coefficients.
RESULTS
The basic descriptive statistics for the participants may be found in Table 1. Aver-age body weight (74.3 kg) was slightly above the U.S. population averAver-age for a body height of 1.79 m (71.8 kg; Metropolitan Life Insurance Company, 1959). Best trial jump heights (VJPT) ranged from 372 mm to 663 mm (M = 520 mm) and had a
coefficient of variation of 13.4%. The group was heterogeneous: There were 16 participants, or 31% of the sample, outside 1 SD of the average VJPT.
Reliability data are presented in Table 2. The standard or criterion method (VJPT) shows a correlation coefficient of .994 for a standard error of measurement of 12.7 mm.
Descriptive statistics for the jump height scores according to each of the four methods used may be found in Table 3. The highest values were obtained for the standard method, VJPT. The other three methods (JUMP2, JUMP3, and JUMPAIR) resulted in jump height averages that were 15, 159, and 118 mm lower than VJPT, respectively. These three differences were statistically signifi-cant (p < .01); furthermore, all the differences between any two methods were statistically significant. Figure 2 presents the 95% confidence intervals for each difference between VJPT and one of the other three methods. This figure shows the underestimation of jump height normally obtained from using each of those methods.
The simple regression analysis results are shown in Table 4. Coefficients of cor-relation (R) represent the validity of each method, using VJPT as the criterion or pre-viously validated test. All methods were able to explain more than 90% of the vertical jump height variability (see column for R2). The estimated prediction error
TABLE 1 Descriptive Statistics (N= 52) Variable (units) M SD CV (%) Age (years) 20.2 2.1 10.4 Weight (kg) 74.3 8.6 11.6 Height (m) 1.79 0.06 03.4 VJPT (mm) 506 70 14.2
Note. Vertical jump performance test (VJPT) statistics include all five trials. Coefficient of variation (CV) = 100 (SD/M).
TABLE 2
Reliability Calculations for Four Jump Tests. (N= 49,i= 5)
VJPT JUMP2 JUMP3 JUMPAIR
Rtt .994 .970 .986 .994
(Rtt)2 .987 .942 .972 .987
SEM (mm) 12.7 27.8 18.0 12.1
Note. Three subjects had less than five valid trials and were not included in these calculations. VJPT = vertical jump performance test; i = number of trials per subject; Rtt= reliability correlation coefficient; (Rtt)2= reliability coefficient of determination.
(square root of MSE) of all three methods is close to 20 mm. Lastly, it must be pointed out that theβcoefficients for Models 2 and 3 are very close to 1.0, and therefore theβ0
constant is similar to the jump height average differences indicated earlier. DISCUSSION
Reliability
Before making any meaningful comparisons among jump test methods, it is neces-sary to have a good standard or criterion. In this particular case, VJPT had been cho-sen as the standard based on theoretical arguments. The results show that this
TABLE 3
Descriptive Statistics for Each Jump Height Method (N= 52)
VJPT JUMP2 JUMP3 JUMPAIR
Average (mm) 520a 505a 361a 402a
Minimum (mm) 372 365 240 263
Maximum (mm) 663 667 503 550
SD (mm) 70 77 66 67
CV (%) 13.4 15.3 18.3 16.6
Note. The trial corresponding to the best vertical jump performance test (VJPT) trial from each participant was used in the calculations. From “Comparación de cuatro métodos para la medición del salto vertical,” by L.F. Aragón-Vargas, 1996, Revista Educación, 20(1), p. 37. Copyright 1996 by the Editorial de la Universidad de Costa Rica. Reprinted with permission.
aAll mean differences are statistically significant, p < .01.
FIGURE 2 The 95% confidence intervals for the difference between the standard method and each one of the other methods (best trial only, N = 52). Dark bars show the actual confidence in-tervals. From “Comparación de cuatro métodos para la medición del salto vertical [Comparison of four methods for measurement of the vertical jump],” by L.F. Aragón-Vargas, 1996, Revista
Educación, 20(1), p. 37. Copyright 1996 by the Editorial de la Universidad de Costa Rica.
method has an excellent reliability and a small SEM (see Table 2). The only method with similar reliability and a lower SEM was JUMPAIR, but JUMPAIR is an “in-complete” measurement of vertical jump performance because it does not take into consideration the displacement of the BCOM prior to takeoff. These facts support the choice of VJPT as the criterion test.
VJPT was compared with three other methods for testing vertical jump height, but not with the one most commonly used, Sargent’s jump-and-reach test. Sargent’s test involves an arm swing during the propulsion phase, and this addi-tional variable precludes any meaningful comparisons from being made.1
Table 3 presents two measures of variability–SD, and CV. The former is a mea-sure of absolute variability, in this case, in millimeters; however, the latter is a measure of variability relative to average jump height score. Because CV takes into consideration the group average jump height score, two methods with similar SD could have very different CV.
Under normal testing circumstances, variability in the results comes from two major sources: “true” variability (showing differences in performance both be-tween and within subjects) and the error introduced by the measuring method. The four variables presented in Tables 2 and 3 are measures of the same vertical jump performance. Therefore, “true” variability (in this case only from differences be-tween participants, as only the trial corresponding to the best VJPT trial was used for the analysis) must be the same for all methods, and it is then possible to use VJPT as the standard to compare both the absolute (SD) and relative (CV) variabil-ity (see Table 3) introduced by the other methods. This value can be expressed as a
TABLE 4
Simple Regression Analysis (N= 52)
Model R R2 MSE Error
VJPT = 87 + 0.857aJUMP2 .952 .906 .464E-03 .0215 VJPT = 154 + 1.014bJUMP3 .961 .924 .376E-03 .0194 VJPT = 117 + 1.002bJUMPAIR .962 .926 .369E-03 .0192
Note. Only the best trial was used in the analysis. All statistical models are significant (p < .0001). VJPT, JUMP2, JUMP3, and JUMPAIR all in millimeters. VJPT = vertical jump performance test. MSE is calculated as the residual sum of squares divided by the degrees of freedom. Error is the prediction error, and is equal to the square root of MSE. From “Comparación de cuatro métodos para la medición del salto vertical,” by L.F. Aragón-Vargas, 1996, Revista Educación, 20(1), p. 38. Copyright 1996 by the Editorial de la Universidad de Costa Rica. Reprinted with permission.
aThis coefficient is significantly different from 1.0 (p < .01).bThese coefficients are not significantly different from 1.0 (p > .01).
1A separate study using the Sargent jump test with 56 participants performing five jumps each showed a reliability correlation coefficient of .9859, which is still very good (unpublished data).
difference (∆), where SD or CV for VJPT is subtracted from the respective value of each other method.
Relative variability is higher for all three methods compared to VJPT. Addi-tional absolute variability is only introduced by JUMP2 (∆SD = 7 mm), whereas JUMP3 and JUMPAIR show smaller values than VJPT (∆SD = –4 mm and –3 mm, respectively). An instrument or method may show less variability because it is less sensitive and does not discriminate so clearly among different performances, or because it really has a smaller error of measurement. Using this information to-gether with the reliability coefficients and SEM values (Table 2), it is clear that among these three methods, JUMPAIR is the most stable, consistent measure of the actual vertical jump score, whereas JUMP2 is the least consistent. Whether JUMPAIR is a less sensitive test remains an open question.
Validity and Accuracy
All four vertical jump test methods give different results; that is, the three alter-native methods are not accurate, despite having excellent validity coefficients (R > .95). Both validity and accuracy must be considered when evaluating a new test. In this study, because the validity coefficients and prediction errors ob-tained are excellent, the accuracy problem may be solved by applying the re-gression equations from Table 4 to obtain “actual” vertical jump performance from any of the alternative tests. An important question is, however, why do all methods give different results?
JUMP2 is theoretically correct, but it requires a perfect synchronization be-tween the force plate and video signals. A synchronization error will cause the test administrator to use a takeoff position (obtained from video data) that does not cor-respond to the same instant of the TOVEL (obtained from the force platform). An error of only 16.7 ms (one frame at a sampling rate of 60 Hz) would result in under-or overestimating the relative position of takeoff (and therefunder-ore jump height) by 44 mm (Aragón-Vargas, 1994).
The calculation of JUMP3 involves only force-plate data, and therefore has no signal synchronization problems. On the other hand, it does not take into ac-count the relative takeoff height of the participant. This should not pose any problem, because previous researchers have found that the major contribution to vertical jump height differences among participants comes from TOVEL, whereas the relative takeoff height is very similar from one participant to an-other (Aragón-Vargas, 1997). The 95% confidence interval for relative takeoff height in this study was 144 ± 7.3 mm, which, according to Equations 1, 3, and 4, should agree with the difference between JUMP3 and VJPT. The 95% confi-dence interval for the difference was 159 ± 7.0 mm, showing a discrepancy of about 15 mm.
Lastly, the calculation of jump height using the method JUMPAIR has been criticized in the literature because some of the assumptions involved are not cor-rect (Dowling & Vamos, 1993; H. Hatze, personal communication, November 11, 1992). One clear limitation is that Equation 5 assumes that the time the cen-ter of mass of the body is falling is equal to one-half of the time in the air. In other words, the time that BCOM travels upward should be equal to the time it travels downward, which is only true if the participant takes off and lands with the body in the same position. In this study, the time down was significantly lon-ger than time up (average difference = .016 sec, p < .0001), suggesting the par-ticipants landed with their bodies partially crouched.2 This results in an
overestimation of the distance from takeoff to peak, as may be seen comparing JUMPAIR with JUMP3, a method that does not consider relative takeoff height either (see Table 3). The actual value, however, is lower than VJPT, because displacement of BCOM from standing to takeoff is not taken into account. The results reported here for JUMPAIR should not be different if shoes were worn by the participants, because any changes introduced by the shoes should be con-sistent from takeoff to landing.
Practical Recommendations
Results from Tables 2, 3, and 4 and Figure 2 provide the necessary information for choosing from the three alternative methods for predicting actual jump height, as measured by VJPT. All three methods have excellent reliability, an essential first step. Validity coefficients are also excellent for all three tests. JUMP2 gives the smallest average difference in jump height, but regression analysis (see Table 4) shows that the estimation error is larger for this method. Furthermore, because its slope (βcoefficient) is significantly different from 1.0, the estimation error will vary with the level of the results, underestimating actual jump height for some par-ticipants, and overestimating it for others. JUMP3 and JUMPAIR show larger aver-age differences with the criterion test, but the differences are more stable, inde-pendent of the level of the results, and the prediction error is smaller.
Usually, vertical jump performance researchers are interested in comparing jump height before and after a particular treatment (a training program). For this type of comparison, it is not really important if different methods give different re-sults, provided the same method is used for the pre- and posttests, and provided the method used shows good reliability and validity coefficients, as is the case for all 2Apparently, this situation is worsened when using an arm swing. A separate study (mentioned in Footnote 1) has shown the reliability of JUMPAIR to decrease under these circumstances, to .956, which may be partially accounted for by the variation in the position of the arms at takeoff and landing (unpub-lished data).
three methods evaluated in this study.3If the investigator or coach is more
inter-ested in being able to compare results obtained with different methods, it is clear that comparisons will be meaningless unless the differences inherent to each method are taken into account by using the regression equations from Table 4.
Considering all the aforementioned criteria, and taking into account the equip-ment necessary for testing according to each method, the most simple and least ex-pensive method is the one that calculates jump height from time in the air, using a good landing mat and a timer. Time in the air may also be obtained from force-plate data, as in this study. According to the data presented in this article, very little reliability and validity is compromised, and the results may be used to calculate actual jump height with confidence.
ACKNOWLEDGMENTS
This research project was made possible by a Rackham Dissertation Grant and a Rackham Predoctoral Fellowship from the University of Michigan, and Grant VI– 245–95–276, School of Physical Education, University of Costa Rica.
I appreciate the valuable support from our School Director, Wilfridio Mathieu, and the assistance of Cinthya Campos during the completion of the project. Spe-cial thanks to Walter Salazar for his input to the article. Data collection was possi-ble thanks to Melissa Gross, Human Movement Research Center, Division of Kinesiology, The University of Michigan.
REFERENCES
Adams, T. (1984). An investigation of selected plyometric training exercises on muscular leg strength and power. Track and Field Quarterly Review, 84, 36–40.
Aragón-Vargas, L. F. (1994). Kinesiological limits of vertical jump performance. Dissertation
Ab-stracts International, 55(8), 2316–A. (University Microfilms No. DA9500881)
Aragón-Vargas, L. F. (1996). Comparación de cuatro métodos para la medición del salto vertical [Com-parison of four methods for measurement of the vertical jump]. Revista Educación, 20, 33–40. Aragón-Vargas, L. F. (1997). Kinesiological factors in vertical jump performance: Differences among
individuals. Journal of Applied Biomechanics, 13, 24–44.
Asmussen, E., & Bonde-Petersen, F. (1974). Storage of elastic energy in skeletal muscles in man. Acta
Physiologica Scandinavica, 91, 385–392.
Baumgartner, T. A. (1989). Norm-referenced measurement: Reliability. In M. J. Safrit & T. M. Wood (Eds.), Measurement concepts in physical education and exercise science (pp. 45–71). Champaign, IL: Human Kinetics.
3This practical application assumes that the reliability obtained in this study when trials are separated by only a few minutes can be extrapolated to a study when trials are separated by several weeks or months.
Blattner, S., & Noble, L. (1979). Relative effects of isokinetic and plyometric training on vertical jump-ing performance. Research Quarterly, 50, 583–588.
Bobbert, M. F., Huijing, P. A., & van Ingen Schenau, G. J. (1987). Drop jumping I. The influence of jumping technique on the biomechanics of jumping. Medicine and Science in Sports and Exercise,
19, 332–338.
Bobbert, M. F., & van Ingen Schenau, G. J. (1988). Coordination in vertical jumping. Journal of
Biomechanics, 21, 249–262.
Bobbert, M. F., & Van Soest, A. J. (1994). Effects of muscle strengthening on vertical jump height: A simulation study. Medicine and Science in Sports and Exercise, 26, 1012–1020.
Bosco, C., & Komi, P. V. (1979). Mechanical characteristics and fiber composition of human leg extensor muscles. European Journal of Applied Physiology, 41, 275–284.
Bosco, C., Luhtanen, P., & Komi, P. V. (1983). A simple method for measurement of mechanical power in jumping. European Journal of Applied Physiology, 50, 273–282.
Brown, M. E., Mayhew, J. L., & Boleach, L. W. (1986). Effect of plyometric training on vertical jump per-formance in high school basketball players. Journal of Sports Medicine and Physical Fitness, 26, 1–4. Clauser, C. E., McConville, J. T., & Young, J. W. (1969). Weight, volume, and center of mass of
seg-ments of the human body. AMRL Technical Report 69–70, Wright-Patterson Air Force Base, Ohio.
(NTIS# AD–710–622)
Clutch, D., Wilton, M., McGown, C., & Bryce, G. R. (1983). The effect of depth jumps and weight train-ing on leg strength and vertical jump. Research Quarterly for Exercise and Sport, 54, 5–10. Cross, T. (1993). Rationale and coaching points for Olympic style lifting to enhance volleyball
perfor-mance. National Strength and Conditioning Association, 15, 59–61.
Davies, B. N., Greenwood, E. J., & Jones, S. R. (1988). Gender difference in the relationship of perfor-mance in the handgrip and standing long jump tests to lean limb volume in young adults. European
Journal of Applied Physiology, 58, 315–320.
Dowling, J. J., & Vamos, L. (1993). Identification of kinetic and temporal factors related to vertical jump performance. Journal of Applied Biomechanics, 9, 95–110.
Genuario, S. E., & Dolgener, F. A. (1980). The relationship of isokinetic torque at two speeds to the ver-tical jump. Research Quarterly for Exercise and Sport, 51, 593–598.
Hinrichs, R. N. (1990). Adjustments to the segment center of mass proportions of Clauser et al. (1969).
Journal of Biomechanics, 23, 949–951.
Johnson, B. L., & Nelson, J. K. (1974). Practical measurements for evaluation in physical education (2nd ed.). Minneapolis, MN: Burgess.
Kerlinger, F. N. (1988). Investigación del comportamiento [Foundations of behavioral research] (2nd ed.). Mexico D. F.: McGraw-Hill.
Komi, P. V., & Bosco, C. (1978). Utilization of stored elastic energy in leg extensor muscles by men and women. Medicine and Science in Sports, 10, 261–265.
Kraemer, W. J., & Newton, R. U. (1994). Training for improved vertical jump. Sports Science
Ex-change, 7(6), 1–6.
Lohman, T. G., Roche A. F., & Martorell, R. (1988). Anthropometric standardization reference manual. Champaign, IL: Human Kinetics.
Metropolitan Life Insurance Company. (1959). Actuarial tables. New York: Author.
Miller, B. P. (1982). The effects of plyometric training on the vertical jump performance of adult female subjects. British Journal of Sports Medicine, 16, 113.
Newton, R. U., Kraemer, W. J., & Häkkinen, K. (1999). Effects of ballistic training on preseason prepa-ration of elite volleyball players. Medicine and Science in Sports and Exercise, 31, 323–330. Pandy, M. G., & Zajac, F. E. (1991). Optimal muscular coordination strategies for jumping. Journal of
Biomechanics, 24, 1–10.
Vaughan, C. L., Davis, B. L., & O’Connor, J. C. (1992). Dynamics of human gait. Champaign, IL: Hu-man Kinetics.
Wilson, G. J., Newton, R. U., Murphy, A. J., & Humphries, B. J. (1993). The optimal training load for the development of dynamic athletic performance. Medicine and Science in Sports and Exercise, 25, 1279–1286.
Wood, T. M. (1989). The changing nature of norm-referenced validity. In M. J. Safrit, & T. M. Wood (Eds.), Measurement concepts in physical education and exercise science (pp. 23– 44). Champaign, IL: Human Kinetics.