G. L. Zoubek 2 , E. R. Peo, Jr., B. D. Moser, T. Stahly and P. J. Cunningham
University o f Nebraska, Lincoln 3 68503
Summary
Four catheterized crossbred (Y x H) barrows were used in a 4 x 4 latin square arrangement of treatments in a completely randomized block design, to determine the effect of source on copper uptake as deter- mined by serum Cu concentration changes over a 7.5-hr sampling period. Dietary treatments were: (A) basal with no added Cu, (B) basal + 5.2 mg Cu (from CuSO4)/kg of diet, (C) basal + 5.2 mg Cu (EDTA chelated Cu)/kg of diet, and (D) basal + 5.2 mg Cu (from CuSO4) + 34.1 mg ethylene diamine tetra acetic acid (EDTA)/kilogram of diet. Animals were placed on the semi-purified basal diet for 5 days, fasted for 1 day and then given their dietary treatment. Following consumption of the dietary treatment, blood samples were collected from each animal at 15-min intervals for 3.0 hr and at 1.5-hr intervals over the remaining 4.5 hr of a 7.5-hr sampling period. The samples were collected via jugular catheters and during the 4-week trial each animal was exposed to all dietary treatments. Serum Cu concentration was not significantly ( P < .05) affected by dietary treatment. However serum Cu con- centrations did change significantly ( P < .05) during the 7.5-hr sampling period. A significant
~Published with the approval of the Director as Paper No. 3846, Journal Series, Nebr. Agr. Exp. Sta. Research reported was conducted under Project 13-22. 2Current address County Extension Agent, Holt County, O'Neill, Nebraska 68763.
3Department of Animal Science. Acknowledge- ment is made to John Welch and Larry MeMullen for their assistance with the conduct o f the experiment and development of certain laboratory procedures.
( P < .01) animal x sampling time interaction was also observed. The results indicate that prechelated Cu or dietary additions o f EDTA had little influence on the efficiency of Cu uptake by swine. Sampling time following consumption of a diet was important as evident from the reflected changes in serum Cu concentration.
Introduction
Numerous studies have shown that levels to 250 ppm added dietary Cu have improved gains and feed conversion of growing pigs. These favorable results have been reported by Barber e t al. (1955), Hawbaker e t al. (1961), Braude (1965), Wallace (1967), Castell and Bowland (1968), the N.R.C.-42 Committee on Swine Nutrition (1970); Kline et al. (1972). However when high levels of Cu are fed, liver Cu concentrations are greatly increased as reported by DeGoey et al. (1971), Kline e t al. (1971) and Gipp et al. (1973).
Chelation has been suggested as a method to improve utilization of trace minerals by animals. Davis et al. (1962) observed that when chicks were fed diets deficient in Cu but supplemented with EDTA, the EDTA reduced the chicks' requirements or increased the availability of Cu, thus preventing Cu defi- ciency.
The purpose of the research reported herein was to determine the effect of source of copper and a chelating agent on copper uptake by growing swine.
Materials and Methods
Four crossbred (Y x H) barrows weighing 880
SOURCE ON COPPER UPTAKE BY SWINE 881 approximately 28 kg were used in a 4 x 4 latin
square arrangement of treatments in a com- pletely randomized block designed experiment. The animals were housed individually in an environmentally regulated swine research unit. The walls and two thirds of the floor were of concrete structure with a front gate made of galvanized metal. The remainder of the floor area consisted of a 25.4 mm wide galvanized metal grid. The pigs were watered a d libitum from automatic drinking fountains (water analyzed 1.3 mcg/ml Cu) and received their diets from galvanized metal feeders. The pigs were weighed weekly and fed a daily ration (5% of body weight "9) every morning at 8:00 am. This ration furnished enough energy for .24 kg of gain per day during the 28-day trial.
A semi-purified 14% protein diet (composi- tion, table 1) was used for all treatments. The experimental dietary treatments were as fol- lows: (A) Basal with no added Cu; (B)Basal plus 5.2 mg Cu (CuSO4)/kg o f diet 4 ; (C) Basal plus 5.2 mg Cu (pre-chelated Cu)/kg of diet s ; and (D) Basal plus 5.2 mg Cu (CuSO4) and 34.1 mg EDTA/kg of diet. 6
Since the objectives of this experiment required frequent blood sampling, a catheter was surgically inserted into the jugular vein as described by Zimmerman e t al. (1973). After 10 to 14 days of recovery, the animals were considered ready for frequent blood sampling with hopefully no stress to the animal.
All of the pigs were placed on the basal diet (A) 5 days prior to the first blood sampling and fasted 1 day prior to the initial treatment sampling. The purpose of fasting was to initiate immediate consumption o f the allotted feed following which blood samples were to be taken. As each pig was given its experimental diet (A, B, C, or D), 5 mls of blood was removed with subsequent samples taken at
4 T h e basal diet analyzed 4.8 m g C u / k g o f diet. The N R C suggested levels o f Cu for growing swine is 10 nag C u / k g o f diet, so 5.2 mg Cu was a d d e d / k g o f diet.
5Sequestrene Na 2Cu Copper Chelate. Geigy Agricultural Chemicals, Ardsley, New York.
6(Ethylene d i n i t r i l o ) - t e t r a acetic acid tetra sodium salt. Matheson Coleman Bell Manufacturing Chemists, N o r w o o d , Ohio. Based on previous w o r k at the station by A. Owen, a molar ratio o f 1:1 for EDTA: total Cu was used.
15-rain intervals for the initial 3.0 hr and at 1.5- hr intervals for the following 4.5-hr of a 7.5-hr collection period. The pigs were then returned to diet A which contained no added Cu for 5 days and the procedure described above repeated until each animal had i~een exposed to each of the four experimental diets.
The blood samples were allowed to coag- ulate and were then centrifuged at 2,000 RPM for 10 minutes. The serum was transferred to a clean plastic test tube and frozen until analyzed for copper. The serum samples were allowed to thaw and were prepared for analysis using the procedure outlined by Olson and Hamlin (1968). The samples were analyzed for Cu by atomic absorption spectroscopy by procedures outlined by Pe rkin-Elmer ( 1971).
Since blood samples were collected fre- quently from the experimental animals, samples were also obtained at random intervals to determine if changes in hemoglobin levels and packed cell volume (PCV) occurred due to frequency of sampling. PCV were determined by the microcentrifuge technique described by Merck (1966) and hemoglobin levels were measured by the cyanomethemoglobin method.
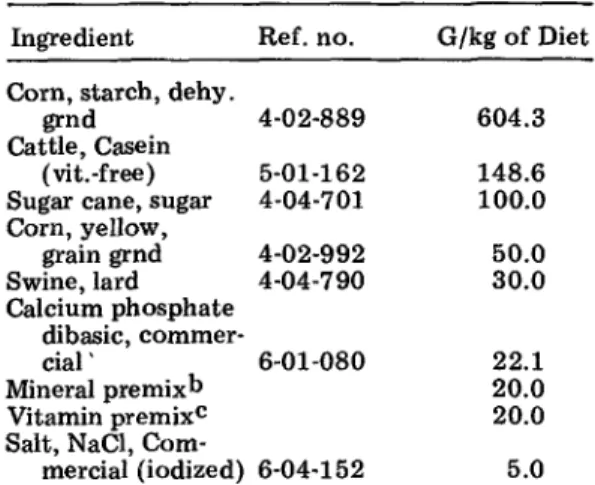
TABLE 1. COMPOSITION OF BASAL DIET a Ingredient Ref. no. G/kg of Diet
Corn, starch, delay.
grnd
Cattle, Casein
(vit.-free) Sugar cane, sugar Corn, yellow, grain grnd Swine, lard Calcium phosphate dibasic, commer- cial' 6-01-080 Mineral premixb Vitamin premix c Salt, NaC1, Com-
mercial (iodized) 6-04-152 4-02-889 604.3 5-01-162 148.6 4-04-701 100.0 4-02-992 50.0 4-04-790 30.0 22.1 20.0 20.0 5.0
aCalculated c o m p o s i t i o n : protein, 14%, Ca, .65% and P, .50%.
bMineral a d d i t i o n / k g o f diet: iron, 100 rag; m a g n e s i u m , 400 rag; manganese, 20 n~g; and zinc, 50 milligrams.
cVitamin a d d i t i o n / k g o f diet: v i t a m i n A, 2,600 IU; vitamin D, 250 IU; choline chloride, 400 nag; p a n t h o t h e n i c acid, 22 nag; niacin, 20 rag; vitamin K, 4.4 rag; riboflavin, 2.4 rag; t h i a m i n e , 2.2 nag; pyridoxine, 2.2 rag; and vitamin B] 2, .022 milligrams.
TABLE 2. EFFECT OF SOURCE OF DIETARY COPPER ON SERUM Cu CONCENTRATION MEASURED OVER 7.5 HR POST FEEDING OF PIGS
PREVIOUSLY FASTED FOR 1 DAY a
Sample time
Dietary treatmentsb,c
A B C D
basal with basal with 5.2 basal plus basal plus no added Cu mg Cu (CuSO4)/ 5.2 mg Cu 5.2 mg Cu
kg of diet (chelated Cu)/ (CuS04) and kg of diet 34.1 mg EDTA/ kg of diet Initial 15 m i n 30 rain 45 m m 1 hr 00 rain 1 hr 15 m m 1 hr 30 mln 1 hr 45 m m 2 hr 00 rain 2 hr 15 m m 2 hr 30 mm 2 hr 45 m m 3 hr 00 mln 4 hr 30 m m 6 hr 00 m m 7 hr 30 m m Serum Cu, mcg/ml 2.36 2.63 2.44 2.46 2.27 2.41 2.43 2.57 2.45 2.55 2.35 2.56 2.25 2.22 2.34 2.60 2.33 2.23 2.35 2.39 2.32 2.34 2.40 2.19 2.34 2.39 2.38 2.28 2.35 2.53 2.44 2.54 2.18 2.31 2.33 2.36 2.43 2.35 2.37 2.32 2.41 2.37 2.41 2.32 2.53 2.42 2.41 2.56 2.71 2.53 2.55 2.49 2.69 2.38 2.45 2.47 2.58 2.37 2.47 2.50 2.43 2.37 2.46 2.48
aValues represent mean of f o u r animals/trt.
bDifferenee due to sampling time significant (P < .05). CSamplin~ time x animal interaction significant (P <: .01).
2.8 BASAL 2.7 2.6 2.5 2.4 2,3 ~ ~.2 ~ 2.1 d o i ~ i ,~ ~ ~ -~ e i ;~.S ' B A S A L + 5 . 2 m g ADDED
Cu (CHELATED Cu)/k~l OFOIET 2 . T ' 2 . 6 ~.4 ~.S 2.1 . 9 9 : ; 9 9 . BASAL + 5.2 mg ADDED Cu (CuSO4)/ItgOF OIET
BASAL + 5.2 m9 ADOs Cu (CuSO4Wk0 OF OIET EDTA IN AN EQUAL MOLAR RATIO TO TOTAL COPRIER
, . , . . , . .
(HOURS) (HOURS)
Figure 1. Effect of dietary Cu source on blood serum Cu concentration measured over 7.5 hr post feeding of pigs previously fasted for 1 day.
Analyses of variance of the data were conducted as outlined in Steele and Torrie (1960).
Results and Discussion
The results of dietary Cu source on blood serum Cu levels following the consumption of a diet containing k n o w n concentrations and sources of Cu b y fasted animals are summarized in table 2. The changes in serum Cu concentration are graphically shown in figure 1. No significant differences due to dietary treatment were observed b u t serum Cu concentrations appeared to be less variable on the average in pigs fed chelated Cu.
There was a significant (P < .05) difference in serum Cu concentration due to sampling time. Serum Cu concentration tended to decrease consistently across treatments during the first 2.0 hr of sampling, t h e n increased and reached a peak at 3.0 hr and then tended to plateau near initial levels over the remaining 4.5
SOURCE ON COPPER UPTAKE BY SWINE 883 2 . 7
~
2 . 6 2 . 5 tic 2 . 4 84 d z.s.'i
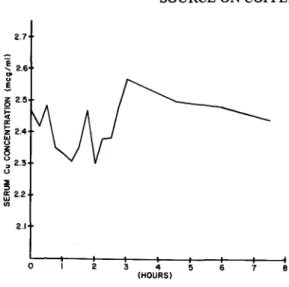
a: 2 . 2 , 2.1 I I I I ! I | | 0 I 2 S 4 S 6 7 S (HOURS)Figure 2. Mean serum Cu concentration changes measured over 7.5 hr post feeding of pigs previously fasted for 1 day.
hr of the experimental period. The mean serum Cu concentration for all treatments can be seen in figure 2. Serum Cu concentrations were 2.47 mcg/ml initially, 2.29 mcg/ml at 2.0 hr, 2.57 mcg/ml at 3.0 hr and 2.44 mcg/ml at 7.5 hr post feeding.
The animal x time interaction for differences in serum Cu concentration was significant (P <
.01). Differences in serum Cu concentration due to day of sampling of pigs were not significant.
As indicated earlier, at periodic intervals, blood samples were collected and hemoglobin levels and PCV determined. Initial hemoglobin levels and PCV were 11.6 g/lO0 mls and 34.3%, respectively, while Final hemoglobin and PCV were 11.3 g/100 mls and 34.6%. These values agree closely with those reported by Bunch e t al. (1965), Combs e t al. (1966) and Kline e t al.,
(1972). Since normal hemoglobin levels and PCV were observed throughout the duration of the study, it appears that frequent blood sampling p e r se (5 ml/pig/time interval) had no particular influence on the blood composition of the animals.
Buescher e t al. (1961) found no differences in plasma Cu concentration of barrows orally dosed with 64Cu labelled cupric carbonate, cupric oxide or cupric sulfate. Similarly, no significant differences in serum Cu concentra- tion were observed in the research reported
herein where Cu was fed in the inorganic or pre-chelated form or in the presence of EDTA in a 1:1 molar ratio with Cu. Thus, it appears that chelation has little influence on the uptake of Cu by swine at the level of Cu fed or by the chelating agent used in this study.
Although no significant treatment differ- ences in serum Cu concentration were observed, serum Cu concentrations were significantly (P < .05) affected by sampling time. As the animals began consuming the diet, they also began drinking water (water analyzed 1.3 mcg/ml Cu). As indicated earlier, the serum Cu concentration decreased rather consistently across treatments during the first 2.0 hr, peaked at 3.0 hr and plateaued near initial levels for the remaining experimental periOd (see figure 1 and 2). It appeared that upon consumption of the diet, either the serum Cu concentration dropped or the liquid phase of blood increased. Copper ions may be involved in some enzyme functions and are transported and secreted into the digestive tract or upon consumption of the feed and water, total blood volume increased. Sampling time is important, since different serum Cu concentrations were obtained de- pending upon when the samples were taken. The results may help explain why blood studies have not shown significant treatment differ- ences. The time of sampling following con- sumption of a diet will greatly influence serum Cu concentration. This factor will need to be accounted for when planning experiments involving blood sampling.
Literature Cited
Barber, R. S., R. Braude and K. G. Mitchell. 1955. Antibiotic and copper supplements for fattening pigs. Brit. J. Nutr. 9:378.
Braude, R. 1965. Copper as a growth stimulant in pigs (Cuprum pro pecunia). Symposium on copper's role in plant and animal life. Vienna, Austria. Buescher, R. G., S. A. Griffin and M. C. Bell. 1961.
Copper availability to swine from Cu 64 labelled inorganic compounds. J. Anim. Sci. 20:529. Bunch, R. J., J. T. McCall, V. C. Speer and V. W.
Hays. 1965. Copper supplementation for weaning pigs. J. Anim. Sci. 24:995.
Castell, A. G. and J. P. Bowland. 1968. Supplemental copper for swine: Growth, digestibility and carcass measurements. Can. J. Anim. Sci. 48:403.
Combs, G. E., C. B. Ammerman, R. L. Shirley and H. D. Wallace. 1966. Effect of source and level of dietary protein on pigs fed high-copper rations. J. Anim. Sci. 25:613.
Davis, P. N., L. C. Norris and F. H. Kratzer. 1962. Interference of soybean proteins with the utiliza- tion of trace minerals. J. Nutr. 77:217.
DeGoey, L. W., R. C. Wahlstrom and R. J. Emerick. 1971. Studies of high level copper supplementation to rations for growing swine. J. Anita. Sci. 33:52. Gipp, W. F., W. G. Pond, J. Tasker, D. Van Campen, L. Krook and W. J. Visek. 1973. Influence of dietary copper on weight gain, hematology and liver copper and iron storage of young pigs. J. Nutr. 103:713.
Hawbaker, J. A., V. C. Speer, V. W. Hays and D. V. Catron. 1961. Effect of copper sulfate and other chemotherapeutics in g~owing swine rations. J. Anim. Sci. 20:163.
Kline, R. D., V. W. Hays and G. L. Cromwell. 1971. Effect of copper, molybdenum and sulfate on performance, hematology and copper stores of pigs and lambs. J. Anita. Sci. 33:771.
Kline, R. D., V. W. Hays and G. L. Cromwell. 1972. Related effects of copper, zinc and iron on performance, hematology and copper stores of pigs and lambs. J. Anita. Sci. 34:393.
Merck Manual (1 l t h Ed.). 1966. The Merck Manual of Diagnosis and Therapy, Merck Division of Re- search.
N.R.C.-42 Committee on Swine Nutrition. 1970. Supplemental copper and vitamin E for G-F swine. J. Anita. Sci. 31:1025. (Abstr.).
Olson, A. D. and W. B. Hamlin. 1968. Serum copper and zinc by at omic absorption spectrophoto- metry. Atomic Absorption News Letter. Vol. 7 No. 4.
Perkin-Elmer. 1971. Analytical methods for atomic absorption spectrophotometry. Perkin-Elmer, Nor- walk, Conn.
Steele, R. G. D. and J. H. Torrie. 1960. Principles and Procedures of Statistics. McGraw-Hill Co., New York.
Wallace, H. D. 1967. High level copper in swine feeding. A review of research in the United States. International Copper Research Association, Inc., New York.
Zimmerman, D. R., B. Lantz, C. Naber, P. Koonsman and T. Stably. 1973. A venous cannulation technique for obtaining blood from unstressed swine. J. Anim. Sci. 37:334. (Abstr.).