6
thWorld Media Economics Conference
Centre d’études sur les médias and Journal of Media Economics
HEC Montréal, Montréal, Canada
May 12-15, 2004
Newspaper Circulation Size, Circulation Type,
and Marketing and Circulation Costs
Robert G. Picard, Jönköping University, Sweden
This paper explores relationships among newspaper circulation size, type, and marketing
and circulation costs. The paper uses data from a sample of newspapers to acquire
clearer evidence about the nature of the relationships. The results challenge assertions
about the relationships in a number of media texts that are based on anecdotal and
experiential evidence. The paper then provides improved models of the relationships for
use in teaching and improving professional understanding and practice.
Despite the growth of scholarship in media economics and management in the past two decades, much knowledge remains based on untested conventional wisdom or assertions based on anecdotal industry observations. Although research is increasingly focusing on a broader array of questions, many fundamental relationships and interactions remain unexplored.
Despite its significance to the economics of newspapers and to managerial decision-making, one area that has been relatively unexplored is the relationships between newspaper size, single copy sales, marketing costs, and distribution costs. As the size of newspapers increase— evidenced by higher circulation—expenses for acquiring, maintaining, and servicing customers obviously increase as well.
In the third century of the newspaper life cycle one might assume that the relationships between the factors are well established, but the literature provides little understanding and is primarily descriptive. Unanswered questions still remain about the proportionality of increases in expenses and economies of scale, the relationship of costs to single copy sales, and other relationships among circulation and costs.
Single copy sales represent sales of individual newspaper copies to individual buyers, typically from news racks, newsstands, or other retailers. The effects of single copies sales on newspapers are not clear from existing literature. Fink’s leading text on newspaper management asserts that “sales costs are lower in single -copy sales. Each home-delivery subscription is costly in promotion, sales commission and other expenses” (Fink, 1996: 253). Thorn’s volume on newspaper circulation, however, would lead readers to believe that single copy sales are costly, reporting that “wastage from unsold copies increases with each single copy outlet; larger newspapers simply have larger single copy operations. Circulation costs rise slowly with increased circulation” (Thorn, 1987: 110). Unsold copies account for significant production
waste, about 20 percent of total morning paper single copy production, approximately 18 percent for evening papers and nearly 15 percent for Sunday papers (International Newspaper Financial Executives, 1998).
Although marketing and promotion costs are relatively minor in newspapers and far lower than those for other media (Picard, 2002: 67), they typically represent between 1 to 3 percent of total costs (Picard & Brody, 1997: 49; International Newspaper Marketing Association, 2003). Beyond these assertions of the nature of marketing costs, little is known. Although newspaper marketing is covered in a number of textbooks and specialized books (e.g., Towles, 1984; Schultz, 1990), costs, budgets, and their relationships to newspaper size, single copy sales and overall circulation are not clarified. This may lead some to assume that costs for marketing remain relatively constant across circulation categories and that costs do not differ significantly depending upon the type of circulation (single copy or subscribed).
Distribution costs are a significant part of newspaper budgets and are affected by delivery distance and distribution density (Picard, 2002: 60-63). The physical nature of distribution makes costs higher for newspapers than non-physical media. As with other newspaper costs, distribution costs are affected by economies of scale. Litman (1988: 28-29) has shown that long-range average costs for distribution decline rapidly but that the economies of scale are not endless and costs begin rising at some point.
This paper examines issues of circulation size, type, and costs more closely to determine whether past observations and assumptions are borne out in practice and to establish the nature of the relationships among the factors.
Method
To explore the relationships among circula tion and cost factors, the author obtained data from 45 newspapers in 17 European countries. Data were obtained from members of the International Newspaper Marketing Association European Division. Forty-five newspaper executives provided data for their papers regarding circulation, percentage of single copy sales of total circulation, marketing costs as a percentage of total costs for the paper, and circulation/distribution costs as a percentage of total costs for the paper.
The data were combined and compared for descriptive purposes. A correlation analysis was also conducted and regression analysis was used to establish trends in the data.
Results
The circulation of the papers in the study ranged from 10,500 to 739,500 with a mean of 221,836 and a standard deviation of 188,067. The median paper had a circulation of 128,000. Full summary statistics are reported in Appendix I.
The percentage of total sales accounted for by single copy sales ranged from 0 to 100 percent, with a mean of 35.2 percent and a standard deviation of 36.9. Single copy sales in the median paper were 10 percent. Full summary statistics are reported in Appendix I.
Marketing costs as a percentage of total costs ranged from less than 1 percent to 20 percent with the average at 4.6 percent of total costs and a standard deviation of 4.1. The mean costs were 4 percent. Full summary statistics are reported in Appendix I.
Circulation/distribution costs averaged 16.4 percent of total costs, with a standard deviation of 13. The median cost for circulation/distribution was 16 percent of total costs [Full summary statistics are reported in Appendix I].
Table 1. Number of Newspaper Respondents by Circulation Size < 100,000 circulation 100,000-249,999 circulation 250,000 to 500,000 circulation >500,000 circulation 12 16 12 5 Correlations
A correlation analysis was conduct to determine the extent of relationship and type of relationship among the variables. The analysis creates a correlation matrix by which to analyze the existence, strength, and direction of relationships between two different factors. Correlation values can range between –1.0 and +1.0.
The Guilford five-step model was used to interpret the correlation coefficients: 1) <.20 = low correlation, almost non-existent dependence, 2) .20 to .40 = low correlation, certain, but weak dependence, 3) .40 to .70 = moderate correlation, significant dependence, 4) .70 to .90 = high correlation, evident dependence, 5) >.90 = very high correlation, very reliable dependence (Guilford, 1956).
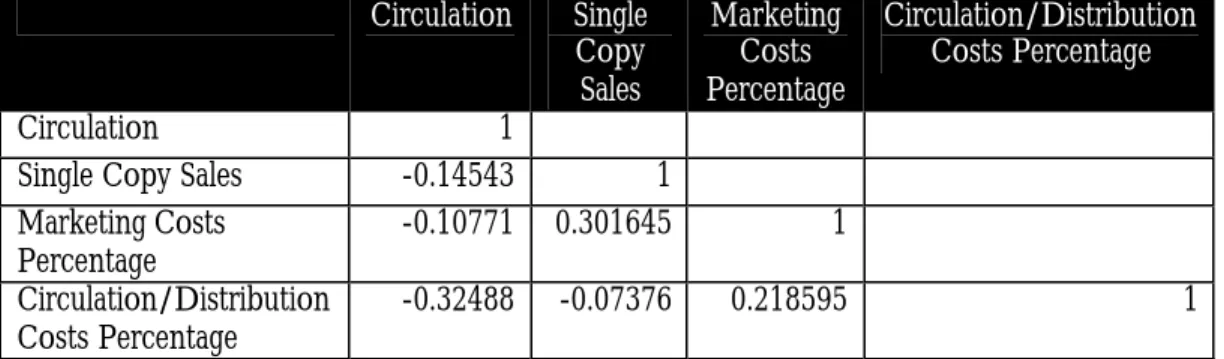
The results of the correlation of variables are shown in Table 2.
Table 2. Correlations between Circulation, Single Copy Sales, Marketing Costs and Distribution Costs Circulation Single Copy Sales Marketing Costs Percentage Circulation/Distribution Costs Percentage Circulation 1
Single Copy Sales -0.14543 1
Marketing Costs
Percentage -0.10771 0.301645 1
Circulation/Distribution
Costs Percentage -0.32488 -0.07376 0.218595 1
.
The analysis shows a negative relationship between circulation, single copy sales, marketing costs percentage and circulation/distribution costs percentage, indicating that as circulation size increases the newspapers rely less on single copy sales, and have lower marketing and circulation costs as a percentage of total costs. The strength of the relationship between circulation size and single copy s ales and marketing costs percentage are low (-.14543 and -.10771 respectively) and do not indicate dependence between the two variables. The relationship between circulation size and circulation/distribution costs is stronger and indicates a weak dependence between the two.
Single copy sales were positively related (.301645) with marketing costs percentage, indicating that both single copy costs and marketing costs rise. This relationship is certain but dependence between the two variables is weak.
Single copy sales were negatively related (-.07376) with circulation/distribution costs, indicating that as the percentage of single copy sales increases, costs go down. The strength of the result is low and does not indicate dependence between the two variables.
The percentage of money spent on marketing was positively related with distribution costs (.218595), indicating that marketing costs rose with circulation/distribution costs. This relationship is within the certain range, but there is weak dependence between the two variables.
The weaknesses found in the relationships and dependencies in the correlation analysis could result from the relationships between variables not being constant across circulation size, percentage of single copy sales, or marketing and distribution costs. It is recognized that cost structures differ based on circulation size, so to account for this regression analysis was applied to determine trends across size.
Regressions
Regression trends were made for the data using three types of regressions and trendlines: Linear (using the equation y = mx+b, where m is the slope and b is the intercept), logarithmic (using the equation y = c 1n x+b, where c and b are constants, and 1n is the natural logarithm function), and polynomial (using the equation y = b+c1x+c2x
2
+..., where b and c1, c2...are constants). The three
regression models for trends calculate least squares fits through the points.
The linear model seeks a single straight line explanation, assuming that a straight line is best for prediction. The logarithmic model uses logarithmic transformations to bring variances closer together by adjusting for statistical problems with the assumption of a constant rate of change. The logarithmic model is useful if the assumptions of homogeneity in variance, normality, and additivity used in linear regression are not met (Ferguson & Takane, 1989). The polynomial model seeks a curvilinear relationship recognizing that close relations between variables may not be shown by linear or logarithmic regression if increases in the x variables are not consistently accompanied by similar changes in the y variable (Mendenhall & Beaver, 1994).
All three regression trends were used because the correlations did not provide clear definitive evidence about the nature of the relationships between the variables.
First the importance of single copy sales in circulation was examined. All three regression trends for single copy sales percentage show a clear downward trend as circulation increases (Figure 1). The logarithmic and polynomial trends show a slight upward movement at the higher end of circulation size, indicating that the trend is not linear and that single copy sales rise and become slightly more important in larger papers, particularly past the 500,000 level.
Figure 1. Trends in Single Copy Sales Percentage across Circulation Size Error! Not a valid link.
The regression trends reveal only a slight decline in the marketing costs percentage of total costs across circulation size, although the decline is not large (Figure 2). The trend is evident in all three regression trends, which produce relatively the same results.
The regression trends reveal that distribution costs as a percentage of total costs decline across circulation size (Figure 3). The trend is evident in all three regression trends, but the logarithmic and polynomial regression trends indicate that the relationship is not linear.
Figure 2. Trends in Marketing Costs Percentage across Circulation Size Error! Not a valid link.
Figure 3. Trends in Circulation/Distribution Costs Percentage across Circulation Size Error! Not a valid link.
The regressions of marketing costs and single copy sales percentages reveal that marketing costs rise along with single copy sales (Figure 4). For reasons of statistical logic, only linear and polynomial regressions could be performed on the percentage data. Both reveal the upward trend, although the polynomial indicates that the relationship between marketing costs
and single copy sales is not linear but curvilinear. The trend shows that marketing costs rise until single copy sales reach about 70 to 80 percent of total circulation and then decline somewhat.
The regressions on circulation/distribution costs percentage of total costs and percentage of sin gle copy sales indicate a downward trend (Figure 5). In the linear trend it is only slightly downward, but the polynominal trend indicates that the relationship is curvilinear, rising slightly until between 20 and 30 percent, stabilizing between 30 and 50 percent, and then declining. A logarithmic trend could not be calculated because of the nature of the data.
Figure 4. Trends in Marketing Costs Percentage and Single Copy Sales Percentage Error! Not a valid link.
Figure 5. Trends in Circulation/Distribution Costs Percentage and Single Copy Sales Percentage
Error! Not a valid link.
Discussion
The different types of data analysis used in this study provided evidence that helps to clarify relationships among circulation size, single copy sales, and marketing and circulation/distribution costs.
This study showed that the amount of single copy sales vary widely among papers. The mean of 36.9 percent single copy sales is highly skewed upward, as the median 10 percent level indicates. Both the correlation analys is and regressions indicated that single copy sales decline as circulation increases. Both the correlations and regressions showed that marketing costs rise with single copy sales, but the regression analysis showed that the marketing costs rise somewhat with single copy sales before declining, creating a flattened curvilinear trend shaped like an upside-down U.
The research indicates that marketing costs have a mean of 4.6 percent of total costs of newspapers and a median of 4. Both the correlations and regressions indicate that marketing costs as a percentage of total costs decline slightly as circulation increases. As indicated in the single copy sales section, marketing costs were shown to rise with increased single copy sales. Marketing costs are also shown to rise as distribution costs rise.
Distribution costs are a significant part of newspaper expenses, accounting for a mean of 16.4 percent and median of 16 percent of total expenses. Both the correlation analysis and regression analysis revealed that distribution costs decline with single copy sales but rise slightly at the high end. As distribution costs rise, marketing costs also were shown to rise. The data show that distribution costs rise with single copy sales and then decline in a curvilinear trend with a downward turn at its higher end.
Relationship Models
Given the findings in this study, models of the relationships between newspaper circulation and costs factors can be drawn to illustrate their nature for teaching purposes and to develop understanding for professional practice.
The relationship between single copy sales and circulation is shown as a linear downward trend with single copy sales becoming less important as circulation size rises (Figure 6).
Figure 6. Model of the Relationship between Percentage of Single Copy Sales and Circulation Size
The relationship between marketing costs as a percentage of total costs and circulation size is slightly curvilinear, sloping downward but rising slightly with very high circulation (Figure 7), which tends to take place in markets with higher competition.
Figure 7. Model of the Relationship between Marketing Costs Percentage and Circulation Size
Error! Not a valid link.
Circulation/distribution costs are illustrated by a curvilinear relationship beginning with a significant downward slope but rising again at the high end of circulation (Figure 8).
Figure 8. Model of the Relationship between Circulation/Distribution Costs Percentage and Circulation Size
Error! Not a valid link.
The relationship between marketing costs as a percentage of total costs and single copy sales is illustrated by a curvilinear upward trend with a slight decline at the highest levels of single copy sales (Figure 9).
Figure 9. Model of the Relationship between Marketing Costs Percentage and Single Copy Sales
Error! Not a valid link.
The relationship between circulation/distribution costs as a percentage of total costs and single copy sales is illustrated as a curvilinear relationship with a slight rise until mid levels of single copy sales and then a significant decline as single copy sales reach the highest levels (Figure 10).
Figure 10. Model of the Relationship between Circulation/Distribution Costs Percentage and Single Copy Sales Percentage
Error! Not a valid link.
Conclusions
Comparing these results with explanations of costs in newspaper management books reveals difficulties in the existing knowledge base of newspaper expense relationships.
This study has shown that single copy sales decline as circulation increases and that they increase marketing costs until about 75% of circulation is reached through single copy sales. This latter finding contracts Fink’s assertion (1996: 253) that sales costs are lower for single copy circulation and supports Thorn’s view (1987: 110) that single copy sales are costly.
The findings show that marketing costs as a percentage of total costs decline slightly as circulation increases. This contradicts Thorn’s view (1987: 10) that circulation costs rise with increased circulation. Although Thorn’s view may be true in monetary terms, it is not supported when costs are viewed as a percentage of total costs. The finding that marketing costs were about 4 percent of total costs is slightly higher than those reported by Picard & Brody (1997: 49) for U.S. papers, but that may be due to differences between European and U.S. papers’ cost structures, in differences in market structure and competition differences across the Atlantic, or a
result of increased expenditures for newspaper marketing in the increasingly competitive markets for attention and advertising.
The findings reveal that distribution costs are a significant portion of total costs and that they decline with single copy sales but ultimately begin rising as the percentage of single copy sales reaches high levels. Similarly, marketing costs fall as circulation increases but begin risin g slightly at the high end of circulation. These findings support Litman’s assertion (1988: 28-29) that economies of scale exist but are not endless.
The results of this study provide a better understanding of the relationship among newspaper circulation size, circulation type, and marketing and circulation/distribution costs. The data provided the basis for models grounded in empirical rather than anecdotal evidence, and also revealed errors in existing understanding of the relationships.
APPENDIX 1: SUMMARY STATISTICS Circulation Mean 221836.1 Standard Error 28035.35 Median 128000 Mode 120000 Standard Deviation 188066.9 Sample Variance 35369145026 Kurtosis 1.50848 Skewness 1.420795 Range 739500 Minimum 10500 Maximum 750000 Sum 9982625 Count 45
Single Copy Sales Percentage
Mean 35.17778 Standard Error 5.503102 Median 10 Mode 0 Standard Deviation 36.91593 Sample Variance 1362.786 Kurtosis -1.31804 Skewness 0.612872 Range 100 Minimum 0 Maximum 100 Sum 1583 Count 45
Marketing Costs Percentage
Mean 4.555556 Standard Error 0.612624 Median 4 Mode 0 Standard Deviation 4.109609 Sample Variance 16.88889 Kurtosis 4.116714 Skewness 1.641703 Range 20 Minimum 0 Maximum 20 Sum 205 Count 45 Circulation/Distribution Costs Percentage Mean 16.44444 Standard Error 1.93807 Median 16 Mode 0 Standard Deviation 13.00097 Sample Variance 169.0253 Kurtosis 0.818742 Skewness 0.799676 Range 53 Minimum 0 Maximum 53 Sum 740 Count 45
References
Ferguson, G. A., and Takane, Y. (1989). Statistical analysis in psychology and education, 6th ed. New York: McGraw-Hill.
Fink, Conrad C. (1996). Strategic newspaper management. Boston: Allyn and Bacon.
Guilford, J. P. (1956). Fundamental statistics in psychology and education. New York: McGraw-Hill.
International Newspaper Financial Executives (1998). “Business Barometer: Single Copy Waste,” INFE Newsletter 9(9):1.
International Newspaper Marketing Association (2003). Benchmark Survey of Marketing and Sales Expenditures. Dallas: International Newspaper Marketing Association.
Litman, Barry (1988). “Macroeconomic foundations” in Robert G. Picard, James P. Winter, Maxwell McCombs, and Stephen Lacy (eds.), Press concentration and monopoly: New perspectives on newspaper ownership and operation. Norwood, NJ: Ablex.
Mendenhall, W., and Beaver, R.J. (1994). Introduction to probability and statistics, 9th ed. Belmont, Calif.: Duxbury Press (Wadsworth).
Picard, Robert G. (1998). "A note on the relationships between circulation size and newspaper advertising rates," Journal of Media Economics, 11(2):47-55 .
Picard, Robert G. (2002). The economics and financing of media companies. New York: Fordham University Press.
Picard, Robert G. and Jeffrey H. Brody (1997). The newspaper publishing industry. Boston: Allyn and Bacon.
Schultz, Don E. (1990). Strategic newspaper marketing. Reston, Va.: The International Newspaper Marketing Association.
Thorn, William J. with Mary Pat Pfeil (1987). Newspaper circulation: Marketing the News. New York: Longman.
Towles, Donald B. (ed). (1984). Promoting the total newspaper: A newspaper promotion handbook. Reston, Va.: International Newspaper Promotion Association.