Analysis of Low Cost Residential Housing Development for the
Urban Poor: A Case Study of Kibera and Mathare Slums in
Nairobi
Amos s. Mwangangi (Corresponding Author)
Production Manager, EPS Factory, National Housing Corporation, Email: [email protected]
Christine N. Simiyu (PhD)
Senior Lecturer, School of Business and Public Management, KCA University P.o Box 56808-00200, Nairobi, Kenya.
Email: [email protected]
Abstract
Developing trend of urbanization due to industrialization worldwide caused overwhelming strain to housing the urban extreme-poor people. Affordability posed the main housing challenge in Kenya. This precipitated into the proliferation of slums in all urban areas and was most severe in Nairobi where the appalling slum settlements were densely populated. The research was focused on highlighting the unattended group of urban dwellers, the urban poor, who required decent, adequate and affordable housing and related services within their means. The study directed questionnaires to collect data for analysis. Descriptive statistics and factor analysis were used to analyze the data. The study established that slum residents were overcrowded in tiny rooms within filthy neighborhoods devoid of basic social amenities. The study findings suggest that many residents had monthly household income of approximately 10,000 Kenya Shillings(KSH) and could only rent houses within KSH1,000 and hence could not afford to live in decent neighborhoods. The study noted that the interventions by the government to address the housing situation were insignificant and much more effort was required to improve the living condition of slums in the wake of the fast growing urban population and widespread of urban poverty by provision and facilitation of basic services and decent low cost housing units.
Keywords: Decent Housing, Urban Poor, Factor Analysis.
1.0 Introduction
The world’s population living in cities has been on an upward trend since industrial revolution in 1900s. In 1900, 14% of the world’s population lived in cities, 1950; 30%, 1980; 39% and in 2004; 48% (UN, 2004). In 2008, half of the world population lived in urban areas and will rise to over 60% by 2030 (UN report, 2008). According to the population reference bureau in USA, it is expected that 70% of the world population will be urban by 2050 and that most urban growth will occur in less developed countries (Obure, 2013). This situation has given rise to immense challenges on residential housing, particularly to the urban poor.
According to UN- HABITAT (2008), Africa is urbanizing rapidly with 38.7% of its population living in cities in 2007 and is now at 50%. By the year 2030, more Africans, about 1 billion people will be living in cities than in the rural areas. East African region is the least urbanized in Africa with North Africa, South Africa and West Africa recording much higher urban populations. This swift in urban growth stretches the demand for urban residential housing, urban services and urban livelihoods.
By the year 2030, more than 60% of Kenyans will be living in cities and towns. In Kenya, the estimated current residential urban housing needs are over 150,000 units per year. It is estimated that the current production of new residential housing in Kenyan urban areas is approximately 30,000 units annually, which is only 20% of the demand, leaving a huge shortfall (Ministry of housing, 2004; Kenya Vision 2030, 2007 and UN habitat, 2013). This situation has given rise to mushrooming of informal settlements, construction of unauthorized extensions in existing residential estates and overcrowding (UN-Habitat, 2003). In Kenyan urban settlements, 59 % of households live in one roomed dwelling units (World Bank, 2006).
UN-Habitat launched in 2008, the Participatory Slum Upgrading Programme (PSUP) to improve the living conditions in towns and cities and positively contribute to 7th Millennium Development Goal, Target 11. The 7th Millennium Development Goal aims to achieve environmental sustainability with target 11 geared to achieve a significant improvement in the lives of at least 100 million slum dwellers worldwide and deter formation of new slums by the year 2020 (United Nations Millennium Development Goals, 2000). Currently, there are 38 countries (including Kenya) and 63 cities across Africa, Caribbean and Pacific states (ACP) participating in the programme (UN-HABITAT, 2012). In Kenya, the target translates to improving the livelihoods of at least 1.6 million households living in slums by the year 2020 which would be accomplished at a cost of about $ 11 billion or Ksh. 935 billion (Ministry of housing, 2006).
The UN-HABITAT and the World Bank cannot entirely solve the problem of slums, but simply helps to fix the problems posed by current slums. Today, there are more than one billion slum dwellers in the world and the number is expected to rise to two billion by the year 2030. In the developing world, one out of every three people living in cities lives in a slum (Cities alliance, 2012 and World Bank, 2011).
Slums commonly provide low cost housing to low income people owing to the low quality of houses and the lack of basic services; clean water, sanitation, access roads, electricity and social amenities. They are highly exposed to the risk of eviction and demolition. 92 percent of slum dwellers in Kenya are rent-paying tenants. The average monthly rent in Nairobi slums is about Ksh. 790 (which is equivalent to USD 9 at the current exchange rate), against an average monthly income of Ksh. 2,776 (which is equivalent to USD 37) (World Bank, 2006). The residents of Kenyan slums pay 10 times more for water than residents of wealthy neighborhoods connected to the metered municipal water system and in times of scarcity, it is 30 to 40 times more (Neuwirth, 2005). There is only 1 toilet for every 500 people in the slums of Nairobi and people have to use the ‘wrap and throw’ method of getting rid of their faeces (New internationalist, 2006).
Over 50% of urban dwellers in Kenya live in informal settlements that lack adequate shelter (World Bank, 2008). Most of the public housing estates are dilapidated and equally compare to slums. Housing prices are excessively high and unaffordable for the growing urban population and therefore many are forced to live in overcrowded and unsafe informal settlements, without access to drinking water, sanitation and other basic services and amenities (World Bank, 2006). The biggest slums in Kenya are in Nairobi and include, in a descending order: Kibera, Mathare valley, Mukuru Kwa Njenga, Korogocho, Sinai, and Majengo (UN habitat, 2009).
2.0 Problem statement
Kimani (2013) found that the annual demand for urban residential housing currently at 150,000 units against a meager supply of 30,000 units leaves a huge deficit and investment space for real estate developers as supply continues to lag the population growth. In 2012, the then Housing Minister, said that a survey carried by the ministry the same year revealed doubling of the national demand for housing and a high growth of informal settlements due to shortage of decent and affordable homes.
Huchzermeyer (2008) finds that within Nairobi’s low income housing market, public housing stock plays no regulating role because entitlement to units is through inheritance of occupational rights and political patronage. As a consequence, units are rented far below the market rates to middle class households. Due to lack of access to land and public housing, the poor have no option but to resort to informal housing market. The dynamics of this market indicate and increase the power imbalances between slum dwellers on one hand and landlords and public officials on the other. Public officials have a strong incentive to reward their followers by illegally allocating land in an area designated for upgrading. For example, in Kiambiu slum, which in 1994 was authorized to be upgraded, public officials illegally sold the land to developers to such an extent that upgrading became impossible (COHRE, 2006).
The Kenyan Government and donors do not recognize the political nature of slum upgrading and the imbalances based on income inequality. This is suggested by the design of low income housing to middle class standards as evident in KENSUP Kibera - Soweto pilot project (Huchzermeyer, 2008). Procedures for proper allocation of land are by-passed to benefit a small group of individuals at the expense of the public. The distorted allocation of land has translated into about 60% of Nairobi’s population currently living in informal settlements but occupying only about 5% of the residential area (Transparency International, 2003).
Government and donor efforts have failed to target the poor of the poorest. Residential house upgrading in slums and public housing and site and service schemes have failed largely because they did not involve the residents in planning, design and implementation and have mainly depended on experts whose priorities are different from those of the poor residents, hence the units end up being too expensive for the poor residents to afford (Njathi, 2011).
Owing to the growth of overcrowded and degenerated urban residences, there has been deliberate effort by the Government and the private sector to improve the living conditions of the urban poor by providing better houses. This has been achieved through upgrading and site and service schemes. These measures have led to development of decent houses for the middle income which are not affordable to the urban poor. This situation forced the urban poor to encroach on other open fields to create even severe illegal settlements. This research sought to examine ways and means of improving access to decent low cost housing for the urban poor.
3.0 Objectives
The general objective of this research was to establish the housing needs of the urban poor in a bid to find a sustainable solution to provision of decent low cost housing for the extremely poor urban dwellers.
3. 1 Specific objectives
(i) To identify the availability of low cost residential housing to the urban poor
(ii) To determine the affordability of decent low cost residential housing to the urban poor
(iii)To establish the effectiveness of the government’s low cost housing schemes in improving access to decent, low cost housing for the urban poor.
4.0 Methodology 4.1 Research design
Descriptive research design was used in this study to describe the prevailing residential housing situation in poor urban settlements. This was achieved through survey and observations. Data was obtained through the use of a structured questionnaire distributed randomly among respondents in Kibera and Mathare slums to collect primary data. Case study of Kibera and Mathare 4A slum upgrading pilot programmes was done to obtain information on whether the residents in the upgraded houses were genuine extremely poor people.
Simple random sampling was used in the selection of respondents. This ensured that any member of the population had an equal chance of inclusion in the sample. Secondary data was obtained from informational documents from the Ministry of housing, UN-Habitat and other sources which enabled the study to be adequately addressed. The study gathered information about housing the urban poor by visiting low income housing schemes such as the government housing schemes for the low income households at Kibera and Mathare 4A. The researcher therefore interviewed slum residents in Kibera and Mathare slums.
4.2 Target population
The target population for this research was the urban poor people living in Kibera and Mathare slums. These were over 1 million residents; over 600,000 people in Kibera and over 400,000 people in Mathare slums (UN habitat, 2013).
4.3 Sampling and sampling procedure
Kibera and Mathare slums are home to over 1 million residents (UN habitat, 2013). This population size of 1 million residents was sampled randomly to a sample size of 120 respondents, based on published tables that guide in determining sample sizes as defined by Israel (2009) which requires that for a population of over 1 million, the sample size should be at least 100 respondents. 60 respondents were selected in Kibera and 60 respondents in Mathare so as to give equal attention to the housing situation in both slums to enable fair inference to be drawn on the housing situation in poor urban residences.
Respondents were picked by simple random sampling by moving through the entire slum and randomly picking a house in an evenly dispersed manner to ensure that the general housing situation in the whole slum is captured.
4.4 Data collection methods
Primary data was collected through a survey by the use of the following research instruments: 4.4.1 Questionnaire
Open and close ended questions were prepared in order to capture effectively the relevant information from poor urban residents concerning housing. The questionnaire was tested through a pilot study to reveal the weaknesses for correction. Then the questionnaire was self administered during the survey in Kibera and Mathare slums to cater for illiterate and busy cases and also to save on time that would have been lost in coming back for the questionnaire and also reduced the chances of non response. A total of 120 respondents were interviewed. 4.4.2 Observation
Visits were made by the researcher to Kibera and Mathare 4A slum upgrading pilot programmes. Other low cost residential houses and construction sites were identified in the course of the research and were visited, including Mukuru Kwa Njenga slums in Nairobi South B estate and the National Housing Corporation rentals along Karanja road in Kibera. Kibera and Mathare valley slums were visited to collect data on the reality of urban poor residences.
4.5 Data collection procedure
The respondents in Kibera and Mathare slums were selected through simple random sampling of the population where 120 households were picked. Information was obtained from the respondents with the guidance of a self administered questionnaire.
4.6 Data analysis
The data collected was analyzed using Statistical Package for Social Sciences (SPSS) software. Descriptive analysis was performed by use of percentage response to all the 43 variables. Econometric analysis was by use of factor analysis to determine key factors that would unlock hindrance to low cost residential housing, cross tabulation and correlations to describe the housing situation quantitatively. Both the descriptive and econometric analyses were used to analyze availability, affordability and the impact of the government’s intervention in provision of affordable housing. Tables and charts were used in data presentation.
5.0 Results
5.1 General information
5.1.1 Response rate
Questionnaires were presented to 120 respondents for data collection by self administration. However, only 100 questionnaires were successfully completed, and 20 questionnaires did not gather substantial data due to unwillingness of the respondents, hence response rate of 83.33% was recorded.
5.1.2 Validity of the findings
Validity is the degree to which the test is truly measuring what was intended. Using principal component analysis (PCA), Kaiser-Meyer-Olkin measure (KMO) was undertaken to ascertain the sampling adequacy. Field (2009) recommends KMO values greater than 0.5 as acceptable. For these data, the value was 0.532 as shown in Table 1, which demonstrates confidence that factor analysis is appropriate for these data. The results in Table 1 showed p=0.000 which is highly significant. These results imply that the variables in the study are valid for factor analysis.
Reliability of a research means the extent to which the test can yield the same results if repeated. 41 variables, which eliminated the rental ownership variable and the availability of social housing schemes variable which were outliers in the analysis, were considered for Principal Component Analysis (PCA) by Varimax with Kaiser Normalization method to give the rotated component matrix. Negative factors and those below 0.05 were ignored to remain with 24 variables, which were considered for reliability test to give the results presented in Table 2. The results from the reliability test gave Cronbach’s Alpha of 0.502, which is an acceptable value for a research instrument, according to Field (2009) and Joanes (1998).
5.2 Descriptive analysis
5.2.1 Demographics analysis
From Table 3, the results from the study suggest that, most of the respondents were married women (71%) aged between 46 to 60 years (68%) who live with their spouses and young children. Majority of the men, being the breadwinners of the families, were out in search of money to fend for their families and in most instances would not be found in the house for interview. In most of the households, 76%, there was at least one employed person, mainly the men, while 24% of the households reported to have no one in employment in the household and depended on uncertain casual works that they could find.
Concerning education levels, the study found that majority of the respondents had primary education and either fully or partially completed secondary education and had taken additional artisan course. 5% of the respondents reported to have no formal education. These results suggest relatively low education levels among the slum dwellers and hence lower access to employment opportunities. Indeed, most slum residents were noted to be engaged in low income informal jobs with 97% reported to have monthly household income of between 10,000 to 30,000 Kenya shilling (KSH), and were therefore only able to afford monthly rental housing of about KSH. 1,000. In addition, the results from the study showed that majority of low income earners lived in single roomed houses which were mostly shared by at least 4 persons (adults and children). Noteworthy, in most households, the house was inhabited by husband and wife with their children. Others were shared by close friends and relatives to cushion financial uncertainties. These findings imply that the rising urban population is constantly threatened by the scarcity of employment opportunities coupled with low wages, which leads to many people living in overcrowded tiny rooms in slums.
5.2.2 Housing situation in slums
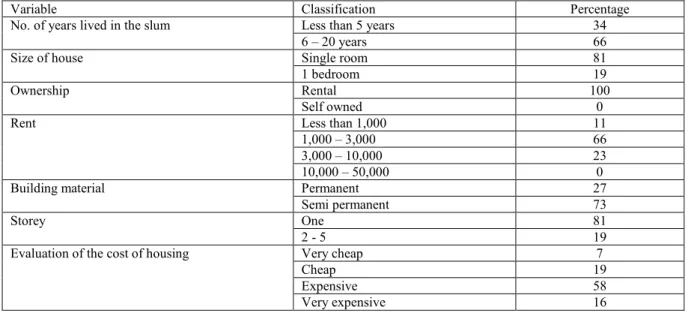
Table 4 shows that, from the study, all respondents were rental tenants with 81% reported to be living in single rooms. This scenario is mainly attributed to low income levels as shown by demographics in section 5.2.1 above. The houses are made of mud and iron sheets (83%), which are cheap semi permanent materials, with 81% of the houses noted to have only ground floor. However, new developments have new structures having upper floors created with timber and iron sheets. The houses in the slums were considered to be expensive by residents because of the poor state of the houses. However, majority of the respondents (66%) reported to have resided in the slums for 6 to 20 years and had acclimatized to the slum environment. These findings imply that there is affordability problem in housing the low income urban residents which concentrates them to deplorable living conditions in informal settlements.
5.2.3 Availability of decent housing in slums
From Table 5, the results show that slums like Kibera and Mathare lack basic services like sanitation, water, electricity, feeder road network and houses are haphazardly crowded on the ground floor without full utilization of high-rise space. Sanitation in poor urban settlements was observed to be a serious concern with 95% of houses without toilets and residents have no choice but to pay for toilet services in toilets operated remote to the houses at a cost of 5 to 10 KSH per visit. This necessitates many residents to resort to crude methods of human waste and household refuse disposal like disposing into drainage channels, discharging human excreta indiscriminately
along walk paths and railway lines and ‘wrap and throw’ in which case human excreta is disposed in polythene bags and thrown under the cover of darkness to land in other peoples’ premises. Sewer from the households was haphazardly directed to waste drainage channels (41%) and also to council sewer lines (35%). Majority of the slum residents (86%) reported that the city council was poor in service delivery.
It was noted that majority of the slum households are connected with electric power supply (63%), mainly illegally tapped from the Kenya power lines with only few legal connections. Majority of the respondents (56%) pay monthly household power bills of less than 500 KSH. The population without power in the slums is significantly high at 37% and under such circumstances, paraffin lamps are used to light the rooms.
It was observed that majority of slum residents have water supply in the vicinity, with 81% of the population reported to have access to water supply points outside the plot where they can buy the water in 20 litre containers each at 5 KSH. However, it was observed that most of these water points are illegally tapped water from the council water supply lines, where 28% reported that the water they use is illegally connected. Water was a major problem to most residents because the supply is intermittent and water vendors exploit the residents by supplying water from uncertain sources at exorbitant rates. Most of the streets in the slums are very narrow muddy paths overcrowded with people, and vehicles cannot access the interior households. The layout of the houses is haphazard hence leaving slums without clear street networks.
Due to overcrowding, security was a major concern whereby 70% of the slum residents reported security, sanitation, water and rent as the key problems. It was observed that insecurity was amplified by the high population density, lack of clear streets and the poor state of the building hence some of the slum areas were hideouts for criminal elements because access by government agents to those places would be difficult. Another cause of insecurity was cited to be unemployment, where able bodied persons would idle about without meaningful economic engagements. These results corroborates with the findings of Sana (2012) who reported that social problems such as drug trafficking and abuse (in Mathare’s Nigeria village where cocaine, heroin and hashish are traded), prostitution, robbery and murder thrive in Nairobi slums.
Due to the problems in the slums, 75% of the slum residents preferred that their houses be demolished for upgrading because the majority considered the situation in the slums as most unfavorable. They preferred that better houses be constructed of permanent materials which would rent for less than KSH 10,000 and sell for less than 1 million KSHfor 2 – 3 bedrooms. The frequency analysis indicated that there is scarcity of houses in the slums. The demand was very high for the cheaper houses in the slums regardless of the lack of basic services. The respondents reported that they needed a house that has two to three bedrooms but which they could not afford given the low income as shown in Figure 2.
Due to the high demand for affordable housing, upper floors on the mud and iron sheet houses were becoming popular, with ground floors being renovated to accommodate upper floors. These findings imply that, in the slums, there is lack of housing and infrastructural development which should be the cornerstone of projected economic growth as Nairobi continues to grow as a key business and financial hub in the region, which corroborates with the findings of Obure, (2013).
The research identified that open spaces were constantly encroached by squatters as they built temporary structures and create unplanned neighborhoods. The existing slums were observed to be steadily expanding and new slums still coming up as the need for housing intensified. This erodes the beauty of the scenery of residential estates as unplanned iron sheets and mud residential structures without basic services fill open spaces.
5.2.4 Affordability of decent housing in slums
From Table 6, the results showed that rent was among the top most severe problems in the slums as a result of low income levels as was discussed in demographics section, 5.2.1 above. The houses affordable in the slums are the mud and iron sheets shanties which respondents referred to as most unfavorable (60%). These findings imply that, in the slums, there were an ever-rising number of urban poor households seeking low-cost housing within their means. Lack of basic physical infrastructure; sanitation, water, power and transport coupled with congestion created indecent livelihood. This state of affairs invokes many poor people to seek cheaper settlements with better services hence encouraging the growth of slums. Greater participation by corporate bodies in corporate social responsibilities, with good measure of the impact of their participation, would go a long way in alleviating the social needs of slum residents as was observed by Peterson (2013) and Areba (2013). 5.2.5 Government intervention
The study revealed that there were few government owned social housing schemes for slum upgrading programme, in the slums of Kibera and Mathare, which were designed to improve the welfare of the slum residents but ended up being inhabited by the middle class who could afford the price to rent or buy. From Table 7, the results from the study suggest that, 93% of the slum residents strongly believed that the government is not doing enough to improve the welfare of the slums and the majority (76%), expected the government to facilitate provision of low cost housing for the poor. 90% of the respondents reported that they expect the government to play an active role in the provision of decent low cost housing, considering that it controls the laws and resources.
These findings imply that, social housing is almost nonexistent in Kenyan housing markets and the few units done under such schemes have exorbitant prices which are above the reach of the largest fraction of the population, which corroborates with the findings of Kihoro (2013).
6.0 Econometric analysis
The descriptive findings suggest that; due to lower income levels, the urban poor live in unfavorable conditions and there is little government intervention to provision of decent housing for the urban poor. However, these findings do not control for other factors that influence the analysis, hence the need for econometric analysis.
6.1 Availability analysis
Table 8 shows the results of the Varimax with Kaiser Normalization rotation and the factor loadings for each variable, which rated the 12 variables related to availability. The factors with low ratings were ignored. The factors to be considered are those that rate above 0.5 because they denote that the variable loaded strongly (Field, 2009). The factor loadings were interpreted as follows:
Component 1 is explained strongly by two factors: Electricity connectivity with factor loading of 0.828 and access road with factor loading of 0.818. These were identified as the factor defining public services. Component 1 is closely linked to components 3, 4 and 5 which denote the provision of services. This implied that availability of decent affordable housing is closely linked to provision of sanitation, electricity, water, and road network which are the basic services that should be availed in every residential area.
Component 2 is explained strongly by two factors: Size of house with factor loading of 0.842 and availability of social housing schemes with factor loading of 0.583. Component 5 also partly denotes the need to upgrade slum houses to improve their decency and increase the number of units by construction of high-rise blocks. These were identified as the factor defining the government’s facilitation and supply of housing stock. The results showed that availability of housing stock in slums is dependent on provision of services and the government’s effort in provision of public housing. Table 9 shows that the houses in slums are overcrowded with more than three persons sharing a single room. Only 14% of respondents reported to occupy a room alone or with one more person. This showed 86% of housing inadequacy, where a room shared by three or more persons is referred to as inadequacy (UN-Habitat, 2003).
6.2 Affordability Analysis
Table 10 gave the results of the Varimax with Kaiser Normalization rotation and the factor loadings for each variable, which rated the 6 variables most closely related to affordability. Component 1 is explained strongly by two factors: Rent with factor loading of 0.799 and the housing situation with factor loading of 0.593. These were identified as the factor defining the cost of housing. This implied that the rent charged is directly proportional to the quality of housing. Component 2 defines the household income. The results suggest that the household income clearly defines the quality of housing affordable.
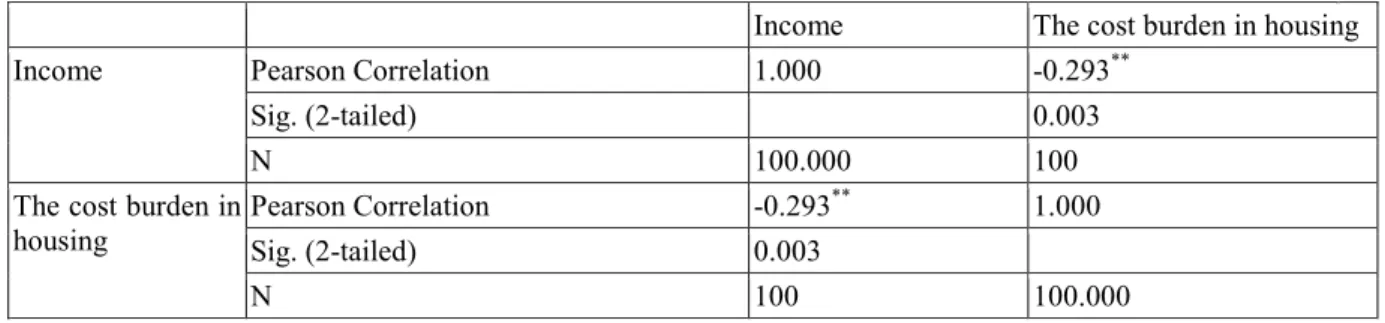
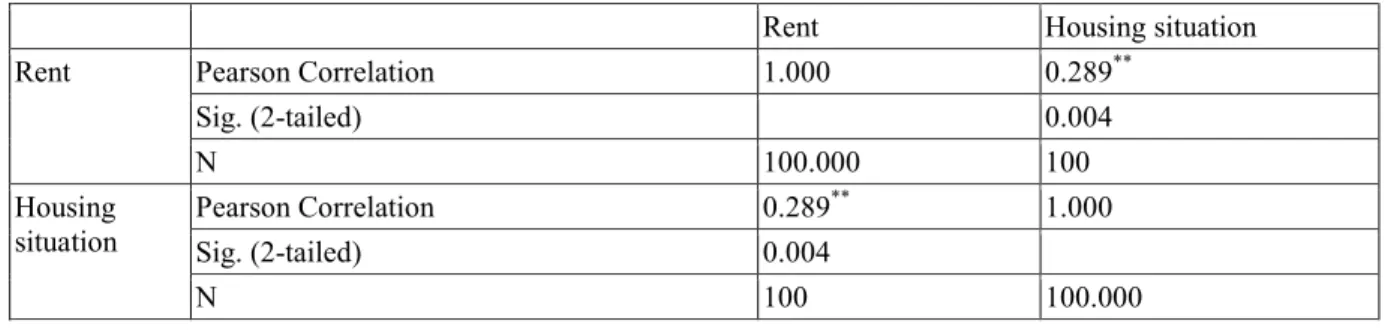
Table 11 shows that there is correlation between the level of income and the cost burden of housing in that people with very low incomes reported that, rent in the slums was very expensive and those with modest incomes reported that rent was cheap, hence the negative value of Pearson’s correlation coefficient. These findings imply that there is greater housing cost burden to the lowest income earners as compared to modest earners. In Table 12 there is a positive correlation between the rent paid and the housing situation such that higher rents were charged for better neighborhoods. The results imply that the residential houses in the slums had different rental rates depending on the proximity to services.
Table 13 shows that majority of the slum residents have a monthly household income of about KSH 10,000 and live in rental houses charged KSH1,000 to 3,000. The general trend showed that lower income households sought lower rate rentals which offered cheaper services. Those respondents with household income below KSH 10,000 had the largest numbers in rental houses charged below KSH 1,000. Persons in higher income brackets declined residence in slums with only 3% of the respondents being in KSH 31,000 to 50,000 household income bracket. The general trend showed that most respondents were paying 10% of their household income to rent.
The study identified that affordability is the main determinant of the quality of housing in urban areas and that the poor in the lowest income brackets were exposed by lack of economic empowerment to indecent housing. These findings imply that the cost of constructing decent and affordable houses remains exorbitant due to inaccessibility and high cost of construction finance and building materials as the demand for housing units outstrips the supply. Therefore, developers have been concentrating on the high and medium end market where returns are high at the expense of the low end market, which makes it difficult to build houses that could be afforded by the poor slum residents. These findings corroborate with observations made by Kihoro (2013).
6.3 Government Intervention Analysis
From Table 14, results of cross tabulation in percentage of how the government should facilitate low cost housing and the effectiveness of the government in addressing housing in slums show that what the respondents needed most was low cost houses. Majority of the respondents, 74%, strongly agreed on a 4 point Likert scale
that though the government had the capacity, owing to its control over resources and laws, it was not doing enough to improve housing in slums. Other residents cited infrastructure and low priced loans and grants as what they expected the government to do to improve residence in slums in which they strongly agreed on a 4 point likert scale that the government was not doing enough to facilitate such funds. This implied that the efforts done by the government to improve housing in slums were not effective in alleviating the housing needs of the urban poor.
7.0 Conclusion and Recommendations
The general objective of this study was to establish the housing needs of the urban poor which would guide in finding a sustainable solution to provision of decent low cost housing for the extremely poor urban dwellers. The specific objectives were: i) To identify the level of availability of low cost residential housing to the urban poor, ii) To determine the affordability of decent low cost residential housing to the urban poor, iii) To establish the effectiveness of the government’s low cost housing schemes to improve access to decent low cost housing for the urban poor. The research adopted descriptive design. A survey was carried out in which 120 respondents were interviewed by use of 120 questionnaires in which case, 100 self administered questionnaires were successfully filled by the researcher, hence response rate of 83.33%. Descriptive statistics in frequency tables, cross tabulations, correlations and factor analysis were used to analyze the quantitative data.
The study established that there is shortage of sufficient numbers of affordable housing units to accommodate people in urban areas as the urban population continues to grow. The study observed that slum houses required more floors upstairs and in some blocks, there were upstairs extensions done with semi-permanent materials in order to accommodate the fast rising populations within the limited space. Alaghbari (2011) observed that low income groups in slums can be housed through mass production of high-rise blocks to be able to accommodate several units on a small plinth area as residential space diminishes. There is inadequate provision of basic public services like sanitation, security, access roads, electricity and water. Barra (2005) observed that there is always political ignorance in provision of services to slums and noted that the solution to alleviate problems of slum life was in governments playing a leading role in the provision of water, sanitation, electricity, feeder roads and other amenities. Transport and housing were observed to be the key factors that contribute to proliferation of slums close to the city commercial and industrial centres where economic opportunities could easily be found. Decent housing in close proximity to the city commercial and industrial centres is normally very expensive as a result of the high demand. Far away from this proximity implies high transport costs and detachment from economic opportunities. The study also noted that, in residences where services were provided, the demand for housing was very high and this would attract developers to build decent houses which Njathi (2011) observed to be too expensive for the poor residents to afford.
There was need for decent houses at low cost, affordable to persons with low household incomes of about KSH 10,000. Household income and rent were the key factors in affordability. As was observed by World Bank (2006), slums provided low cost housing to low income people owing to the low quality houses and lack of services. Decent houses in the slum areas were not affordable by the poor because the rents were high. This research observed that, slum residents were only able to pay about 1,000 shillings for rent every month. The results coincided with the findings from World Bank (2006).
The study found that it was necessary for the government to manage and control the cost of living for its citizens and play a leading role in the provision of services and affordable housing, in which case 90% of the respondents expressed expectation from the government to facilitate the provision of low cost housing. UN-Habitat (2003) reported that, to face the challenges posed by slums, the government’s urban development policies have to be vigorous in addressing the livelihoods of slum dwellers and urban poverty in general. The study found that, government low cost schemes under the emblem of slum upgrading were insignificant and did not capture the needs of the poor. The study identified that, it was necessary for the government to facilitate provision of decent and affordable housing to low income earners as envisaged in Kenya vision 2030 (2007).
7.1 Conclusion
The study showed that, slums in Nairobi are mainly inhabited by low income people and are mainly characterized by the lack of public services. They often include electricity, water supply network, waste water management, environmental protection, law enforcement, public housing, health care, social security, telecommunication, road networks, education, fire service and many others. According to the constitution of Kenya (2010) and the Architectural Association of Kenya (2012), housing is enforced in chapter 4 which defines the bill of rights and in particular sections 42 and 43. Chapter 4, section 43 (b) states that every person has the right to accessible and adequate housing, and to reasonable standards of sanitation. It is also enacted by the social pillar of vision 2030 which focuses on a just and cohesive society enjoying equitable social development in a clean and secure environment.
Housing is a fundamental human right. Housing the urban poor living in slums is highly regarded in the millennium development goals, goal number 7 Target 11 which aims to achieve environmental sustainability
with achievement of significant improvement in the lives of slum dwellers by the year 2020. The Kenya’s 2030 vision for housing and urbanization is an adequately and decently housed nation in a sustainable all inclusive environment. The most immediate goal is to increase the annual production of housing from the current 35,000 units annually to over 200,000 units which requires better development of and access to affordable and adequate housing, enhanced access to adequate financing for developers and buyers and policy reforms that would unlock the potential of the housing sector. The government is expected to play an active role in the provision of decent low cost housing because it controls the resources required to supply housing, mainly the land and finances.
7.2 Recommendations
The study recommends that;
i) Stakeholders in the housing industry need to embrace technologies that would be able to deliver volumes of affordable housing units within the shortest time possible. The usage of cheaper novel technologies in the delivery of houses could also make the cost of housing within the reach of the poor.
ii) Provision of services; water, electricity, security, road networks, sanitation and others should be given priority in urban planning and the national budget. It also recommends corporate bodies, both private and public, to consider corporate social responsibility in a way that promotes the welfare of slum residents in a sustainable way, considering that their direct and indirect workforce and consumers of their products and services constitute people living in deplorable conditions in the slums.
8.0 References
Areba, T. (2013). The society comes first. Management, a publication of the Kenya Institute of Management,
July, 2013.
Barra, S. (2005). Environment and Urbanization: Towards a pro-poor framework for slum upgrading in Mumbai, India, Vol. 17 No. 1 April 2005.
Cities alliance. (2012). Annual report on Cities without slums. http://www.citiesalliance.org, accessed 21st October, 2012
COHRE (2006). Forced evictions and human rights: A manual for action, 3rd edition. Field, A. P. (2009). Discovering statistics using SPSS (3rd edition). London: Sage
Huchzermeyer, M. (2008). Slum upgrading initiatives in Kenya within the basic services and wider housing market: A housing rights concern. Centre on Housing Rights and Evictions (COHRE), Geneva.
Isreal, G.D. (2009) Determining sample size. University of Florida
Joanes , D. N. and Gill, C. A. (1998). “Comparing measures of sample skewness and kurtosis,” Journal of the Royal Statistical Society Series D, Vol.47(1), pp. 183-189.
Kenya National Bureau of Statistics (2009). Kenya facts and figures.
Kenya slum upgrading programme (KENSUP) (2009). Strategy document.
Kenya vision 2030. (2007). A globally competitive and prosperous Kenya. The National Economic and social council of Kenya (NESC). Kenyatta International Conference Centre (KICC).
Kihoro, M. (2013). Africa stares at a housing crisis. Management, a publication of the Kenya Institute of Management, August, 2013.
Kimani, B. (2013). National housing deficit. Management, a publication of the Kenya Institute of Management, April, 2013.
Ministry of housing (2006). Improving the lives of slums dwellers, Needs assessment report, Requirements for goal No.7, Target 11.
New internationalist magazine(2006). Urban explosion: The facts, Issue 386.
Njathi, E. M. (2011). The challenges of housing development for the low income market, Strathmore University, Nairobi.
Obure, B. (2013). Real estate still lucrative. Management, a publication of the Kenya Institute of Management, August, 2013.
Peterson, B. (2013). How to rate CSR performance. Management, a publication of the Kenya Institute of Management, July, 2013.
Sana, O. (2012). Taking stock of social-economic challenges in the Nairobi slums: An inventory of the pertinent issues between January 2008 and November 2012. Friedrich-Ebert-Stiftung (FES), Nairobi.
The constitution of Kenya. (2010). The bill of rights: Rights and fundamental freedoms. Chapter four, Article 42 & 43(b). Government printer, Nairobi
The World Bank. (2006). World development report: New York, Oxford University
The World Bank. (2008). Kenya Poverty and inequality assessment, Report no. 44190 KE, Washington DC. The World Bank. (2011). Developing Kenya’s Mortgage Market. Report no. 63391 KE, IBRD/The World Bank,
Washington DC.
Transparency International. (2003). Dealing with the pas, Nairobi.
Human Settlements 2003, Earthscan Publications Ltd. Gateshead, UK and Sterling, USA.
UN habitat. (2004). State of the world’s cities, 2004/2005: Globalization and urban culture. Earthscan Publications Ltd. UK and USA.
UN habitat. (2006). State of the world’s cities, 2006/2007: The millennium development goals and urban sustainability: 30 years of shaping the habitat agenda. Earthscan Publications Ltd. UK and USA. UN habitat. (2008). State of world’s cities, 2008/2009: Harmonious cities. Earthscan Publications Ltd. London UN habitat. (2012). State of the world’s cities, 2012/2013: Prosperity of cities. Routledge, New York.
UN habitat, (2013). Country programme document, 2013-2015: Kenya
UN habitat.(2013). Sustainable urban development: Role of cities in creating improved economic opportunities for all, with special reference to youth and gender. Twenty-fourth session, Nairobi, 15-19 April 2013. Retrieved from http://www.unhabitat.org/downloads/docs/11895_1_594747.pdf
Table 1: KMO and Bartlett's Test
Kaiser-Meyer-Olkin Measure of Sampling Adequacy. 0.532 Bartlett's Test of Sphericity Approx. Chi-Square 4650.359
Df 820.000
Sig. 0.000
Source: Research findings, 2013
Table 2 :Research Reliability Statistics
Cronbach's Alpha N of Items
0.502 24
Source: Research, 2013 Table 3: Demographics
Variable Classification Percentage
Gender Female 71
Male 29
Age groups Under 20 years 0
20 - 25 24
46 - 60 68
Over 60 8
Marital status Single 30
Married 65
Widowed 5
No. of children Nil 20
1-2 49
3-5 29
6 and above 2
Education level None 5
Primary 10 Secondary 44 College 41 University 0 Employment Employed 76 Unemployed 24
Form of employment Jua kali, mason, tailor, casual 65 Security, cleaning, driver 30
Business 3
Permanent jobs 2
Monthly household income Less than 10,000 40
10,000 – 30,000 57
31,000 – 50,000 3
No. of adults living in the house 1 - 2 50
3 - 5 43
6 and above 7
No. of children sharing the house Nil 28
1 - 2 47
3 - 5 23
6 and above 2
Table 4: Residential Housing Situation in Slums
Variable Classification Percentage
No. of years lived in the slum Less than 5 years 34
6 – 20 years 66
Size of house Single room 81
1 bedroom 19
Ownership Rental 100
Self owned 0
Rent Less than 1,000 11
1,000 – 3,000 66
3,000 – 10,000 23 10,000 – 50,000 0
Building material Permanent 27
Semi permanent 73
Storey One 81
2 - 5 19
Evaluation of the cost of housing Very cheap 7
Cheap 19
Expensive 58
Very expensive 16
Source: Research findings, 2013
Table 5: Availability of Decent Housing in Slums
Variable Classification %
Storey One 81
2 - 5 19
Location of toilets In-house 5
Outside the house 95
Sewer discharge Septic tank 14
Council sewer line 35 Waste water drain 41
Others 10
Electricity supply Yes 63
No 37
Source of electricity Not applicable 27
Kenya power 45
Illegal connection (tapping) 19
Others 9
Location of water source In-house 10 Outside the house 81
Far away 9
Source of water Council 60
Illegal connection (tapping) 28
Bore hole 4
Vendors 8
Type of access road Tarmac 22
Murram 24
Muddy path 54
Availability of social housing schemes Yes 25
No 75
Quality of services provided by council Very poor 46
Poor 47
Good 7
Do you prefer house to be demolished for improvement Yes 75
No 25
Size of adequate house Single room 11
1 bedroom 25
2 – 3 bedroom 62
Over 3 bedroom 2
Figure 2: Size of adequate house in slums
Table 6: Decency of housing in slums
Variable Classification Percentage
Key problems in the residence Rent, sanitation, water, security 70
Infrastructure 20
Both cases above 10
Quality of housing in slums Most favourable 0
Favourable 2
Unfavourable 38
Most unfavourable 60
Rate the residential housing situation Very poor 42
Poor 46
Good 11
Very good 1
Source: Research findings, 2013 Table 7: Public housing schemes
Variable Classification Percentage
Should the government facilitate low cost housing?
Yes 90
No 10
How should the government facilitate Don’t know 5
Provision of low cost housing 76
Infrastructure 8
Low priced loans 11
The government has failed to improve slums Strongly disagree 0
Disagree 2
Agree 5
Strongly agree 93
Table 8: Availability Rotated Component Matrix Component 1 2 3 4 5 Location of toilets 0.791 Sewer discharge 0.844 Electricity connectivity 0.828 Source of water 0.733
Type of access road 0.818
Availability of social housing schemes 0.583
Upgrade of slum houses 0.530
What size of a house is adequate 0.842
Extraction Method: Principal Component Analysis. Source: Research findings, 2013 Rotation Method: Varimax with Kaiser Normalization.
Table 9: Cross Tabulation of Household Population of Adults and Children Number of children
0 1-2 3-5 6 and above Total
Number of adults 1-2 14 30 6 0 50 3-5 10 17 14 2 43 6 and above 4 0 3 0 7 Total 28 47 23 2 100
Source: Research findings, 2013
Table 10: Rotated Component Matrix on Affordability of Housing Component
1 2
Household income 0.606
Rent 0.799
Residential housing situation 0.593
Source: Research findings, 2013
Extraction Method: Principal Component Analysis. Rotation Method: Varimax with Kaiser Normalization.
Table 11: Correlation between Income and the Cost burden of housing in slums
Income The cost burden in housing
Income Pearson Correlation 1.000 -0.293**
Sig. (2-tailed) 0.003
N 100.000 100
The cost burden in housing
Pearson Correlation -0.293** 1.000
Sig. (2-tailed) 0.003
N 100 100.000
**. Correlation is significant at the 0.01 level (2-tailed). Source: Research findings, 2013
Table 12: Correlation Between Rent and the Housing Situation in Slums
Rent Housing situation
Rent Pearson Correlation 1.000 0.289**
Sig. (2-tailed) 0.004 N 100.000 100 Housing situation Pearson Correlation 0.289** 1.000 Sig. (2-tailed) 0.004 N 100 100.000
**. Correlation is significant at the 0.01 level (2-tailed). Source: Research findings, 2013 Table13: Cross Tabulation of Household Income and the Rent paid in Slums
Rent
Less than 1,000 1,000 – 3,000 3,001 – 10,000 Total Household income 1. Less than 10,000 10 20 10 40 2. 10,000-30,000 1 44 12 57 3. 31,000-50,000 0 2 1 3 Total 11 66 23 100
Source: Research findings, 2013
Table 14: How the government should upgrade slums * The government not doing enough: Cross tabulation in percentage.
Government has not adequately addressed slum housing problems
Disagree Agree Strongly agree Total How the government
should facilitate low cost housing
0 – No idea 2 0 3 5
1 – Low cost housing 0 2 74 76
2 - Infrastructure 0 0 8 8
3 – Low priced loans 0 3 8 11
Total 2 5 93 100