CEP Discussion Paper No 702
July 2005
The Growth of Network Computing:
Quality Adjusted Price Changes for Network Servers
John Van Reenen
Abstract
In this paper we investigate the evolution of quality adjusted prices for servers motivated by two facts. First, the productivity acceleration in the US economy since the mid 1990s is closely linked to spread of information technology of which networked computing is a large component. Second, the growth of network computing itself has been fostered by the rapid growth in the quality and quantity of the network server market. Like Pakes’ (2003) analysis of the PC market, we show that our preferred version of the hedonic price index (“complete hybrid”) fell much more rapidly than the standard “matched model” price index (the hedonic index fell on average by about 30% per annum compared to 17% p.a. for the matched model). This difference is mainly due to the selection bias in the standard matched model price index due to the exit of obsolete models which would have had the fastest price falls.
Keywords: hedonic prices, network servers, computers JEL classification: O3, L1, L4
This paper was produced as part of the Centre’s Productivity and Innovation Programme. The Centre for Economic Performance is financed by the Economic and Social Research Council.
Acknowledgements
I would like to thank IDC for allowing me to use their Server Quarterly Tracker Dataset. Hristina Dantcheva, Jose Martin and Rameet Singha have given substantial help with preparing the data. Particular thanks to the software engineers at Sun Microsystems (in particular Mark Terranova) for much help with the technological details of networks. Helpful comments have been given by an anonymous referee, Pedro Barros, Ernst Berndt, Michele Cincera, Franz Palm, Bas ter Weel, Christian Wey, and seminar participants in Berlin, LSE, Leuven and Maastricht. The author has acted as a consultant for Sun Microsystems in the past. The opinions expressed here are entirely in a personal capacity and responsibility for all errors remains my own.
John Van Reenen is the Director of the Centre for Economic Performance and Professor of Economics at the Department of Economics, London School of Economics.
Published by
Centre for Economic Performance
London School of Economics and Political Science Houghton Street
London WC2A 2AE
All rights reserved. No part of this publication may be reproduced, stored in a retrieval system or transmitted in any form or by any means without the prior permission in writing of the publisher nor be issued to the public or circulated in any form other than that in which it is published.
Requests for permission to reproduce any article or part of the Working Paper should be sent to the editor at the above address.
© J. Van Reenen, submitted 2005 ISBN 0 7530 1882 9
1.
Introduction
The slowdown of US productivity growth that began in the mid 1970s appeared to have reversed itself after the mid-1990s. This remarkable productivity acceleration is believed to be closely linked to the production and spread of information and communication technologies (ICTs) bringing an end to “Solow’s Paradox” – the fact that computers appeared to be everywhere apart from the productivity statistics2.
A key part of the link between productivity growth and ICT is the rapid fall in quality adjusted prices, especially since 1995. Unfortunately, our knowledge of this price fall is based on rather few studies3. In particular, there have been no comprehensive studies for network servers
which are a large and rapidly growing part of the corporate IT capital stock. Most papers consider computers as a whole rather than disaggregating into the different types of IT. This lacuna is surprising since the Internet relies on servers for its existence and the network effects stressed by many theories of the revolutionary effects of IT (see below) are closely linked to the development of network servers themselves. Worldwide, corporations spent $56bn on servers in 20004 compared to $124bn for PCs, and the growth on servers has far outstripped that on PCs since 1995. Furthermore, servers have been at the centre of the several competition policy debates including the European’s Commission’s Decision in 2004 against Microsoft (European Commission, 2004).
2 See inter alia, Jorgenson (2001).
3 See Triplett (1989, 2004) for an extensive discussion. Fontana (2003) and Doms and Forman (2003) examine quality adjusted prices for Local Area Network equipment. van Mulligen (2003) calculates some hedonic prices for servers but only for one country (the Netherlands) and only for 1999-2001.
This paper also tackles an important methodological issue that hampers studies of the price changes in high tech markets with many “new goods”. It has long been recognised that just looking at unadjusted price changes can lead to underestimation of consumer benefits as there are rapid increases in quality in these sectors. The question is how to best measure the “true” quality adjusted price change? The standard approach to dealing with quality changes by the statistical agencies is the “matched model” price index that compares the prices of identical models at two points of time. This has serious potential problems when there is rapid entry and exit of models. The obsolete models which exit are likely to be of systematically lower quality than the surviving models and would therefore have been subject to larger price falls had they remained in the market. Because these exiting models are not used to calculate price changes in the standard matched model approach, the statistical agencies may be missing out on some of the substantial real price falls as they are relying on a highly selected sample of data (effectively under-sampling the left tail of the price change distribution). This is particularly a problem for the server market as in a typical year over half of the models exit in our dataset.
There are several ways to address this problem recently highlighted by Pakes (2003). The hedonic approach is based on regressing prices on characteristics so we have estimates of the prices of models even in periods when they are not available in the market. Thus the problem of missing data from exiters (and indeed entrants) can be solved by using a “proper hedonic” index. The hedonic price regression has the disadvantage that it is a reduced form and its coefficients cannot in general be related back to primitives (see section 3 for an example). This means that it is likely that the coefficients will be unstable over time and we must allow for this in the estimating procedure. Nevertheless, Pakes (2003) provides conditions under which the hedonic index still provides an upper bound to the compensating variation. Another disadvantage of the “proper hedonic” approach is that there will be estimation variance
introduced into the construction of the price index that is avoided in the matched model approach. Our preferred index uses the matched model price change where this exists but substitutes its hedonic estimate when the model exits the market. This index, called the “complete hybrid” by Pakes avoids the selection bias problem of exiting models, but keeps the variance reduction property of the matched model index for surviving models. We compare across all the models for servers to show that the complete hybrid has these attractive properties in practice as well as in theory.
We estimate that the price fall for servers is something of the order of 30% per annum between 1996 and 2001 in the US. By contrast, the matched model index shows only a 15% fall per annum. We present similar calculations for Western Europe that also show these biases. Interestingly, price falls appear to be somewhat slower in Europe than in the USA. This may be one reason why the diffusion of information and communication technologies (ICTs) and productivity growth in the late 1990s was less impressive in Europe than in the USA (see van Ark and O’Mahony, 2003). We also show that there are differential price trends for low end “work group” servers compared to high end “enterprise” servers. Low end server prices have fallen much more quickly than high end server prices.
This paper has several links to Van den Berg (2005). First, the sharp fall in server prices we document is consistent with the idea that customers have become much better informed about (dispersed) prices over time and this has put downward pressure on vendors’ prices. The fact that much of the price change is driven by the exit of obsolete models is also consistent with Van den Berg’s emphasis on reallocation effects. Second, our paper systematically documents the rapid growth in the quantity and quality of computer networks. These networks foster improved information flow (e.g. through the development of the Internet) that have massively
reduced search costs5. This potentially switches the economy from an inefficient equilibrium with wide price dispersion to an efficient equilibrium with lower average price and lower dispersion. These two mechanisms are self-reinforcing: server prices fall through improved information flows which, in turn, foster the growth of the server market and therefore faster information diffusion in other markets. For example, falling real server prices helped fuel the growth of web-sites and on-line auctions for intermediate goods. Finally, and related to the first point, it has been argued that the mid 1990s represents a structural break in the US in the sense that hedonic prices of computers fall much more rapidly than in earlier periods and this helped drive the productivity acceleration (Jorgenson, 2001). Van den Berg’s model predicts such discontinuities. Although we do not have early 1990s server data to directly test this, it is unlikely that server price falls where as rapid as the 30% per annum or so falls that we document here.
The plan of the paper is as follows; Section 2 gives a brief introduction to the features of network serving and discusses the data. Section 3 sketches our modelling strategy and Section 4 contains the results. We draw some conclusions in section 5.
2.
Descriptive analysis of the server market
Network Servers
In the late 1980s and beginning of the 1990s computing architecture went through a paradigm shift. The mainframe-orientated system was overthrown by the "PC client/server" computer architecture that is familiar today6. Instead of computer intelligence being centralised and users
5 Although much of the growth of servers has fostered information flow within companies, servers are used to host web-sites and act as e-mail servers which have boosted the development of the Internet and e-commerce.
interacting via “dumb” terminals, processing power was more decentralised, distributed between PCs with their own operating systems and increasingly powerful servers linking these PCs together in networks.
Computing can be performed locally on stand-alone appliances such as using a laptop computer away from the office. Most computing, however, is performed on multi-user networks in which users communicate through ‘clients’ and in which much of the computing activity takes place behind the scenes on ‘servers’7. The clients in a client-server network take many forms. Some are ‘intelligent,’ such as a desktop computer; others are ‘non-intelligent,’ such as a dumb terminal (e.g. an ATM machine). Servers vary in size and in the nature of the tasks they are asked to perform. The mixture of servers in a client-server network depends on the kinds of computing that the network is designed to support. The server requirements of a small office, for example, are considerably different than the server requirements of a large international bank.
Like all computers, servers consist of both hardware (e.g. the processors and storage facilities/memory) and software (e.g. the operating system). Server hardware is manufactured using various types of processors. Intel processors are used in many servers, and Microsoft’s Windows operating system is compatible only with hardware that uses Intel processors. Novell’s NetWare and SCO’s UNIX variants are also designed to run on Intel processors. The leading hardware manufacturers for Intel-based servers include Compaq/HP, Dell, Gateway and IBM.
Server vendors mostly sell Intel-based systems on a non-integrated basis. An organisation usually buys server hardware from one vendor with the server operating system installed from another vendor. Server systems are also sold on an integrated basis in which the vendor supplies both the server hardware and a proprietary operating system that has been specially designed for the vendor’s hardware (e.g. Sun Microsystems).
One of the principal benefits of a computer network is that it allows an organisation to share computer resources among multiple users. Clients connected to a network can share printers and files. Application programmes can be maintained on central servers and then ‘served’ to clients on an as-needed basis. In addition, computers connected to a network can run distributed applications. Distributed applications are computer programmes in which different blocks of the programme are executed on different computers within the network.
There are at least two tiers of network computing sometimes called the business layer (run on “work group servers”) and the data layers (run on “enterprise servers”). Work group servers are used to perform a number of the basic infrastructure services needed for the computers in a network to share resources. Work group servers most commonly handle security (authorisation and authentication of users when they connect their clients to the network), file services (accessing or managing files or disk storage space), print services (sending print jobs to a printer managed by the server), directory services (keeping track of the location and use of network resources), messaging and e-mail, and key administrative functions in the management of the work group network. In addition to infrastructure services, work group servers also execute certain kinds of server-side applications. In many organisations, there is a pressing need to manage enormous (and growing) amounts of data that are critical to the mission of the organisation. Inventory control, airline reservations and banking transactions
are just a few examples. The ‘mission-critical’ data used for these purposes need to be stored, updated, quality controlled, and protected. They also need to be readily available to authorised users. The servers that perform these mission-critical data functions are frequently referred to as enterprise servers. Enterprise servers tend to be larger and significantly more expensive
than work group servers. A work group server usually has one (or sometimes two) microprocessors and modest memory (around four gigabytes). A work group server typically provides services for 20-30 clients. Enterprise servers, in contrast, tend to have at least eight processors, usually cost more than $25,000 and in some circumstances can cost more than $1 million. In contrast to the standardised applications that run on work group servers, application programmes for enterprise servers tend to be custom written and specific to a particular organisation.
Data Description
We have used data from the International Data Corporation's (IDC) Quarterly Server Tracker database8. This enables us to analyse the evolution of price, revenue and unit sold of every server between the first quarter of 1996 and the first quarter of 2001. In principle IDC covers the population of models. It gathers revenue and characteristics data from vendors in all the main regions9 and then cross- checks the company totals with global HQs and its own customer surveys. Transaction prices (called “street prices” by IDC) are also estimated on a region-specific, quarterly, model-by-model basis. These prices take into account the various discounts offered off the list price as well as trade-ins.
8 7th June 2001 version. For a full description of this database and the recent evolution of the market see IDC (1998, 2000b). The equivalent dataset for PCs has been used by Pakes (2003) and Foncel and Ivaldi (2001). 9 The regions are North America, Western Europe, Japan, Asia-Pacific and Rest of World. We have also done some analysis on the world market as a whole and in Japan (see Van Reenen, 2004). The other regional data in IDC (“Rest of Asia” and “Rest of World”) appeared less reliable due to smaller sample size.
We break down the IDC data into the USA and Western Europe, the main two regional markets. Looking in a cross section we define an observation in a region as a vendor-family-model. So a typical example would be Sun’s (vendor) Ultra-Enterprise (family) 3000/3500
series (model) - this was priced by IDC at about $65,000 in the first quarter of 2000 in the
USA. A model still contains some grouping across different “versions” in the data, so we are careful to break the series whenever there is a change in average characteristics.10
There are a number of characteristics available in the IDC Server Tracker which include: the number of Central Processing Units (CPUs), whether the system is rack-optimised11, the number of rack slots, the chip architecture (RISC, CISC or IA32), motherboard type (e.g. Symmetric Parallel Processing - SMP), the types of operating system used (Windows, Unix, Netware, OS390/OS400, VMS and others – including Linux), and hardware vendor dummies. One obvious concern was that these characteristics do not pick up all the relevant variation in quality in the hedonic regressions. To address this we also collected extra data on server characteristics and matched them into the IDC data. Data were collected for the following ten major server vendors: Compaq, Digital, Tandem, Dell, Fujitsu, Hewlett, Packard, IBM, Siemens and Sun Microsystems. We used a wide variety of sources to obtain these data including the trade manual Datasources, company web-pages, back issues of computer
magazines and their web pages and major resellers. We also received help by contacting some of these organisations directly. We collected a wide variety of characteristics, the most
10Weuse data from the first quarter of each year. To make sure that the models are perfectly matched we define a
model more precisely than IDC declaring a new model when any of the characteristics change (there are some small changes in the original IDC dataset as models are aggregations of similar versions). This left us with 1,143 models in the USA between 1996 and 2001. The balance of the panel was as follows 765 models were observed for 1 year, 237 for 2 years, 86 for 3 years, 34 for 4 years, 20 for 5 years and only one for all 6 years.
11
Rack mounted servers are designed to fit into 19 inch racks. They allow multiple machines to be clustered or managed in a single location and enhance scalability.
informative of which were memory, clock/processor speed and internal storage12. The final dataset covered 60% of the IDC models (we cover 1,143 distinct models) and over 80% of the revenues of all servers13.
Note that our method is slightly different from the Pakes (2003) study. Pakes uses version level models that are not reported in the IDC data but are reported in PC magazines. This has the advantage that he can use characteristics at a more finely disaggregated level than we do here. But it has the disadvantage that he relies on list prices rather than transaction prices and that he has to arbitrarily allocate sales between the different versions of the models.
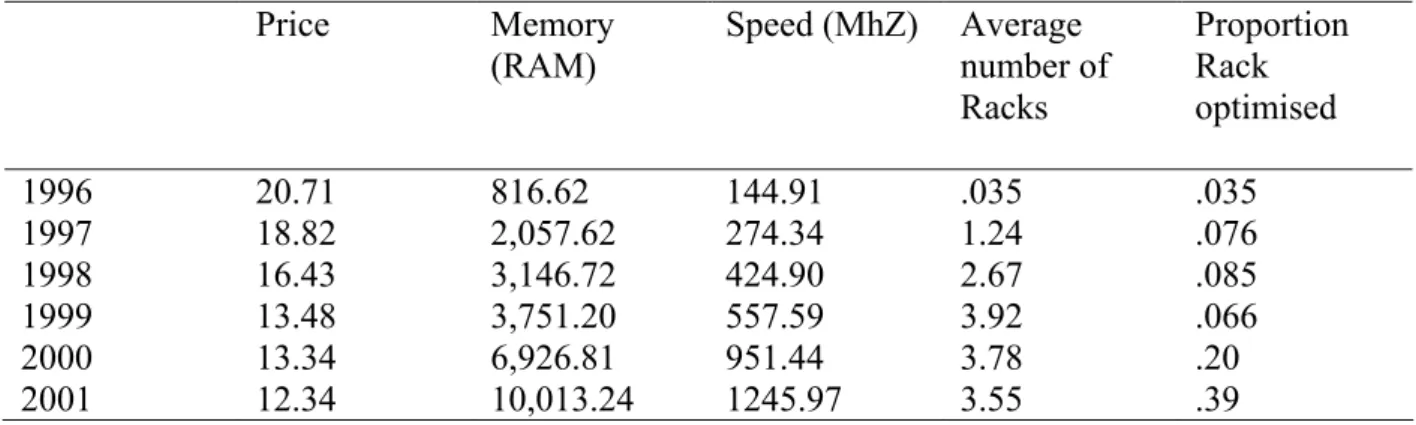
The descriptive statistics in Table 1 show rapid falls in average prices but also major increases in quality over our time period. In 2001, the average server had a memory over twelve times as powerful as the 1996 average and was eight times faster. This implies that simply looking at unit values will underestimate the quality adjusted fall in sever prices (the average model in 2001 was 60% of the price of the average model in 1996).
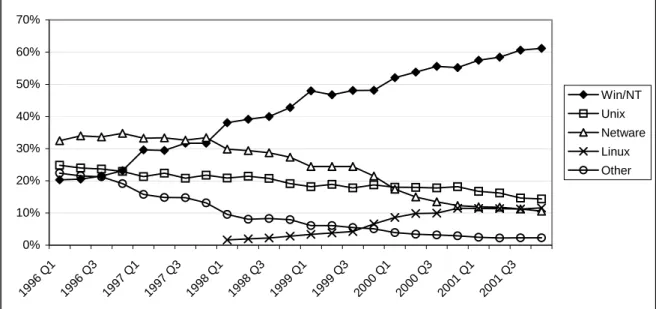
Figures 1 and Figure 2 show the change in market share by hardware and software vendor for major vendors. Among hardware vendors the Sun (at the higher end of the market) and Dell (at the lower end of the market) have grown their market shares over the period; IBM has lost share as have HP and Compaq (to a lesser extent). Among the operating system vendors the rapid ascent of Microsoft is particularly striking. Microsoft’s increase has been almost entirely
12 Other characteristics included cache size on chip, cache size on board, list price, disk capacity in cabinet, maximum external storage, maximum Input-Output channels per processor, maximum Input-Output bandwidth. These had less explanatory power in the hedonic regressions than the three variables we focused on.
13 Our primary method of matching was through the model name, but we could also use characteristics common to IDC and the model specification to check the accuracy of the match (e.g. maximum number of processors). Models are sometimes aggregated by IDC across several versions. IDC weights the final characteristics according
to importance (i.e. by revenue). Since we did not have revenues by version we considered the minimum version, the median version and the maximum version. The results are given for the characteristics of the median version, but using the minimum or maximum made little difference to the results
in the low-end work group segment and has been mainly at the expense of Novell’s Netware14. Linux has also made some gains, but still only had a 12% market share in 2001
3. Modelling framework
In this section we lay out a framework to illustrate the economic relationship between prices and characteristics for servers. We show in the context of a simple model the difficulties of interpreting the price-characteristics relationship.
Let (xi, pi) be the vector of characteristics and prices of good i, and (x-i, p-i) denote the
characteristics and prices of other goods. Demand for good i is
Di = D(xi, pi,x-i, p-i;A)
Where A indexes attributes which determine distribution of consumer preferences over
characteristics. Assume marginal cost is constant and given by c(xi) and all firms are single
product. Under Bertrand competition equilibrium prices are given by:
| / (.) | (.) ) ( p D D x c p i i i i ∂ ∂ + = (1) where | / (.) | (.) p D D i i ∂
∂ is the mark-up over marginal cost and will vary inversely with the
elasticity of demand. The hedonic function h(xi) is simply the expectation of price conditional
on xi. From equation (1) this is simply
14 We use unit shares for software vendors as it is difficult to calculate the revenue share of an operating system - it is sold bundled with the hardware. Furthermore, since Linux is free we would ignore the importance of open source if we used revenue shares for operating systems.
⎟⎟ ⎠ ⎞ ⎜⎜ ⎝ ⎛ ∂ ∂ + = ≡ i i i i i i i i x p D D E x c x p E x h | | / (.) | (.) ) ( ] | [ ) ( (2)
where E(.|.) is the conditional expectations operator. The hedonic function is a sum of the marginal cost function (the first element on the right hand side of equation (2), c(xi)) and a
function that summarises the relationship between mark-ups and characteristics (the second element on the right hand side of equation (2)). The signs of characteristics in the mark-up function will depend on the characteristics of the competing products and the distribution of consumer characteristics in a complex way. The signs may well change over time and take different signs from those in the cost relationship.
In general we should not expect theory to generally impose any sign restrictions on equation (2) and we should expect parameter instability over time. The coefficients on characteristics cannot be simply mapped back into “marginal willingness to pay” derivatives or “cost” derivatives except in the context of very unrealistic models. This does not mean that hedonic price functions are uninformative. They can be useful in providing “proper” indices that give an upper bound to the compensating variation needed to make consumers indifferent between base and comparison period utility.
Consider the Laspeyres type price index for a typical matched model (“MM”) index commonly used by statistical agencies (IMM)
∑
−∑
− ∈ ∈ − − − − − ⎟⎟ ⎠ ⎞ ⎜ ⎜ ⎝ ⎛ = 1 1 1 1 1 1 1 t t C i C i t i t i t i t i t i t i MM t q p q p x p p I (3)where q is quantity and Ct is the class of goods available at time t.
This index does not need explicit data on characteristics as it simply looks at the price change between periods t and t-1 of a particular model i. This is then weighted by the model’s share in
total revenue (“plutocratic weights”).
Define a second index as the “proper hedonic” (IPH) as
∑
−∑
− ∈ ∈ − − − − − − − ⎟ ⎟ ⎠ ⎞ ⎜ ⎜ ⎝ ⎛ = 1 1 1 1 1 1 2 1 1 ) ( ) ( t t C i C i t i t i t i t i t i t i t i t PH i q p q p x x h x h I (4)where ht(.) is the t-th period estimate of the hedonic function. Note that estimates of the
implicit price of a model this will exist for all periods even if the model does not exist in that period. The lack of sales will affect the “plutocratic” weight, however; it implies that IPH will
exist for only one period when IMM does not exist: the period just after the model exits the
marketplace (e.g. Triplett, 1989)15.
Our preferred index is the “complete hybrid” (ICH). This is the same as the matched model
index of equation (3) for those periods when prices are observed in t and t-1, but uses the
following definition when prices are observed in t-1, but not in t:
∑
−∑
− ∈ ∈ − − − − − − ⎟ ⎟ ⎠ ⎞ ⎜ ⎜ ⎝ ⎛ = 1 1 1 1 1 1 1 1) ( t t C i C i t i t i t i t i t i t i t CH t q p q p x p x h I (5)In our view, this combines the best of both models because (i) it enables us to construct a price index for models that exit and thus deal with the selection bias in the matched model; and (ii) it reduces the estimation variance endemic to the hedonic model and should therefore give more precise estimates.
We considered several functional forms for the hedonic relationship, but mainly use the standard log-log form which gives a good representation of the data.
∑
+ + = j t i t ij t j t t i a x p β log ε log (6)where the xj are characteristics of models (such as speed and memory). We allow the
relationship to be different across time periods as this has been found to be very important in previous studies (e.g. Berndt et al, 1995, 2001) and is suggested by equation (2). We present tests of pooling coefficients on characteristics over years and show that they are rejected.
Dropping the t-subscripts, note that the prediction of the hedonic function is
∏
= a jxji E i
x
Assuming that the εi is distributed normally, when estimating the level of price from the
hedonic function in log-log form we need to add the standard correction of exp(ˆ ) 2
1 ε2 16.
4
.
Results
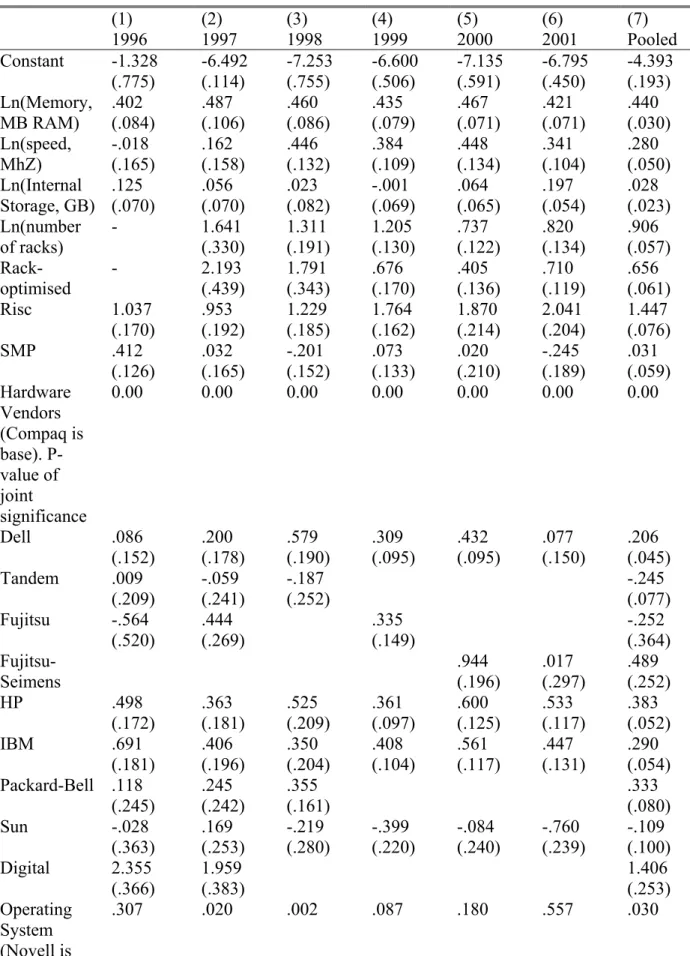
Table 2 contains the full set of price regressions each year between 1996 and 2001 (and a pooled estimation in the final column). Memory, the number of racks, rack optimisation and chip types has the strongest positive association with server price. Speed is also a consistently positive predictor, although weaker in 1996-1997 than between 1998 and 2001. Internal storage has a positive association, although it is generally weaker than memory or speed. Hardware dummies and operating system (OS) dummies are highly jointly significant in the pooled sample and generally jointly significant in the year by year regressions.
Although the signs of the characteristics are usually as expected in the sense that “better” characteristics are correlated with higher prices, the discussion in the modelling section emphasised that structural interpretation is difficult. The coefficients show quite a bit of variation from year to year. At the foot of Table 2 we observe that our controls account for at least three-quarters of the variance in price in every year. We experimented with dropping characteristics and including higher order terms which did change the explanatory power of the regressions although did not have a major impact on the qualitative results reported below. The exception to this statement is dropping memory and/or rack characteristics that lead to an underestimation of the price falls in the hedonic specification17.
16 Goldberger (1968)
Panel A at the bottom of Table 2 contains tests of restricting the coefficients to be equal across years. As with other studies of ICT we find that such restrictions are strongly rejected by the data (e.g. Berndt et al, 2001). The only restriction that we could not reject was the similarity of the coefficients in 1997 and 1996.
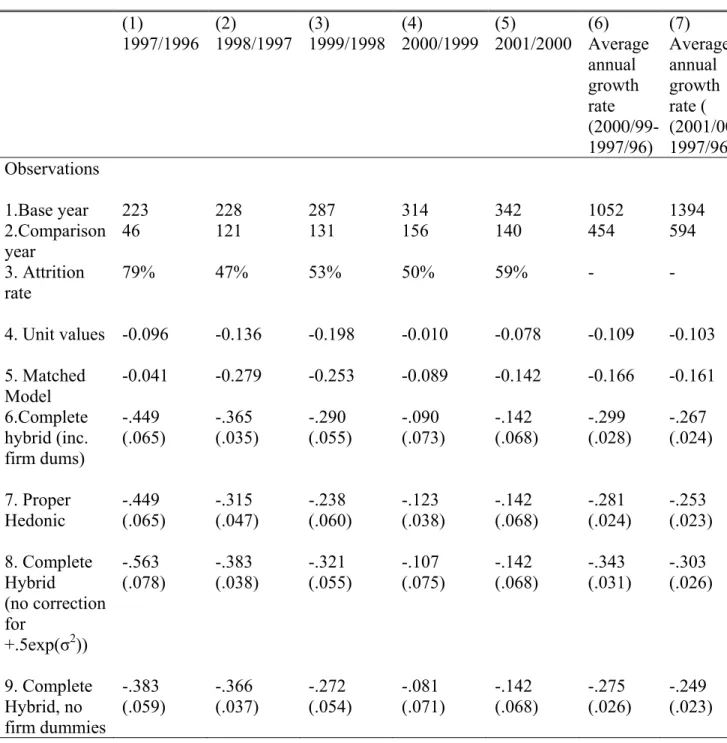
Table 3 contains our main results (for the USA). Columns (1) through (5) are associated with changes between the years indicated. Column (1), for example, has the change in quality adjusted prices between the first quarter of 1997 and the first quarter of 1996. Column (6) reports the unweighted average of the changes in the price index up to 2000 and column (7) extends this through to 200118.
The first three rows of Table 3 simply report the number of observations available to construct the different indices. The main point to notice is the high degree of attrition between years, ranging between 47% and 79%. There is a large amount of exit and entry of server models. Since the matched model index can only use the price data on those models which are available in both periods there is ample room for selection bias. For example in constructing the
2000/1999 index the matched model uses 156 observations, whereas the complete hybrid uses twice as many (all 314 models available in 1999).
The lower part of Table 3 reports different price indices. The fourth row labelled “unit values” just uses the change in the mean market price across all models (see Table 1 for the means). Average prices fall by about 10% per annum even before making any adjustment at all for quality change. The fifth row uses the matched model approach of equation (3). The matched
18 Note that the index for 2001/2000 are by construction the same for the matched model and the complete hybrid as hedonic prices cannot be computed for 2001 (we would need the price regression in 2002, which is outside our sample).
model index falls on average by 16.6% per annum between 2000/1999 and 1997/1996. This is impressive and much faster than the simple mean price, indicating that some control for quality has successfully been made. Our preferred index however is the “complete hybrid” and this falls much faster than the matched model – by about 30% per annum. The difference is mainly due to attrition, with the exiting models being on average those likely to show the largest price falls if they had survived. The difference is very dramatic in some years. In 1997/96 for example, the matched model index falls by only 4% whereas it falls by 45% in the hedonic price index. The reason for this is that the matched model suffers from substantial selection bias – about 80% of the models in 1996 have exited by 1997. Since the exiting models are likely to be the ones made obsolete, this will lead to significant upwards bias in the matched model price index.
Why was there so much churning in 1996? Industry reports suggest that in 1997 there were several important changes in the business environment facing server vendors. First, the rapid diffusion of “rack mounted” servers that were more easily scalable became widely available: this lead to the exit of the less scalable models. Table 1 shows that the mean number of racks was only 0.03 in 1996 whereas this figure jumped to 1.23 in 1997. Second, memory improved more dramatically than in any other year in our sample, by about 250% between 1996 and 1997. This was the fastest increase in any year of the sample. Finally, Dell computers began a rapid ascent in market share with its “direct to customer” inventory model (see Figure 1). All these factors contributed to the exit of less competitive brands19.
The index from the complete hybrid is similar to that in the proper hedonic (that uses predicted prices in every period in row 7). For example, the average annual growth rate was -28% for the proper hedonic compared to -30% for the complete hybrid 1996/7-2000/1999.
Some robustness tests are shown in the last two rows of Table 3. Failing to correct for the bias associated with predicting prices from the log functions leads to even more dramatic price declines (34% on average between 1997 and 2000). Dropping the vendor dummies leads to slightly slower price declines (27.5% on average between 1997 and 2000).
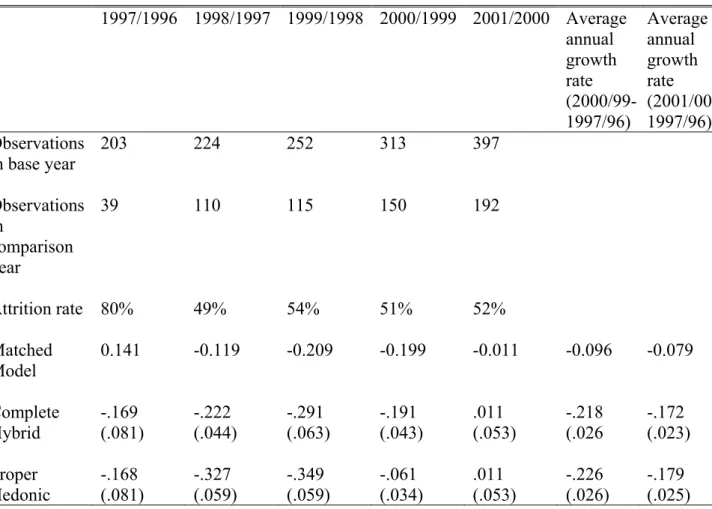
Table 4 presents results from Western Europe. The qualitative pattern is similar to the USA – the matched model index falls much more slowly than the complete hybrid (or the proper hedonic). In Europe the complete hybrid falls at about 22% per annum through 2000 compared to just fewer than 10% for the matched model. It is often assumed that there is a single world price for ICT – these results suggest that this may not be correct. There is evidence in many other markets of the failure of the law of one price to hold and of pricing to market behaviour by producers (e.g. Knetter, 1989). The standard practice in productivity studies of using the US hedonic price index for the EU is suspect in this case. Slower falls of server (and other ICT) prices may be a reason for slower diffusion of ICT in Europe and therefore slower productivity.
We also compared price falls in the low end (“work group”) and high end (“enterprise”) of the server market. Although the qualitative pattern noted before still holds up, the falls of prices (and their time series pattern) have been different for work group servers than for at the low end of the market than at the high end. The complete hybrid shows a price fall of 30% p.a. for work group servers compared to 20% p.a. for high end enterprise servers20. This is suggestive
20 A concern with this conclusion is that segments are defined on the basic of initial prices so we have a problem of endogenous sample truncation. This is mitigated because we select on initial not current price.
(although hardly conclusive) of different market segments for low end and high end servers (see Ivaldi and Lorinz, 2004, or Van Reenen, 2004 for more on market definition).
5
.
Conclusions
The rapid growth of network computing and the Internet has been fostered by the rapid fall in the quality adjusted prices of servers. Much of the fall in server prices is probably due to falls in the prices of inputs such as semi-conductor chips, but some of the fall may also be due to better information flows. In turn, the development of the network server market helps lower search costs and reduce prices elsewhere, maybe even shifting the equilibrium of the economy (as suggested by Van den Berg, 2005).
In this paper we have presented some estimates of hedonic price indices for network servers using a large database of transaction prices and quantities. We find that quality adjusted prices have fallen dramatically – something on the order of 30% per annum for our preferred index between 1996 and 2001 in the USA. This dramatic decline is underestimated by using the standard “matched model” method used by most statistical agencies. Matched model indices, by contrast, fall by only 15% per year in the USA. This is likely to be due to the high degree of exit by those models whose prices would have fallen much more rapidly than average had they remained in the market. The implication is that statistical agencies may well be
underestimating price falls for ICT products and therefore the contribution of IT to productivity.
Nevertheless, re-estimating using truncated regression (Hausman and Wise, 1984) lead to similar results to those reported here.
We also find that our conclusions over price falls hold for Western Europe as much as the USA, with the preferred hedonic index falling twice as fast as the matched model.
Interestingly, price falls in the EU do appear to be slower than in the US which could be a reason for slower adoption of ICT in Europe relative to the USA.
There are several directions future work should take. One is to understand the demand side of the server market in more detail in order to investigate the reasons for the growth of the market and what explains such changes such as Microsoft’s rapid growth in market share – was this innovation or anti-competitive degradation of interoperability? Secondly, analysing the dynamics of the market such as the welfare impact of the introduction of new goods is
important. Finally, a major challenge is to link the empirical work this more rigorously with the equilibrium theories of the impact of IT on the economy.
References
van Ark, Bart and O’Mahony, Mary (2003) “EU Productivity and Competitiveness: An industry Perspective. Can Europe resume the catching up process?” Report to the European Commission.
Berndt, Ernst and Rappaport, Neal (2001) “Price and Quality of Desktop and mobile personal computers: A quarter century historical overview”, American Economic Review, 268-271.
Berndt, E., Griliches, Zvi and Rappaport, Neal (1995) “Econometric Estimates of Prices Indexes of Personal computers in the 1990s” Journal of Econometrics, 68:1, 243-268.
Bresnahan, Timothy and Greenstein, Shane (1996) “Technical Progress and Co-invention in computing and in the uses of computers” Brooking Papers on Economic Activity:
Microeconomics, 1-78.
Brynjolfson, Erik (1996) "The contribution of information technology to consumer welfare”
Informations Systems Research, 7, 3, 281-300.
Doms, Mark and Forman, Christopher (2003) "Prices for Local Area Network Equipment." Federal Reserve Bank of San Francisco Working Paper 2003-13.
European Commission (2004) Judgement of European Commission vs. Microsoft, Brussels
24.3.04.
Foncel, J. and Ivaldi, M. (2001) “Operating System Prices in the Home PC market” mimeo Institut D’Economie Industrielle, forthcoming Journal of Industrial Economics.
Goldberger, Arthur (1968) “The interpretation and estimation of Cobb-Douglas Production Functions”, Econometrica 36, 3-4, 464-472.
Gordon, Robert (2001) “Does the New Economy measure up to the great inventions of the past?” Journal of Economic Perspectives, 14, 4, 48-74.
Hausman, Jerry and Wise, David (1984) “Social Experimentation, truncated distributions and efficient estimation” Econometrica, 45, 919-938.
Holdway, Michael (2000) “Quality adjusted computer prices in a producer price: an overview” mimeo, Bureau of Labor Statistics.
International Data Corporation (1998) "IDC's Server Market Methodology, Database Structure, and Definitions", IDC report #15909R, April 1998.
International Data Corporation (2000a) "Server Operating Environments Market Forecast and Analysis, 2000-2004", IDC report #22347, June 2000.
International Data Corporation (2000b) "Server Market Forecast and Analysis, 1996-2004", IDC report #22538, July 2000, pp.11-14
Ivaldi, Marc and Lorinz, Szabolics (2004) “A Full Equilibrium Relevant Market Test: Application to Computer servers” mimeo Toulouse University.
Jorgenson, D. (2001) “Information Technology and the U.S. Economy” American Economic Review 91, 1, 1-32.
Knetter, M. (1989) “Price Discrimination by U.S. and German Exporters” American Economic Review, 79: 198-210.
Pakes, Ariel (2003) “A Reconsideration of hedonic price indices with an application to PCs”
American Economic Review, 93(5), 1578-1593.
Rosen, Sherwin (1974) “Hedonic Prices and Implicit Markets: Product Differentiation in Pure Competition” Journal of Political Economy, 82, 34-55.
Sybex (2001) Networking Complete, San Francisco: Sybex.
Triplett, Jack (1989) “Price and technological change in a capital good: A survey of research in computers” Chapter 4 in Dale Jorgenson and Ralph Landau Technology and Capital
Formation Cambridge MA: MIT Press, 127-213.
Triplett, Jack (2004) “Hedonic Price Handbook”, Brooking Institute, mimeo.
Van Mulligan, P. (2003) “Alternative price indices for computers in the Netherlands using scanner data” Groningen Growth and Development Centre Working Paper 2003-65.
Van den Berg, Gerard (2005) “Revolutionary Effects of New Information Technologies” mimeo, Amsterdam.
Van Reenen, John (2004) “Is there a market for work group servers?” “Is there a market for work group servers?” Centre for Economic Performance Discussion Paper No. 650.
White, H. (1980) “A heteroskedastic-consistent covariance matrix estimator and a direct test for
Table 1: Means of Some Key Variables over Time (US market) Price Memory (RAM) Speed (MhZ) Average number of Racks Proportion Rack optimised 1996 20.71 816.62 144.91 .035 .035 1997 18.82 2,057.62 274.34 1.24 .076 1998 16.43 3,146.72 424.90 2.67 .085 1999 13.48 3,751.20 557.59 3.92 .066 2000 13.34 6,926.81 951.44 3.78 .20 2001 12.34 10,013.24 1245.97 3.55 .39 Notes
1739 observations. These are market averages – i.e. all models are weighted by the number of units shipped.
Table 2: Major Coefficients in Hedonic Price regressions, 1996-2001 (1) (2) (3) (4) (5) (6) (7) 1996 1997 1998 1999 2000 2001 Pooled Constant -1.328 (.775) -6.492 (.114) -7.253 (.755) -6.600 (.506) -7.135 (.591) -6.795 (.450) -4.393 (.193) Ln(Memory, MB RAM) .402 (.084) .487 (.106) .460 (.086) .435 (.079) .467 (.071) .421 (.071) .440 (.030) Ln(speed, MhZ) -.018 (.165) .162 (.158) .446 (.132) .384 (.109) .448 (.134) .341 (.104) .280 (.050) Ln(Internal Storage, GB) .125 (.070) .056 (.070) .023 (.082) -.001 (.069) .064 (.065) .197 (.054) .028 (.023) Ln(number of racks) - 1.641 (.330) 1.311 (.191) 1.205 (.130) .737 (.122) .820 (.134) .906 (.057) Rack-optimised - 2.193 (.439) 1.791 (.343) .676 (.170) .405 (.136) .710 (.119) .656 (.061) Risc 1.037 (.170) .953 (.192) 1.229 (.185) 1.764 (.162) 1.870 (.214) 2.041 (.204) 1.447 (.076) SMP .412 (.126) .032 (.165) -.201 (.152) .073 (.133) .020 (.210) -.245 (.189) .031 (.059) Hardware Vendors (Compaq is base). P-value of joint significance 0.00 0.00 0.00 0.00 0.00 0.00 0.00 Dell .086 (.152) .200 (.178) .579 (.190) .309 (.095) .432 (.095) .077 (.150) .206 (.045) Tandem .009 (.209) -.059 (.241) -.187 (.252) -.245 (.077) Fujitsu -.564 (.520) .444 (.269) .335 (.149) -.252 (.364) Fujitsu- Seimens .944 (.196) .017 (.297) .489 (.252) HP .498 (.172) .363 (.181) .525 (.209) .361 (.097) .600 (.125) .533 (.117) .383 (.052) IBM .691 (.181) .406 (.196) .350 (.204) .408 (.104) .561 (.117) .447 (.131) .290 (.054) Packard-Bell .118 (.245) .245 (.242) .355 (.161) .333 (.080) Sun -.028 (.363) .169 (.253) -.219 (.280) -.399 (.220) -.084 (.240) -.760 (.239) -.109 (.100) Digital 2.355 (.366) 1.959 (.383) 1.406 (.253) Operating System (Novell is .307 .020 .002 .087 .180 .557 .030
base). P-value of joint significance Windows -.018 (.113) -.027 (.111) -.081 (.092) -.118 (.094) -.047 (.093) .005 (.087) -.062 (.042) Unix .178 (.124) .188 (.130) .021 (.103) -.043 (.100) .125 (.111) -.084 (.110) .069 (.047) VMS .284 (.384) .166 (.339) -.428 (.185) -.392 (.254) -.107 (.232) -.306 (.211) -.134 (.128) OS390/400 .382 (.297) 1.038 (.345) 1.042 (.375) .254 (.327) -.204 (.253) -.589 (.433) .720 (.169) Linux (and others) .125 (.123) .128 (.127) .171 (.100) .150 (.093) .119 (.093) -.025 (.083) .093 (.044) 1997 dummy -.472 (.067) 1998 dummy -.768 (.068) 1999 dummy -1.190 (.071) 2000 dummy -1.423 (.091) 2001 dummy -1.624 (.098) Observations 223 228 287 314 342 345 1739 Adj R2 .775 .783 .768 .806 .772 .840 .779
Panel A: Some Tests of Restrictions across years
Test of parameter equality p-value Equality of coefficients across all years F( 96, 1614) = 3.27 0.00 Equality of coefficients 1996 and 1997 F( 20, 1614) = 0.63 0.90 Equality of coefficients 1996 and 1998 F( 20, 1614) = 1.64 0.04 Equality of coefficients 1996 and 1999 F( 19, 1614) = 3.29 0.00 Equality of coefficients 1996 and 2000 F( 19, 1614) = 4.80 0.00 Equality of coefficients 1996 and 2001 F( 18, 1614) = 4.63 0.00
Notes
Estimation by OLS. Standard errors (in brackets) are robust to arbitrary heteroskedacity (White, 1980). Regressions are run on data of the first quarter of indicated year. The final column also includes time dummies. Firm dummies are missing in some years because of merger and acquisition activity (e.g. Digital taken over by Compaq in 1998). All regressions also include a dummy variable if the server was uni-processor. We also included dummy variables if the server had no racks or had a missing variable for storage (the relevant continuous variable was set zero in these few cases).
Table 3 Alternative Price Indices for Servers, US Market (1) (2) (3) (4) (5) (6) (7) 1997/1996 1998/1997 1999/1998 2000/1999 2001/2000 Average annual growth rate (2000 /99-1997/96) Average annual growth rate ( ( 2001/00-1997/96) Observations 1.Base year 223 228 287 314 342 1052 1394 2.Comparison year 46 121 131 156 140 454 594 3. Attrition rate 79% 47% 53% 50% 59% - - 4. Unit values -0.096 -0.136 -0.198 -0.010 -0.078 -0.109 -0.103 5. Matched Model -0.041 -0.279 -0.253 -0.089 -0.142 -0.166 -0.161 6.Complete hybrid (inc. firm dums) -.449 (.065) -.365 (.035) -.290 (.055) -.090 (.073) -.142 (.068) -.299 (.028) -.267 (.024) 7. Proper Hedonic -.449 (.065) -.315 (.047) -.238 (.060) -.123 (.038) -.142 (.068) -.281 (.024) -.253 (.023) 8. Complete Hybrid (no correction for +.5exp(σ2)) -.563 (.078) -.383 (.038) -.321 (.055) -.107 (.075) -.142 (.068) -.343 (.031) -.303 (.026) 9. Complete Hybrid, no firm dummies -.383 (.059) -.366 (.037) -.272 (.054) -.081 (.071) -.142 (.068) -.275 (.026) -.249 (.023) Notes
All prices indices are of the Laspeyres type, annual (based on first quarter); standard errors in brackets after estimates (they are estimated by a bootstrap based on 200 replications);
Matched Model uses only price information for models that are in existence; Complete Hybrid uses hedonic imputation only when model has exited in previous four quarters and uses actual price (i.e. same as matched model) otherwise; Proper hedonic uses hedonic imputation in all periods. Attrition rate is the proportion of models that exist in year t that exit in year t+1.
Table 4 Alternative Price Indices for Servers, Western Europe 1997/1996 1998/1997 1999/1998 2000/1999 2001/2000 Average annual growth rate ( 2000/99-1997/96) Average annual growth rate ( 2001/00-1997/96) Observations in base year 203 224 252 313 397 Observations in comparison year 39 110 115 150 192 Attrition rate 80% 49% 54% 51% 52% Matched Model 0.141 -0.119 -0.209 -0.199 -0.011 -0.096 -0.079 Complete Hybrid -.169 (.081) -.222 (.044) -.291 (.063) -.191 (.043) .011 (.053) -.218 (.026 -.172 (.023) Proper Hedonic -.168 (.081) -.327 (.059) -.349 (.059) -.061 (.034) .011 (.053) -.226 (.026) -.179 (.025) Notes
All prices indices are of the Laspeyres type, annual (based on first quarter); Standard errors in brackets after estimates. (they are estimated by a bootstrap based on 200 replications);
Matched Model uses only price information for models that are in existence; Complete Hybrid Uses hedonic imputation only when model has exited in previous 4 quarters and uses actual price (i.e. same as matched model) otherwise; Proper hedonic uses hedonic imputation in all periods.
Figure 1: Evolution of market shares for hardware vendors (revenue)
Source: IDC Quarterly Tracker Survey
Notes: We have used the market structure in 2001 to allocate vendors who have been taken over (e.g. Digital and Tandem acquired by Compaq in 1998 and 1999 respectively). Fujitsu and Siemens had market shares of under 1% and are not shown here.
Figure 2: Evolution of market shares for software vendors (units)
Unit shares of the total server market
0% 10% 20% 30% 40% 50% 60% 70% 1996 Q1 1996 Q3 1997 Q1 199 7 Q 3 1998 Q1 1998 Q3 1999 Q1 1999 Q3 2000 Q1 2000 Q3 2001 Q1 2001 Q3 Win/NT Unix Netware Linux Other
701 Joas Santos Silva Silvana Tenreyro
The Log of Gravity
700 Alan Manning
Joanna Swaffield The Gender Gap in Early Career Wage Growth 699 Andrew B. Bernard
Stephen Redding Peter K. Schott
Products and Productivity
698 Nicholas Oulton Ex Post Versus Ex Ante Measures of the User Cost of Capital
697 Alan Manning You Can’t Always Get What You Want: the Impact of the Jobseeker’s Allowance
696 Andrew B. Bernard Stephen Redding Peter K. Schott
Factor Price Equality and the Economies of the United States
695 Henry G. Overman Anthony J. Venables
Cities in the Developing World
694 Carlo Rosa
Giovanni Verga The Importance of the Wording of the ECB 693 Richard Dickens
Mirko Draca
The Employment Effects of the October 2003 Increase in the National Minimum Wage 692 Ralf Martin Computing the True Spread
691 Augustin de Coulon François-Charles Wolff
Immigrants at Retirement: Stay/Return or ‘Va-et-Vient’?
690 Monika Merz
Eran Yashiv Labor and the Market Value of the Firm 689 Pierre-Philippe Combes
Giles Duranton Henry G. Overman
Agglomeration and the Adjustment of the Spatial Economy
687 Vicente Cuñat
Maria Guadalupe How Does Product Market Competition Shape Incentive Contracts? 686 Maria Guadalupe Product Market Competition, Returns to Skill and
Wage Inequality 685 Jo Blanden
Stephen Machin John Van Reenen
New Survey Evidence on Recent Changes in UK Union Recognition
684 Giovanna Vallanti Capital Mobility and Unemployment Dynamics: Evidence from a Panel of OECD Countries 683 Gilles Duranton
Michael Storper Rising Trade Costs? Agglomeration and Trade with Endogenous Transaction Costs 682 Carlo Rosa
Giovanni Verga Is ECB Communication Effective? 681 Nicholas Oulton
Sylaja Srinivasan
Productivity Growth and the Role of ICT in the United Kingdom: An Industry View, 1970-2000 680 Stephen Machin
Olivier Marie Crime and Police Resources: the Street Crime Initiative 679 Alan Manning
Barbara Petrongolo
The Part-Time Pay Penalty
678 Andrew Clark
Fabien Postel-Vinay Job Security and Job Protection
677 Eran Yashiv Evaluating the Performance of the Search and Matching Model
676 Alex Bryson Rafael Gomez Tobias Kretschmer
Catching a Wave: the Adoption of Voice and High Commitment Workplace Practices in Britain: 1984-1998
The Centre for Economic Performance Publications Unit Tel 020 7955 7673 Fax 020 7955 7595 Email [email protected]