1
CEP
POLICY
ANALYSIS
Immigration, the European Union
and the UK Labour Market
There are now over six million working age adults in the UK who were born abroad. This proportion doubled between 1995 and late 2013: from 8% to 16%. Immigration has fallen in previous recessions. This did not happen in the latest downturn.
European Union (EU) countries account for 28% of the total immigrant stock. New inflows of immigrants from the EU are now almost as large as inflows from outside the EU. Most EU arrivals are for work-related reasons. Most non-EU arrivals are for study-related reasons.
Immigrants are better educated and younger than their UK-born counterparts, especially those from the 15 countries that were members of the EU prior to 2004 (the EU15). The most recent immigrants are better educated still. Around 10% of all migrants are in full-time education. Immigrants are over-represented in the very high-skilled and very low-high-skilled occupations.
Almost 40% of all immigrants now live in London. Around 60% of the working age populations of Brent and Westminster were born overseas compared with less than 3% of those in Knowsley and Redcar & Cleveland.
Immigrants do not account for a majority of new jobs. The immigrant share in new jobs is – and always has been – broadly the same as the share of immigrants in the working age population.
There can be economic benefits associated with migration, especially to fill gaps in the UK labour market – where there are shortages of workers. While there may be some small relative wage or employment falls for particular (less skilled) groups, there is still little evidence of an overall negative impact on jobs or wages.
Centre for Economic Performance Houghton Street, London WC2A 2AE Tel: +44 (0)20 7955 7673 Fax: +44 (0)20 7955 7595
2
Introduction
Eighteen years of rising immigration between 1995 and 2013 mean that there are now around 7.8 million individuals (and 6.1 million adults of working age) living in the UK who were born abroad, up from 2.9 million in total (and 2.3 million of working age) in 1979. Over the same period, the UK-born population grew from 52 million to 55 million (and from 30.3 million to 32.4 million of working age). This means that 16% of the UK working age (and total) population are immigrants, double the share in early 1995 (see Figure 1A).
The stock of immigrants is affected by both the size of inflows and the duration of stay, which in turn is related to the number of outflows of immigrants. According to the Labour Force Survey (LFS), the inflow rate of immigrants into the UK fell back during the recession but has recently been rising again (see Figure 1B). The typical (median) immigrant has lived in the UK for 15 years.
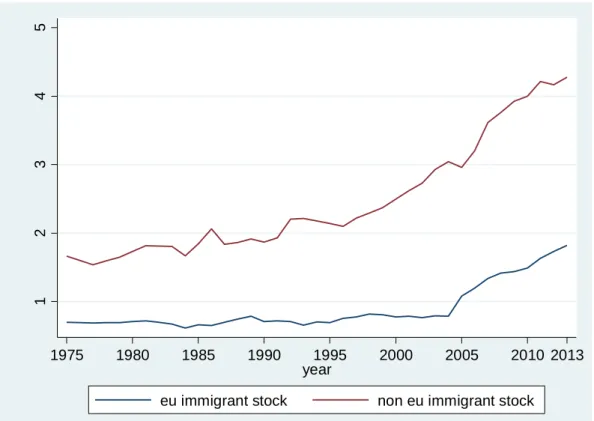
One of the reasons that some people favour the idea of the UK withdrawing from the European Union (EU) is the desire to restrict immigration. All EU citizens currently have the right to work in the UK. The UK was also one of only three countries to allow citizens of the ‘A8’ East European countries the right to work immediately after EU accession in 2004. Immigration to the UK from the rest of the EU has recently grown as fast as immigration from outside the EU (see Figure 1C). There are now nearly two million migrants from the EU resident in the UK.1
The UK government’s target of reducing net migration (the difference between the number of people entering the UK and the number of people leaving) to tens of thousands requires either a fall in the numbers entering the UK or a rise in the numbers leaving the UK (or both). Inflows from outside the EU have fallen in recent years, but this has been offset by rising inflows from within the EU. At the same time, emigration from the UK has fallen back in recent years, making it harder to achieve a reduction in net migration (see Figure 1D).
The stock of immigrants in the UK is influenced both by the country’s economic performance and by its immigration policy relative to other countries. Just as in Canada and Australia, the UK has an immigration system that seeks to restrict work-related immigration from outside the EU to skilled individuals. This means that the number of arrivals who come from outside the EU to study or for family reunion every year exceeds those arriving for work-related reasons.
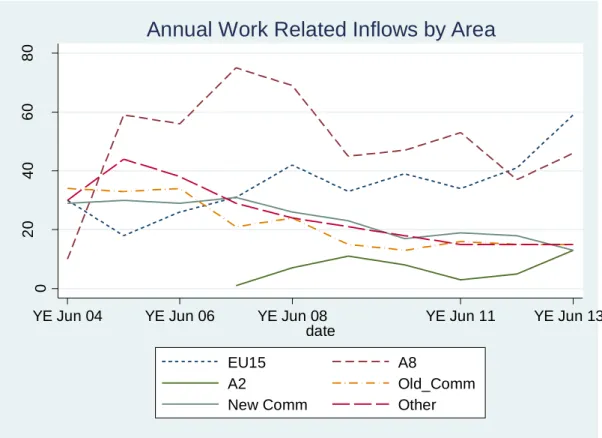
Most immigration from within the EU is for work-related reasons (see Figure 2A). Most immigration from outside the EU is for study-related reasons (see Figure 2B).
1Comparable figures for the number of UK-born living in the EU are hard to come by. The OECD estimates
that in 2011 there were at least 1.1 million UK-born individuals living in the rest of the EU (http://stats.oecd.org/Index.aspx?DataSetCode=MIG).
3
Figure 1A: The percentage of immigrants in the UK’s working age population, second quarter of 1975 to fourth quarter of 2013
6 8 10 12 14 16 % o f Im m ig ra n ts i n W o rk in g A g e P o p . 1975 1980 1985 1990 1995 2000 2005 2010 2013 year Figure 1B: UK immigrant inflows as a percentage of new immigrants in the working age population, 1983-2013 0 .5 1 1 .5 % o f N e w I m m ig ra n ts i n W o rk in g A g e P o p . 1983 1989 1995 2001 2007 2013 year
4
Figure 1C: UK immigrant population: EU versus Non-EU
1 2 3 4 5 m ill io n s 1975 1980 1985 1990 1995 2000 2005 2010 2013 year
eu immigrant stock non eu immigrant stock
Figure 1D: UK immigrant inflows and outflows: EU versus Non-EU
-150 -100 -50 0 50 100 150 200 250 300 1991 1992 1993 1994 1995 1996 1997 1998 1999 2000 2001 2002 2003 2004 2005 2006 2007 2008 2009 2010 20 1 1 2012 2013* F lo w s (0 0 0 s )
Total net migration Net British
Net EU Net non-EU
Source: Labour Force Survey (LFS) from various years. In Figures 1A and 1C, an immigrant is someone living in the UK who was born abroad. In Figure 1B, a new immigrant flow is someone who was born abroad and arrived from abroad in the previous 12 months.
5 Which countries do immigrants come from?
Table 1 shows the country of origin of the top five ‘sender’ countries in 2013 for the stock of existing immigrants and the flow of new immigrants. The sender countries are much less concentrated than in the past. Twenty-five years ago, one third of all immigrants came from just two countries: Ireland and India. These two countries now account for just 14% of all immigrants. The top three sender countries for the new arrivals to the UK in 2013 were India, the United States and Romania.
Table 1: Country of origin of immigrants to the UK (percentage share of migrants in brackets) Largest senders 1985 2013 All immigrants 1 Ireland (16.5%) India (9.4%) 750,000 2 India (13.5%) Poland (8.2%) 650,000 3 Pakistan (6.9%) Pakistan (6.0%) 470,000 4 Jamaica (5.1%) Ireland (5.0%) 400,000 5 Germany (4.6%) Germany (4.3%) 340,000
New immigrants (arrived in last year)
1 United States (20.6%) India (9.8%) 40,000
2 Ireland (10.6%) United States (6.7%) 28,000
3 India (5.2%) Romania (6.2%) 26,000
4 Pakistan (4.1%) Poland (6.1%) 26,000
5 Germany (3.9%) China (5.7%) 25,000
Source: LFS.
Figure 2A: UK immigrant work-related inflows by area of origin
Source: International Passenger Survey (IPS). Note: A2=Romania, Bulgaria; Old_Comm=USA, Australia, New Zealand; New_Comm=India, Pakistan, Bangladesh, Sri Lanka.
0 20 40 60 80 th o u s a n d s
YE Jun 04 YE Jun 06 YE Jun 08 YE Jun 11 YE Jun 13p
date
EU15 A8
A2 Old_Comm
New Comm Other
6
Figure 2B: UK immigrant study-related inflows by area of origin
0 20 40 60 80 1 0 0 th o u s a n d s
YE Jun 04 YE Jun 06 YE Jun 08 YE Jun 11 YE Jun 13p
date
EU15 A8
A2 Old_Comm
New Comm Other
Annual Student Inflows by Area
Source: IPS.
What skills do immigrants have?
Immigrants are, on average, more educated than their UK-born counterparts, and the educational attainment gap has been rising over time since more recent immigrants are more educated, on average, than earlier immigrants (see Table 2).
While just under half of the UK-born workforce left school at 16 or earlier, fewer than one in eight new immigrants – those who arrived in the last year – finished their education by the age of 16. Just over one in five UK-born members of the workforce finished education at 21 or later compared with more than 45% of all immigrants and more than 56% of all new immigrants. EU15 migrants are twice as likely to be graduates as the UK-born population. A8 migrants are also more likely to be graduates than UK-born, but most have intermediate levels of education.
Table 2: Education and immigrant status (working age population), 2013 Percentage of group with each level of education
Age finished education
UK-born All immigrants EU15 A8 New
immigrants
16 or under 44.9 19.7 21.8 13.5 11.9
17-20 32.0 34.9 31.0 55.7 31.8
21 or older 23.1 45.4 47.2 30.8 56.3
Source: LFS.
Education partly determines the occupations and industries in which an individual will work. There is a larger share of immigrants than UK-born working in professional occupations. But
7
there are more immigrants in processing and elementary occupations (such as cleaning and bar work) than might be expected given their qualifications (see Table 3). While EU15 migrants are concentrated in the professions, A8 migrants are concentrated in both skilled manual and elementary manual occupations.
This occupational mix in both high-skilled and less skilled jobs is reflected in the distribution of immigrants across industries. The health, hotel and restaurant sectors employ relatively more migrant workers than other sectors, particularly A8 migrants – who are also concentrated in manufacturing. EU15 migrants are concentrated in the finance sector. The energy and public administration sectors employ relatively fewer migrant workers (see Table 4).
Table 3: Occupational distribution of immigrants and UK-born, 2013 Percentage of UK-born Percentage of immigrants Percentage of EU15 immigrants Percentage of A8 immigrants Percentage of occupation who are immigrants Managerial 10.1 9.8 11.1 5.2 12.7 Professional 19.4 24.5 28.5 6.7 16.0 Assistant professional 14.3 12.2 16.4 4.9 11.3 Administrative 10.7 8.0 10.2 3.7 10.1 Skilled trades 11.1 8.7 6.4 15.9 10.4 Personal service 9.2 9.9 7.7 7.2 13.8 Sales 8.4 6.3 5.7 6.8 10.1 Processing 6.4 6.3 3.0 15.0 12.8 Elementary 10.5 14.3 10.9 34.7 16.9 Source: LFS.
Table 4: Industrial distribution of immigrants and UK-born, 2013
UK-born Immigrants EU15 A8 Percentage of industry who are immigrants Agriculture 1.0 0.8 0.9 2.6 9.4 Manufacturing 11.0 9.0 10.6 21.5 13.2 Energy 1.3 0.5 0.7 0.1 7.5 Construction 7.5 5.6 4.1 8.6 10.9 Retail 14.1 11.6 8.0 15.1 13.6 Hotels and restaurants 4.6 9.4 9.1 14.2 26.2 Transport 6.4 7.1 6.9 8.9 17.8 Finance 17.8 21.5 23.5 15.0 17.0 Public administration 6.4 4.5 4.7 1.0 8.4 Education 10.0 8.0 12.2 3.1 11.6 Health 13.1 15.9 11.8 6.2 15.6 Other 6.4 6.0 7.9 3.8 10.1 Source: LFS.
8 Where do immigrants settle?
While the stock of immigrants has risen in all regions over time, it rose most in London. Almost 40% of all immigrants now live in London. Although there is some evidence to suggest that new immigrants are more regionally dispersed than in the past, immigrants constituted more than one third of London’s population in 2013 (see Figure 3). A8 migrants are more regionally dispersed than other immigrants.
The geographical dispersion of immigrant share across local areas is much larger. Around 60% of the working age populations of Brent and Westminster were born overseas compared with less than 3% of the populations of Knowsley and Redcar & Cleveland. Figure 3: Immigrant share of a region’s population
0 .1 .2 .3 .4
Share of Area Population Rest of Northern regionWales
MerseysideStrathclyde Rest of West Midlands Rest of Yorks & HumbersideRest of North West Northern IrelandTyne & Wear Rest of ScotlandSouth West South YorkshireEast Anglia East Midlands Rest of South EastWest Yorkshire Greater Manchester West Midlands (met county)Outer London Inner London
Immigrants by Region
All Immigrants A8
Source: LFS.
Figure 4 compares the numbers of immigrants in each age group with the numbers of UK-born individuals in the same age group. Most immigrants to the UK arrive as young adults. Since the stock of UK immigrants is dominated by recent arrivals, with regard to the adult population there is clearly most population pressure among adults in their late twenties and early thirties, though this matters less if immigrants or native-born workers are substitutes across all age groups.
This age pattern also means that many immigrants are likely to be parents of young children. It is difficult to obtain information on numbers of children born to immigrant adults. The LFS suggests that in 2013, 30% of the 700,000 children under the age of 1 were born to a household whose head or partner was born overseas. In 1996 – a point at which immigration was static and so not dominated as much by new migrants – the equivalent share, of a similar number of newborns, was around 14%.
9
Figure 4: Numbers of immigrants by age group, 2013
0 200000 400000 600000 800000 1 .0 e + 0 6 N o . i n E a c h A g e C e ll 16 17 18 19 20 21 22 23 24 25 26 27 28 29 30 31 32 33 34 35 36 37 38 39 40 41 42 43 44 45 46 47 48 49 50 51 52 53 54 55 56 57 58 59
Age Distribution
Immigrant UK Born Source: LFSThe labour market costs and benefits of immigration
If the supply of labour rises, then we might expect this to put downward pressure on wages or jobs, in the absence of any offsetting changes in demand. Unlike in the United States, where the skill composition of immigrants is tilted towards the less skilled, the skill composition of immigrants to the UK is more biased towards skilled workers. It might be expected then that any pressure on wages or jobs would be among skilled workers in the UK, unless immigrants look for jobs that are not commensurate with their skills or it is harder to transfer certain acquired skills from one country to another. But if demand for labour is rising, there may be no effects of immigration on wages and employment. An open economy may also adjust by means other than wages: one such mechanism is adjustment by changing the mix of goods that the economy produces.
If labour demand exceeds labour supply in the receiving country, the impact of immigration will be different from that in a country already at full employment. Concerns about substitution and displacement of the UK-born workforce become more prevalent when output is demand-constrained, as in a recession or when capital is less mobile.
Empirical research on the labour market effects of immigration to the UK finds little evidence of overall adverse effects of immigration on wages and employment for people born in the UK. Most of these studies were carried out before the downturn, and there has been little new work since.
10
Nevertheless, there may be some downward pressure in the low wage labour market where (despite their higher relative education levels) many new immigrants tend to find work. There may also be a positive effect on wages in the high wage labour markets where it may take more time for the skills that immigrants bring to transfer.
The evidence from research shows that:
1) Immigrants and native-born workers are not close substitutes, on average (existing migrants are closer substitutes for new migrants). This means that native-born workers are, on average, cushioned from rises in supply caused by rising immigration (Manacorda et al, 2007).
2) The less skilled are closer substitutes for immigrants than the more highly skilled, so any pressures from increased competition from jobs is more likely to be found among less skilled workers (Manacorda et al, 2007). These effects appear to be borne out by other studies, but the effects are not large (Dustmann et al, 2013a; Nickell and Salaheen, 2008).
3) There is no evidence that EU migrants affect the labour market performance of native-born workers (Lemos and Portes, 2008; Goujard et al, 2011).
Figure 5: Immigrant share in new jobs
6 8 10 12 14 16 18 p e rc e n t 1985 1990 1995 2000 2005 2009 2013 year
Share in new Jobs Share in Working Age Population
Immigrant Share in Population & in New Jobs
Source: LFS.
Immigrants and new jobs
It is sometime said that immigrants account for a majority of all the new jobs generated. This is based on a misinterpretation of aggregate data. In times when the population is rising, the number of immigrants will grow alongside the numbers in employment (it would be just the same if the number of women in the population increased).
11
Figure 5 shows that the actual immigrant share in new jobs (the share of immigrants in jobs that have lasted less than three months) is – and always has been – broadly the same as the share of immigrants in the working age population. (It is a little higher partly because immigrants tend to be younger and job turnover is higher among the young.)
Figure 6 shows the lack of correlation between changes in the native-born youth unemployment rate and changes in the share of immigrants living in a local authority area between 2004 and 2010. Local authorities that experienced the largest rises in immigrants experienced smaller rises in youth unemployment.
Figure 6: Youth unemployment and changes in immigration, 2004-10
-. 0 5 0 .0 5 .1 .1 5 C h a n g e i n Y o u th U n e m p lo y m e n t R a te 2 0 0 4 -2 0 1 0 -.02 0 .02 .04 .06 .08 .1 .12
Change in Immigrant Share 2004-2010 actual value fitted value
Source: LFS.
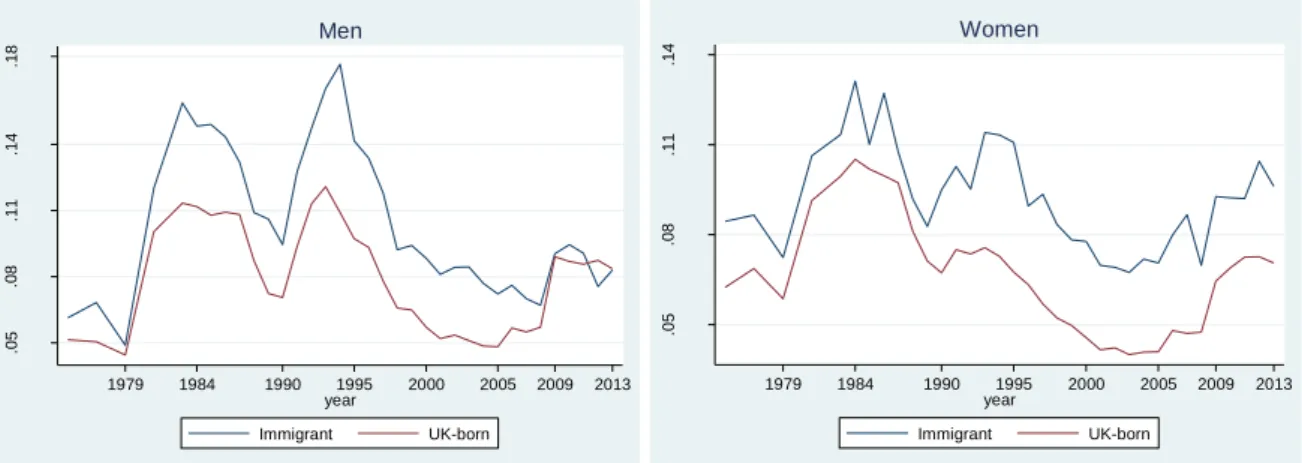
There is also now very little difference between the unemployment rates of immigrant and UK-born men. Historically, the employment gap has widened in recessions and narrowed in economic recoveries. This did not happen during the latest recession, particularly among men. Unemployment rates for immigrants and UK-born rose and then fell back by similar amounts (see Figure 7). Unemployment rates for female immigrants, however, remain higher than among UK-born women.
The higher average unemployment rate of immigrants in the past was explained in part by a relative lack of skills and the fact that many of them were employed in insecure jobs: anyone who is in this sort of job faces much higher risks of subsequent unemployment.
Changes in the skill mix of immigrants over time can explain the convergence in unemployment rates (though immigrants remain, on average, more likely to be unemployed given their qualifications). New immigrants cannot claim state benefits unless they are working or have paid sufficient contributions when in work.
Among women, there are much lower employment rates for some immigrant communities compared with UK-born women. Age and education can account for around one quarter of
12
these differences among women born in Pakistan and Bangladesh, but more research is needed to understand the reasons for these differences.
Figure 7: Unemployment for immigrants and UK-born men and women
.0 5 .0 8 .1 1 .1 4 .1 8 U n e m p lo y m e n t R a te 1979 1984 1990 1995 2000 2005 2009 2013 year Immigrant UK-born Men .0 5 .0 8 .1 1 .1 4 E m p lo y m e n t R a te 1979 1984 1990 1995 2000 2005 2009 2013 year Immigrant UK-born Women Source: LFS.
Other issues
The labour market is just one area in which rising immigration could have important effects, though there are many others, such as the public services like health (Wadsworth, 2013) or schools (Geay et al, 2013), housing (Battiston et al, 2013; Sa, 2011) and crime (Bell et al, 2013). We know much less about these issues than we do about the labour market, but there is the beginning of a UK research literature on these important issues and the interested reader can consult these references.
Broadly speaking, there is no evidence that immigration has large, harmful effects on any of these outcomes. On the public finances, immigrants, if they are younger and in work, tend to demand and use fewer public services and are more likely to contribute tax revenue (Dustmann et al, 2013b). This is particularly so for EU immigrants and recent arrivals from outside the EU.
Conclusions
During periods of strong economic growth, migration is and has always been important for filling gaps in the labour market. On balance, the evidence for the UK labour market suggests that fears about adverse consequences of rising immigration in general and EU immigration in particular have still not, on average, materialised. It is hard to find evidence of much displacement of UK workers or lower wages, on average. Immigrants, especially in recent years, tend to be younger and better educated than the UK-born and less likely to be unemployed.
But there have been some effects. The less skilled may have experienced greater downward pressure on wages and greater competition for jobs than others, but these effects still appear to have been small. Unfortunately, we do not know much about whether the effects of immigration are different in downturns. We also need to understand more about how capital and sectoral shifts in demand respond to immigration over the longer run.
13
Future migration trends will, as ever, depend on relative economic performance and opportunity. But we still need to know more about the effects of rising immigration beyond the labour market in such areas as prices, health, crime and welfare.
May 2014
For further information, contact:
Jonathan Wadsworth: j.wadsworth@lse.ac.uk
14
References
Battiston, D, D Dickens, A Manning and J Wadsworth (2013) ‘Immigration and the Access to Social Housing in the UK’, CEP Discussion Paper No. 1264
(http://cep.lse.ac.uk/pubs/download/dp1264.pdf).
Bell B, F Fasani and S Machin (2013) ‘Crime and Immigration: Evidence from Large Immigrant Waves’, Review of Economics and Statistics 95(4): 1278-90.
Dustmann, C, T Frattini and I Preston (2013a) ‘The Effect of Immigration along the Distribution of Wages’, Review of Economic Studies 80: 145-73.
Dustmann, C and T Frattini (2013b) ‘The Fiscal Effects of Immigration to the UK’, CReAM Discussion Paper No. 22/13.
Geay, C, S McNally and S Telhaj (2013) ‘Non-Native Speakers in the Classroom: What are
the Effects on Pupil Performance?’, Economic Journal 123: F281-307.
Goujard, A, B Petrongolo and J Van Reenen (2011) ‘The Labour Market for Young People’, in P Gregg and J Wadsworth (eds) The Labour Market in Winter, Oxford University Press. Lemos, S and J Portes (2008) ‘New Labour? The Impact of Migration from Central and Eastern European Countries on the UK Labour Market’, IZA Discussion Paper No. 3756, Institute for the Study of Labor, Bonn.
Manacorda,M, A Manning and J Wadsworth (2007) ‘The Impact of Immigration on the Structure of Male Wages: Theory and Evidence from Britain’, Journal of the European Economic Association 10: 120-51.
Nickell, S and J Salaheen (2008) ‘The Impact of Immigration on Occupational Wages: Evidence from Britain’, Federal Reserve Bank of Boston Working Paper No. 08-6. Sa, F, (2011) ‘Immigration and House Prices in the UK’, Economic Journal forthcoming, IZA Discussion Paper No. 5893, Institute for the Study of Labor, Bonn.
Wadsworth, J (2013) ‘Mustn’t Grumble: Immigration, Health and Health Service Use in the UK and Germany’, Fiscal Studies 34(1): 55-82
Further reading
Dustmann, C, F Fabbri and I Preston (2005) ‘The Impact of Immigration on the UK Labour Market’, Economic Journal 115: F324-41.
Schmitt, J and J Wadsworth (2008) ‘Changes in the Relative Economic Performance of Immigrants to Great Britain and the United States, 1980-2000’, British Journal of Industrial Relations.