MONETARY POLICY AND ECONOMIC GROWTH IN KENYA: THE ROLE OF MONEY SUPPLY AND INTEREST RATES
Enock Nyorekwa Twinoburyo Nicholas M. Odhiambo
Working Paper 11/2016 June 2016
Enock Nyorekwa Twinoburyo Department of Economics University of South Africa P. O. Box 392, UNISA 0003, Pretoria South Africa Email: etwinon@gmail.com Nicholas M. Odhiambo Department of Economics University of South Africa P. O. Box 392, UNISA 0003, Pretoria South Africa Email: odhianm@unisa.ac.za / nmbaya99@yahoo.com
UNISA Economic Research Working Papers constitute work in progress. They are papers that are under submission or are forthcoming elsewhere. They have not been peer-reviewed; neither have they been subjected to a scientific evaluation by an editorial team. The views expressed in this paper, as well as any errors, omissions or inaccurate information, are entirely those of the author(s). Comments or questions about this paper should be sent directly to the corresponding author.
©2016 by Enock Nyorekwa Twinoburyo and Nicholas M. Odhiambo
UNISA ECONOMIC RESEARCH
WORKING PAPER SERIES
Page | 2 MONETARY POLICY AND ECONOMIC GROWTH IN KENYA: THE ROLE OF
MONEY SUPPLY AND INTEREST RATES
Enock Nyorekwa Twinoburyo 1 and Nicholas M. Odhiambo
Abstract
Using the autoregressive distributed lag (ARDL) bounds testing approach; this paper examines the short-run and long-short-run impact of monetary policy on economic growth in Kenya for the period 1973 to 2013. The paper uses both the broad money supply and the 3-month Treasury bill rate as proxies of monetary policy. Both short-run and long-run empirical results support monetary policy neutrality, implying that monetary policy has no effect on economic growth – both in the short run and in the long run. This could be due to the fact that the increasing fiscal deficits funded domestically in Kenya could have weakened the transmission of monetary policy actions into the real economy. The study recommends that policies aimed at improving the institutional and regulatory environment for the financial sector and monetary policy conduct should be pursued in Kenya. There is also a need for improvement in policy coordination, particularly monetary and fiscal policies.
Key Words: Kenya, Money supply, interest rates and economic growth JEL Classification: E1, E43, E51 and E52.
1 Introduction
The dominance of output gaps in the last decade in most economies, particularly developed
economies, has heightened the debate on the role of monetary policy in addressing demand
deficiencies and economic growth, suggesting a growing consensus that monetary policy matters
1
Corresponding author: Enock Nyorekwa Twinoburyo, Department of Economics, University of South Africa (UNISA). Email address: etwinon@gmail.com
Page | 3 for economic growth (Woodford, 2007; White, 2013). However, the relative importance of
money supply and interest rate based monetary policy on economic growth remains varied across
both the theoretical and empirical literature (see, among others, Arestis, 2009; Asongu, 2014).
Monetarist theory emphasises the role of money, while the Keynesian, post-monetarist, New
Classical, New Keynesian and New Consensus models – emphasise the role of interest rates
(Arestis, 2009). The New Consensus model, for example, is premised on short-term interest rates
as the sole monetary policy instrument for short-run output stabilisation (Arestis, 2009).
Long-run monetary policy neutrality on output is predominantly traced across the evolution of
monetary policy and output theories (Palley, 2007).
Monetary policy in practice has also been varied and so are the respective empirical findings,
revealing mixed results on the impact of monetary policy on economic growth (Asongu, 2014).
Relevant empirical studies have largely focused on developed economies and the few that
examined developing economies have centred on the impact of money supply on economic
growth (Mishra et al., 2012; Davoodi et al., 2013 and Asongu, 2014). The studies that support a
positive impact of monetary policy on economic growth include inter alia Khabo and Harmse
(2005), Rafiq and Mallick (2008), Jawaid et al. (2011), Nouri and Samimi (2011), Onyiewu
(2012), Vinayagathasan (2013), and Havi and Enu (2014). Studies that find limited or no impact
of monetary policy on economic growth include Lashkary and Kashani (2011), Coibion (2011),
Page | 4 Other studies reveal differing results, depending on the choice of monetary policy variable.
Fasanya et al. (2013) found a long-run impact of monetary policy instruments (external reserve
and exchange rate) on economic growth in Nigeria in accordance with theoretical expectations,
but found money supply to be insignificant. Mugume (2011) also found an expected negative
impact on economic growth using the 3-month Treasury bill (T-bill) rate as a proxy of monetary
policy, and a statistically insignificant effect on output when broad money (M2) was used as the
monetary policy variable. Also, Chaudhry et al. (2012) found that call money was insignificant
in the short run but positively significant in the long run, suggesting short-run neutrality.
Long-run monetary policy (money supply) neutrality is backed by several empirical studies (Bernanke
and Mihov, 1998; Bullard, 1999; Nogueira, 2009; Asongu, 2014). A number of other studies
revealed inconsistent results for the theoretical postulations (Amarasekara, 2009;
Vinayagathasan, 2013).
The empirical evidence remains ambiguous, and seemingly dependent on country characteristics,
the choice of monetary policy variables used and methodology (Walsh, 2003; Berg et al., 2013).
Most studies on this subject have relied on Vector Auto Regressive (VAR) methodology, where
results depend on the restrictions imposed, and this may have limitations, particularly for
developing economies (Ivrendi and Guloglu, 2010, Grace Li et al., 2013). In addition, a number
of other factors explain the strength and dependability of the relationship between monetary
policy instruments and economic growth. Overall the financial structure of the economy matters
for monetary policy transmission in the economy (Mishra et al., 2012; Opolot et al., 2013). The
Page | 5 size, composition and competition within the financial sector, the level of financial innovations,
degree of financial integration with the international markets and the exchange rate regime. The
institutional and regulatory environment, including the operational and institutional
independence of the Central Bank, also matter.
The main aim of this paper is investigate the short-run and long-run impact of monetary policy
(broad money supply and 3 month Treasury bill rate) on economic growth in Kenya. The paper
also employs the Auto Regressive Distributive Lag (ARDL) estimation, which has pronounced
advantages for small samples like the one employed in this study. To our knowledge, this could
be the first time ARDL has been used to examine the impact of monetary policy on economic
growth in Kenya.
The remainder of the paper is structured as follows: Section 2 presents the overview of Kenya’s economic and financial structure. The estimation methodology and the empirical results are
presented in Section 3 and 4 respectively. The conclusions are presented in Section 5.
2 Overview of Kenya’s economic and financial structure
Despite attaining independence in 1963, Kenya only recently attained lower middle income
status with a GDP per capita of USD 1358.3 in 2014, remaining the largest economy in the East
African region (World Bank, 2015). Kenya’s monetary policy formulation and implementation has been coordinated by the Central Bank of Kenya, after its establishment according to the
Page | 6 Currency Board (EACB)2 that also served Uganda and Tanzania. Monetary policy conduct has since endured three major episodes: from 1966 to 1993, 1993 to 2011 and 2011 to date. The first
episode was characterised by direct measures in the form of credit restrictions, fixed cash ratio,
and liquid asset ratios, as well as the setting of minimum deposit and maximum lending rates.
Fiscal dominance prevailed for most of the 1970s. The fixed exchange rate regime prevailed
until the early 1980s, when the crawling peg exchange rate system anchored to a basket of
currencies was adopted (Kinyua, 2001).
The 1993 to 2011 epoch consisted of the full liberalisation of key markets including the
exchange rate market in October 1993; the complete removal of quantitative controls on the
capital account in 1995; and the amendment of the Central Bank of Kenya Act in 1997,
espousing its monetary autonomy. The amendment of the Act also mandated the Central Bank of
Kenya (CBK) to shift from targeting broad money (M3) to targeting broader money M3X and
MXT3 as the intermediate target. However, the actual transition to broader aggregates happened in 1998 (Kinyua, 2001). The monetary targeting regime remained in place until September 2011,
when the CBK adopted short-term interest rates as the main operational target, while retaining
the monetary targeting framework. The Central Bank Rate (CBR) which is set and announced
monthly by CBK’s monetary policy committee is used as the reference rate for pricing monetary policy operations (Andrle et al., 2013). A number of other monetary instruments, including open
2 Formed in 1919, its offices were based in London and the East African shilling was pegged against the British pound. Its offices were transferred to Nairobi in 1960.
3
M3 is defined as currency in circulation and term and non-term domestic deposits held with banks and NBFIs. M3X is M3 plus foreign currency deposits (FCDs) held by residents, whereas M3XT is M3X plus holdings of government paper by the non-bank public.
Page | 7 market operations (OMO), standing facilities (as a lender of last resort), required reserves,
foreign market operations, licensing and supervision of commercial banks, and communication
of bank decisions, are used to achieve the monetary policy stance (Andrle et al., 2013).
Kenya operates a flexible free floating exchange rate regime, with limited CBK interventions in
the foreign exchange market. These are conducted through auctions or through direct
interventions in the dealing system, under which the market is informed, but amounts and rates
are not published. The average rate through auctioning is, however, published after the auction
closes (Berg et al., 2013). The capital account of balance of payments has since 1995 remained
open with no quantitative capital controls. The Chinn and Ito (2008) index and de jure openness
index of capital and financial accounts shown in Figure 1 corroborate Kenya’s higher level of financial integration, with a higher index value corresponding to fewer restrictions in
international transactions.
Figure 1: Chinn-Ito Financial Openness Index (1997-2011)
Source: Chinn and Ito (2015)
-2.5 -2 -1.5 -1 -0.5 0 0.5 1 1.5 2 2.5 3 1997 1998 1999 2000 2001 2002 2003 2004 2005 2006 2007 2008 2009 2010 2011
Page | 8 The CBK Act was amended again in 2012 to provide enhanced transparency of its operations
(Kinyua, 2001). The increased CBK monetary autonomy is corroborated by Dincer and
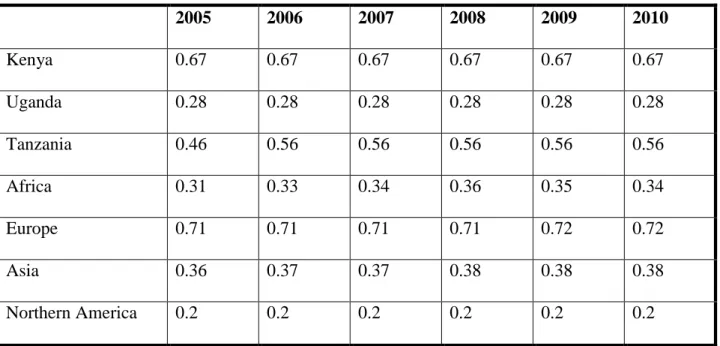
Eichengreen (2013)4 measure of Central independence, the Central Bank Independence Weighted (CBIW). As shown in Table 1, Kenya exhibits a higher degree of central bank
independence compared to its regional counterparts and its level is comparable to a number of
countries in Europe, a region which has the most independent central banks according to this
measure.
Table 1: Central Bank Independence Index Weighted (CBIW)
2005 2006 2007 2008 2009 2010 Kenya 0.67 0.67 0.67 0.67 0.67 0.67 Uganda 0.28 0.28 0.28 0.28 0.28 0.28 Tanzania 0.46 0.56 0.56 0.56 0.56 0.56 Africa 0.31 0.33 0.34 0.36 0.35 0.34 Europe 0.71 0.71 0.71 0.71 0.72 0.72 Asia 0.36 0.37 0.37 0.38 0.38 0.38 Northern America 0.2 0.2 0.2 0.2 0.2 0.2
However, pronounced fiscal expansion in the form of large fiscal deficits funded from the
domestic markets runs the risk of fiscal dominance and crowding out of monetary policy, thus
reducing its effectiveness (IMF, 2016).
Page | 9 CBK is also responsible for the overall functioning and supervision of the financial system. By
the end of 2013, the Kenyan financial system comprised 43 commercial banks, 1 mortgage
finance company, 9 representative offices of foreign banks, 9 deposit-taking microfinance
institutions, 112 foreign exchange bureaus and 2 credit reference bureaus (CBK, 2013). The
insurance sector included 154 insurance brokers, 23 medical insurance providers and 4205
insurance agents. The commercial banking sector continues to denominate the financial sector.
At the end of 2012, the assets of the pension sector, microfinance banks and insurance sector
accounted for just 38% of the total commercial banking sector (KIPPRA, 2013). The six largest
banks accounted for 51.4% of the commercial bank assets, 50.2% of the customer deposits and
61.8% of the pre-tax profits, and had a market share of 52.39% (CBK, 2013).
Kenya’s financial sector has undergone rapid financial innovation over the last decade, exhibited in part by mobile money transactions, the number of transactions growing to about 65 million
between March 2007 and August 2013 (Nyamwogo and Ndirangu, 2013). Over the
corresponding period, the number of adults using mobile phone financial services (11.5 million)
was more than double the 5.4 million using banks (FinAccess, 2013). The number of ATMs
increased from 540 in 2006 to 2487 in December 2013 (CBK, 2013). The heightened innovation
in the financial sector increased the velocity of money and instability of money demand at the
risk of compromising the monetary policy effectiveness, in particular the monetary targeting
Page | 10 3 Estimation methodology
3.1 The ARDL Bounds Testing Approach
This paper adopts the Autoregressive Distributed Lag (ARDL) approach to co-integration
developed by Pesaran and Shin (1998) and later refined by Pesaran et al. (2001). Unlike other
co-integration techniques, ARDL permits a co-integration relation to exist, whether the
underlying variables are I(1), or a combination of both I(1) and I(0). It also provides relatively
robust results for small samples. The ARDL approach works well, even when the model has
endogenous regressors, without posing the problems associated with serial correlation and
endogeneity (Odhiambo, 2009). It also incorporates an adequate number of lags to capture the
data generating process from general-to-specific modelling framework (Shrestha and
Chowdhury, 2005). The ARDL approach allows for the appropriate lag selections (Pesaran and
Shin, 1999).
The empirical model used in this study to test the impact of monetary policy on economic growth
is underpinned by Levine and Renelt (1992) and the aggregate production framework used by
Fosu and Magnus (2006). The modified model used in this study is expressed in an ARDL
Page | 11 ∑ ∑ ∑ ∑ ∑ ∑ ∑
Where RGDP is the real gross domestic product- a proxy for economic growth. Two monetary
policy variables, real money supply and real short term interest rates, are represented by and TBIL respectively. The other control variables are real exchange rate , real gross fixed capital formation trade openness and the real commodity price index . , and are respectively natural logarithms, the white-noise error term, the short-run coefficients and the long-run coefficients of the model. is the first difference operator, t denotes time period, and n is the maximum number of lags in the model.
Monetary policy is concerned with changes in the supply of money and short-term interest rates
in a bid to attain the set out objectives. The key monetary policy variables used in many studies
are money supply and short term interest rates – the latter largely for developing economies. This
study adopts both on the grounds of extensive use in empirical studies (Christiano et al., 1999;
Page | 12 circulation to domestic currency deposits and has been extensively used in empirical estimations
founded on the monetarist school of thought (Maturu et al., 2010). Money supply is expected to
have a positive impact on economic growth. Short-run interest rates are measured by the 3 month
Treasury bill rate, also backed by empirical applications and the Keynesian and New Keynesian
theories (Clarida et al., 1999). Short-run interest rates are expected to exert a negative effect on
GDP.
Gross fixed capital formation (GFCF) is included as a measure of capital stock and is expected to
have a positive and significant relationship with economic growth (Havi and Enu, 2014). Stable
inflation is recognised as an integral component of monetary policy in Kenya and is measured by
CPI. The coefficient of the term representing the rate of inflation is expected to be negative (see,
among others, Khan and Senhadji 2001; Pollin and Zhu 2006; Yilmazkuday, 2013).
The exchange rate measured by the real exchange rate is included as a proxy for a country's
external competitiveness, in particular for the small open economies under study. An increase in
the RER is expected to have a positive impact on economic growth (Rodrik, 2008; Haddad and
Pancaro, 2010).
This study used the sum of exports and imports to GDP ratio as a proxy for trade openness.
Trade openness is broadly considered as an engine of economic growth in the literature and the
coefficient is expected to be positive (Sachs and Warner 1995, Rodríguez and Rodrik, 2001;
Page | 13 The bounds testing procedure is carried out by conducting the F-test for the joint significance of
coefficients of the lagged variables. The null hypothesis of no co-integration is tested against the
alternative hypothesis of co-integration in Eq. 1. Two sets of critical values have been
constructed by Pesaran et al. (2001) under this null hypothesis. The first set of critical values are
constructed under the assumption that variables in the ARDL model are integrated of order zero,
I(0). The second set of critical values are constructed under the assumption that variables in the
model are integrated of order one, I(1). The null hypothesis of no co-integration relationships is
not rejected when the F-statistic falls below the lower-bound values. The null hypothesis of no
co-integration is rejected when the calculated F-statistic is greater than the upper-bound values.
However, the test is inconclusive when the F-statistic falls between the lower and upper bounds.
Akaike Information Criteria (AIC) and Schwartz- Bayesian Criteria (SBC) are used for the
ARDL model lag length selection (Pesaran and Shin, 1997).
The corresponding error correction model is presented in Eq. (2) as:
∑ ∑ ∑ ∑ ∑ ∑ ∑
Page | 14 where is the coefficient of the error-correction term, . is expected to be negative, statistically significant and between zero and one. The ECM measures the short-run speed of
adjustment towards the long-run equilibrium path of the estimated model.
3.2 Data Sources
This study utilises annual time series data covering the 1973 to 2013 period. The data was
obtained from different sources. The gross fixed capital formation, sum of exports and imports,
real exchange rate, consumer price index and real GDP were obtained from the World Bank
Development Indicators (2015). The Treasury bill rate was obtained from International Financial
Statistics, while money supply was obtained from the Central Bank of Kenya
4 Empirical Estimation and Results
4.1 Stationarity Results
Time series data must be tested for stationarity before running ARDL co-integration tests to
determine their order of integration. The presence of I(2) variables renders the ARDL
inappropriate (Ouattara, 2004). This study employs both the Phillips-Perron test following
Phillips and Perron (1988) and the Dickey-Fuller generalised least square (DF-GLS) test for
autoregressive unit root recommended by Elliot et al (1996). The DF-GLS test has the best
overall performance in terms of sample size and power over the traditional Augmented Dickey
Fuller and also has substantially improved power when an unknown mean or trend is present
Page | 15 when conducting unit roots, all variables except real Treasury bill rate are trend stationary and
should include both intercept and trend (see Appendix A). The unit root test results for all
variables in levels and first difference are presented in Tables 2 and 3.
Table 2: Dickey- Fuller Generalised Least Squares (DF-GLS)
Variables Stationarity of variables in
Levels
Stationarity of variables in first
differences
Status
No trend With trend No trend With trend I(d)
LRGDP - -1.658 - -3.220** I(1) RTBIL -2.409** - - I(0) LM2 - -3.097* - - I(0) LRER - -0.849 - 6.271*** I(1) LCPI - -2.231 - -3.908*** I(1) LRGFCF - 3.001* - - I(0) LTOP - -3.891*** - - I(0)
Note: *, ** and *** denote the rejection of the null hypothesis of unit root at the 10%, 5% and 1% significance levels respectively.
Page | 16 Table 3: Phillips-Perron (PP) Unit Root Test
Variables Stationarity of variables in
levels
Stationarity of variables in first
differences
Status
No trend With Trend No trend With Trend I(d)
LRGDP - -3.162 - -5.463*** I(1) RTBIL -3.666*** - - - I(0) LRM2 - -2.939 - -9.269*** I(1) LRER - -0.693 - -6.191*** I(1) LCPI - -1.626 - -4.081** I(1) LRGFCF - -1.882 - -7.598*** I(1) LTOP - -3874** - - I(0)
Note: *, ** and *** denote the rejection of the null hypothesis of unit root at the 10%, 5% and
1% significance levels respectively.
The unit root test results reported in Tables 2 and 3 reveal that all variables are integrated of
order zero or one, supporting the application of the ARDL bounds testing approach to
cointegration in this study. The results of the ARDL bounds testing approach to co-integration
Page | 17 Table 4: ARDL Bounds Test Results
Dependent Variable Function F-test Statistics
LRGDP F(LRGDP|LRM2, RTBIL, LGFCF, LTOP, LRER,
LCPI)
5. 863***
Asymptotic Critical Values
Pesaran et al. (2001), p.300. Table CI(III) Case III
1% 5% 10%
I(0) I(1) I(0) I(1) I(0) I(1)
2.12 3.23 2.45 3.61 3.15 4.43
Note: *** denotes significance at the 1% level
Since the computed F-value of 5.863 exceeds the upper bound critical value of 4.430 at the 1 per
cent level of significance, we cannot reject the existence of a stable long-run (level) relationship
among the variables (LRGDP, LRM2, RTBIL, LGFCF , LTOP, LRER and LCPI), confirming
that the variables are co-integrated.
The optimal lag for both the long-run and short-run ARDL models is selected based on Schwartz
Bayesian criteria because the respective models were more parsimonious than Akaike
information criteria. The model estimated is ARDL (1, 0, 0, 1, 0, 0, 2).
The long-run results are reported in panel A of Table 5, while the short-run dynamics are
Page | 18 Table 5: Results of ARDL Model
Panel A: Long-run coefficients – (dependent variable – RGDP
Regressor Coefficient Standard Error T-Ratio Probability
C 6.229*** 1.083 5.754 0.000 LRM2 0.083 0.105 0.793 0.434 RTBIL 0.113 0.651 0.173 0.864 LGFCF 0.349*** 0.067 5.143 0.000 LTOP -0.264*** 0.081 -3.275 0.003 LRER -0.071 0.053 -1.356 0.185 LCPI 0.059*** 0.018 3.237 0.003
Panel B: Short-run coefficients (dependent variable – ΔRGDP)
ΔLRM2 0.068 0.086 0.790 0.436 ΔRTBIL 0.923 0.528 0.175 0.862 ΔLGFCF 0.285*** 0.064 4.488 0.000 ΔLTOP -0.215*** 0.077 -2.786 0.009 ΔLRER 0.083 0.090 0.927 0.361 ΔLCPI -0.089 0.13 -6.85 0.498 ΔLCPI(1) -0.422*** 0.118 -3.584 0.001 ecm(-1) -0.817*** 0.099 -8.273 0.000 R-Squared 0.843 R-Bar-Squared 0.791 SE of Regression 0.015 F-Stat F(8,32) 20.118
Residual Sum of Squares 0.007 DW statistic 2.263
Akaike Info. Criterion 109.164 Schwarz Bayesian Criterion 99.739
Note: *** denotes significance at the 1% level
The results from both short-run and long-run analysis reveal that the coefficients of monetary
policy measured by the 3 month Treasury bill rate and broad money M2 are statistically
insignificant. The results suggest both short-run and long-run money supply and short-term
interest monetary policy neutrality. This is corroborated by similar findings on Kenya by
Page | 19 monetary policy had no statistically significant effect on real output in Kenya. Long-run money
supply monetary policy neutrality is found in other previous studies (see, among others,
Bernanke and Mihov, 1998; Bullard, 1999; Nogueira, 2009; Asongu, 2014). Similarly, the
short-run money supply neutrality is traceable in studies by Fasanya et al. (2013) and Chaudhry et al.
(2012).
The insignificant impact of monetary policy on economic growth could be explained by the
fiscal prominence and nature of the financial structure, characterised by a low level of
development, banking sector dominance of the financial sector and the oligopolistic nature of the
banking industry. Fiscal policy characterised by large and rising fiscal deficits in some instances
has been found not to be coordinated with monetary policy, with a risk of compromising the
monetary autonomy (Morekwa et al., IMF, 2016). The results could also be attributed to the
weak structural, institutional and regulatory framework (Mutuku and Koech, 2014). The
volatility of the money multiplier, in part explained by rapid financial innovations, suggests the
likelihood of prediction errors of output, velocity of money, and inflation, at the risk of
undermining the reserve money targeting (Adam et al., 2010; Nyamongo and Ndirangu 2013).
The other long-run results show that the coefficients of real gross fixed capital formation and
consumer price index are positive and statistically significant, suggesting a positive impact on
economic growth. However, the coefficient of trade openness is negative and statistically
significant. The coefficient of real exchange rate is found to be statistically insignificant.
The other short-run results reveal that the coefficient of real gross fixed capital formation is
positive and statistically significant. The result for trade openness is consistent with the long-run
Page | 20 the consumer price index is found to have no impact but the coefficient of its lag is found to have
a negative and statistically significant impact on economic growth in Kenya.
The coefficient of the error correction term of -0.817 is highly significant, corroborating both the
quick convergence of the real GDP equation to its long run equilibrium (corrected in the next
period/year) and the presence of co-integration (Banerjee et al., 1998).
The short-run model passes all diagnostic tests against heteroscedasticity, normality, serial
correlation and functional form, as reported in Table 6. The regression for the underlying ARDL
model fits well, with an R-squared of 84.3%. The CUSUM and CUSUMQ presented in Figures
2 and 3 lie within the critical bounds at a 5 per cent confidence interval, confirming the stability
of the model.
Table 6: ARDL-VECM Model Diagnostic Tests
LM Test Statistics Results
Serial Correlation*CHSQ(1) 1.908(0.167)
Functional Form *CHSQ(1) 0.955 (0.329)
Normality *CHSQ(2) 1.014 (0.602)
Page | 21 Figure 2: CUSUM Figure 3: CUSUMQ -20 -10 0 10 20 1973 1983 1993 2003 2013
The straight lines represent critical bounds at 5% significance level Plot of C umulative Sum of Recursive R esiduals
-0.4 -0.2 0.0 0.2 0.4 0.6 0.8 1.0 1.2 1.4 1973 1983 1993 2003 2013
The straight lines represent critical bounds at 5% significance level Plot of C umulative Sum of Squa res of Recursive R esidua ls
Page | 22 5 Conclusion
There is growing consensus that monetary policy matters for growth, at least in the short run.
The relative importance of price-based (short term interest rates) and quantity-based (money
supply) monetary policy remains ambiguous. Kenya uses short-term interest rates as the
operational target in a monetary targeting regime. Using the Auto Regressive Distributive Lag
(ARDL) bounds testing approach, this study examines the short-run and long-run impact of
monetary policy on economic growth in Kenya during the period from 1973 to 2013. The study
also adopts broad money supply (M2) and the 3 month Treasury bill rate as monetary policy
variables. Both short-run and long-run empirical results suggest monetary policy neutrality in
Kenya, implying that monetary policy has no effect on economic growth, both in the short run
and in the long run. The outcome may be explained by the fact that the bulk of the fiscal deficits
are funded domestically. This may have weakened the transmission of monetary policy into the
economy. Overall, the study recommends that policies aimed at improving the institutional and
regulatory environment for the financial sector and monetary policy conduct are warranted.
Page | 23 References
Adam, C., Maturu, B., Ndung'u, N., and O'Connell, S. (2010). Building a Monetary Regime for
the 21st Century. In C. Adam, P. Collier, and N. Ndung'u (Eds.), Kenya: Policies for Prosperity.
Oxford: Oxford University Press.
Adefeso, H. A. and Mobolaji, H. I. (2010). The fiscal-monetary policy and economic growth in
Nigeria: Pakistan Journals of social sciences, 7, (2), 137-142.
Amarasekara, C. (2009). The impact of monetary policy on economic growth and inflation in Sri
Lanka. Central Bank of Sri Lanka Staff Studies, 38, 1-44.
Andrle, M. A., Berg, A., Berkes, E., Morales, R., Portillo, R.,Vavra, D., and Vleck, J. (2013).
Forecasting and Policy Analysis Systems in Low Income Countries: The role of money targeting
in Kenya, International Monetary Fund Working Paper, 239, Washington, D.C.
Arestis, P. (2009). New Consensus in Macroeconomics: A critical appraisal. University of
Cambridge.
Asongu, S. A. (2014). A note on the long-run neutrality of monetary policy: New empirics.
European Economics Letters, 3, (1), 1-6.
Bannerjee, A., Dolado, J. and Mestre, R. (1998). Error correction Mechanism Tests for
cointegration in single equation framework. Journal of Time Series Analysis, 19 (3), 267-283.
Berg, A., Charry, L., Portillo, R. and Vlcek, J. (2013). The monetary transmission mechanism in
the Tropics: A Narrative Approach. International Monetary Fund Working Paper, 197.
Page | 24 Bernanke, B. S and Mihov, I. (1998). Measuring monetary policy. The Quarterly Journal of
Economics, 113, (3), August.
Bullard, J. (1999). Testing long-run neutrality propositions: Lessons from the recent research.
Federal Reserve Bank of St. Louis Review, 81, (6), 57-78.
Central Bank of Kenya (2013). Annual Financial stability report, June. Available at:
https://www.centralbank.go.ke/index.php/news/378-financial-2013-report.
Central Bank of Kenya (2013). Annual report. Available at:
https://www.centralbank.go.ke/index.php/cbk-annualreports.
Central Bank of Kenya (2013). Annual supervision report. Available at:
https://www.centralbank.go.ke/index.php/bank-supervision-reports.
Chaudhry, I.S., Qamber, Y. and Farooq, F. (2012). Monetary policy, inflation and economic
growth in Pakistan: Exploring the co-integration and causality relationships. Pakistan Journal of
Commerce and Social Science, 6, (2), 332-347.
Chinn, M. and Ito, H. (2015). The Chinn-Ito Index– A de jure measure of financial openness.
Available at: http://web.pdx.edu/~ito/Chinn-Ito_website.htm
Christiano, L., Eichenbaum, M. and Evans, C. (1999). Monetary policy shocks: what have we
learned and to what end? In Handbook of Macroeconomics, ed. by J. Taylor,and M. Woodfoord.
North Holland.
Clarida, R. Gali J. and Gertler, M. (1999). Monetary policy rules and macroeconomic stability:
Page | 25 Clarida, R. Gali J. and Gertler, M. (2001). Optimal monetary policy in open versus closed
Economies: An Integrated Approach. American Economic Review, 91(2). 248-252.
Coibion, O. (2011). Are the effects of monetary policy shocks big or small? NBER Working
Paper, 17034. Cambridge, M.A.
Davoodi, H., Dixit, S. and Pinter, G. (2013). Monetary transmission mechanism in the East
African Community: An empirical investigation. International Monetary Fund Working Paper,
39.
Elliott, G., Rothenberg, T. J. and Stock, J. H. (1996). Efficient tests for an autoregressive unit
root. Econometrica, 64, 813-36.
Fasanya, I. O., Onakoya, A. B. O. and Agboluaje, M. A. (2013). Does monetary policy influence
economic growth in Nigeria? Asian Economic and Financial Review, 3, (5).
FinAccess (2013). Profiling developments in financial access and usage in Kenya. Available at :
http://fsdkenya.org/wp-content/uploads/2015/08/13-10-31_FinAccess_2013_Report.pdf
Fosu, E .O. A and Magnus, F. J. (2006). Bounds testing approach to cointegration: An
examination of foreign direct investment trade and growth relationships. American Journal of
Applied Sciences, 3(11), 2079-2085.
Grace Li, B., O’Connell, S., Adam, C., Berg, A., and Montiel, P. (2013). VAR meets DSGE: Uncovering the Monetary Transmission Mechanism in Low-Income Countries. Unpublished
Page | 26 Haddad, M and Pancaro, M. (2010). Can Real Exchange Rate Undervaluation Boost Exports and
Growth in Developing Countries? Yes, But Not for Long. Economic Premise 20, World Bank
PREM Network, June.
Havi, E. D. K. and Enu, P. (2014). The effect of fiscal policy and monetary policy on Ghana’s
economic growth: which policy is more potent? International Journal of Empirical Finance, 3,
(2), 61-75.
Hayashi, F. (2000). Econometrics. Princeton University Press, Princeton and Oxford.
International Monetary Fund. (2016), Regional Economic Outlook: Sub-Saharan Africa.
Washington D.C. April.
Ivrendi, M. and Yildirim, Z. (2013). Monetary policy shocks and macroeconomic variables:
evidence from fast growing emerging economies. Economics Discussion Papers, 61, Kiel
Institute for the World Economy.
Jawaid, S. T., Quadri, F. S., and Ali, N. (2011). Monetary-fiscal-trade policy and economic
growth in Pakistan: Time Series Empirical Investigation. International Journal of Economics
and Financial Issues, 1, (3), 133-138.
Kahn, M. S., and Senhadji, A. S. (2001). Threshold effects in the relationship between inflation
and growth. International Monetary Fund Staff Papers, 48 (1), 1-21.
Kamaan, C, K. (2014). The effect of monetary policy on economic growth in Kenya.
Page | 27 Kenya Institute for Public Policy Research and Analysis (KIPPRA). (2013), Kenya Economic
Report: Creating an Enabling Environment for Stimulating Investment for Competitive and
Sustainable Counties.
Khabo, V. and Harmse, C. (2005). The impact of monetary policy on economic growth of a
small open economy: the case of South Africa. SAJEMS NS, 8(3).
Kinyua, J. K (2001). Monetary Policy in Kenya: Evolution and current framework, Central Bank
of Kenya.
Lashkary, M .and Kashani, H. B. (2011). The impact of monetary variables on economic growth
in Iran: A Monetarists’ Approach. World Applied Sciences Journal, 15, (3), 449-456.
Levine, R. and Renelt, D. (1992). A sensitivity analysis of cross-country growth regressions.
American Economics Review 82 (4): 942-63.
Maturu, B., Maana, I. and Kisinguh, K. (2010). Monetary policy transmission mechanism in
Kenya: a VAR Approach. Central Bank of Kenya working paper.
Mishra, P., Montiel, P., and Spilimbergo, A. (2012). Monetary transmission in Low-Income
Countries: Effectiveness and policy implications. International Monetary Fund Economic
Review (60), 270-302.
Mishra, P., and Montiel, P. (2012). How effective is Monetary Transmission in Low Income
Countries? A Survey of the Empirical Evidence. International Monetary Fund Working Paper,
Page | 28 Monteil, P., Adam, C., Mbowe, W., and O’Conell, S. (2012). Financial architecture and the monetary transmission mechanism in Tanzania. CSAE Working Paper, 03.
Morekwa E. Nyamongo, Moses M.sichei and Nahanson K.Mutai (---) The monetary and fiscal
policy interactions in Kenya; Research department, Central Bank of Kenya. Available at:
Mugume, A. (2011). Monetary transmission mechanisms in Uganda. Bank of Uganda Working
Paper. Available at: http://www.bou.or.ug/bou/home.html
Nogueira, R. P. (2009). Is monetary policy really neutral in the long-run? Evidence for some
emerging and developed economies. Economics Bulletin, 9(3), 2432- 2437.
Nyamongo, E and Ndirangu, L. (2013). Financial Innovations and Monetary Policy in Kenya.
MPRA, 52387.
Obstfeld, M. and Taylor, A. M. (2003). Globalization and Capital Markets. NBER Chapters,
121-188, NBER.
Odhiambo, N.M. (2009). Energy Consumption and economic growth nexus in Tanzania: An
ARDL bounds testing approach. Energy Policy, 37, 617-622.
Onyeiwu, C. (2012). Monetary policy and economic growth of Nigeria. Journal of Economics
and Sustainable Development, 3(7).
Ouattara, B. (2004). Foreign aid and fiscal policy in Senegal. Mimeo University of Manchester.
Palley T. I. (2007). Macroeconomics and monetary policy: Competing theoretical frameworks.
Page | 29 Pesaran, M. H. and Shin, Y. (1999). An autoregressive distributed lag modelling approach to
cointegration analysis, in Econometrics and Economic Theory in the 20th Century: The Ragnar
Frisch Centennial Symposium, Storm, S. (Ed.), Cambridge University Press, Chapter 11, 1–31.
Pesaran, M. H., Shin, Y. and Smith, R. (2001). Bound testing approaches to the analysis of level
relationship. Journal of Applied Econometrics, 16, (3), 174–189.
Pollin, R. and Zhu, A. (2006). Inflation and economic growth: A cross-country nonlinear
analysis. Journal of Post Keynesian Economics 28 (4), 593-614.
Rafiq, S. M. and Mallick, K. S. (2008). The effect of monetary policy on output in EMU3. A sign restriction approach. Journal of Macroeconomics, 30, 1756–1791
Rodríguez, F. R. and Rodrik, D. (2001). Trade policy and economic growth: A skeptic's guide to
the cross-national evidence. NBER Macroeconomics Annual, 15: 261- 338.
Rodrik, D. (2008). The Real Exchange Rate and Economic Growth. Brookings Papers on
Economic Activity, 39 (2), 365–439.
Sachs, J. and Warner, A. (1995). Economic reform and the process of global integration.
Brookings Papers on Economic Activity, 1, 1-117.
Sakyi, D. (2011). Trade openness, foreign aid and economic growth in post-liberalization Ghana:
An application of ARDL Bounds Test. Journal of Economics and International Finance 3(3),
146-156.
Vinayagathasan, T. (2013). Monetary policy and the real economy: A Structural VAR Approach
Page | 30 Walsh, C. E. (2003). Monetary Theory and Policy. The MIT Press, Second Edition.
White, W. R. (2013). Is Monetary Policy a Science? The Interaction of Theory and Practice over
the Last 50 Years. Federal Reserve Bank of Dallas, Globalization and Monetary Policy Institute
Working Paper ,155. September.
Woodford, M. (2007). The case of forecast targeting as monetary policy strategy. Journal of
economic perspectives, 21, (4), 3-24.
World Bank. (2015). World Development Indicators 2015.
Yilmazkuday, H. (2013). Inflation thresholds and growth. International Economic Journal, 27,
Page | 31 Appendix A: Graphical expositions of the time series variable data
-0.5 0.0 0.5 1.0 1.5 2.0 2.5 1975 1980 1985 1990 1995 2000 2005 2010 LCPI 9.4 9.5 9.6 9.7 9.8 9.9 1975 1980 1985 1990 1995 2000 2005 2010 LGFCF 9.6 9.7 9.8 9.9 10.0 10.1 10.2 1975 1980 1985 1990 1995 2000 2005 2010 LM2 1.8 1.9 2.0 2.1 2.2 2.3 2.4 1975 1980 1985 1990 1995 2000 2005 2010 LRER 9.6 9.8 10.0 10.2 10.4 10.6 1975 1980 1985 1990 1995 2000 2005 2010 LRGDP -.35 -.30 -.25 -.20 -.15 -.10 1975 1980 1985 1990 1995 2000 2005 2010 LTOP -20 -10 0 10 20 1975 1980 1985 1990 1995 2000 2005 2010 TBIL