Excessive Daytime Sleepiness in Children and
Adolescents across the Weight Spectrum
by
Lilach Kamer
A thesis submitted in conformity with the requirements for the degree of Master of Science
Institute of Medical Science University of Toronto
Excessive Daytime Sleepiness in Children and Adolescents
across the Weight Spectrum.
Lilach Kamer Master of Science Institute of Medical Science
University of Toronto 2011
Abstract
A relationship between overweight and excessive daytime sleepiness (EDS) has been suggested in the adult population, and to a limited extent in the pediatric population. Daytime sleepiness can interfere with various components of daytime function. In light of the increase in the rates of pediatric overweight and obesity, the aim of this study was to investigate the relationship
between weight and EDS in a pediatric population.
Using a retrospective approach, data collected in a pediatric sleep clinic was analyzed. Objective measures of EDS were correlated with age, gender, body mass index percentile, and overnight sleep test recording variables.
In males and in all children under the age of 13 years old, EDS was more common in those weighing above the normal range, EDS was present particularly during mid-morning hours. Additionally, weight above the normal range correlated with evidence of EDS after adjusting for measures of sleep pathologies.
Acknowledgments
First and foremost, I would like to thank my supervisor, Dr. Colin Shapiro for the opportunity to work and learn at the Youthdale Child and Adolescent Sleep Center, and for patiently developing my budding research skills.
To the staff at the Youthdale Child and Adolescent Sleep Center, especially Dragana Jovanovic and Inna Voloh, for introducing me into the intricate world of pediatric sleep testing as well as Dora Zalai and Rose Lata for their patience, advice, dedication and willingness to accommodate my research needs…and for smiling while they do this.
To Nada Huterer and Naheed Hossain for their kind support and advice and to Nancy MacFarlane for helping out whenever asked.
For Dr. Sharon Chung for offering her expertise and her time.
To my wonderful committee members, Dr. Jill Hamilton and Dr. Debra Katzman, for keeping me grounded, their good advice and direction throughout the research process.
To Dr. Yoav Kessler for his help with the statistical analysis for this research and for so patiently walking me through it.
Last, but definitely not least, to my dear family. To my brave and supportive husband, for holding the fort while I kept vanishing into the sunset. And for my darling children—Nadav, Shira and Savyon—for understanding (or just coping with the fact) that mommy had to go again and again and again. Thanks to my parents and my loving sibling for taking an interest in my work and occasionally giving me some much needed perspective. Thanks to my many friends who took my kids time after time when I was running late.
This research was supported in part by the Youthdale Foundation. The graduate studies were funded in part by the University of Toronto Open Award.
Table of Contents
Abstract ... ii
Acknowledgments... iii
Table of Contents ... iv
List of Abbreviations ... viii
List of Tables ... xi
List of Figures ... xii
List of Appendices ... xiv
1 INTRODUCTION AND BACKGROUND ... 1
1.1 Statement of the problem ... 1
1.2 Sleep and Sleepiness ... 2
1.2.1 Sleep... 2
1.2.2 Sleepiness and Excessive Daytime Sleepiness ... 14
1.2.3 Consequences of EDS in Children and Adolescents ... 21
1.2.4 Measuring Sleep... 23
1.3 Childhood Obesity ... 33
1.3.1 Measurements ... 33
1.3.2 Prevalence of childhood obesity ... 37
1.3.4 The biological pathways controlling energy balance... 39
1.4 Excessive Daytime Sleepiness and Obesity... 41
1.4.1 Suggested pathways for the relationship between sleep disorders and weight gain………... 41
1.4.2 The relationship between obesity and sleep and EDS- the role of inflammation . 42 1.4.3 Sleep and obesity in pediatric research ... 43
1.4.4 EDS and obesity in children and adolescents ... 44
2 METHODS AND MATERIALS... 47
2.1 Research Aim and Hypothesis ... 47
2.1.1 Aim ... 47 2.1.2 Study question... 47 2.1.3 Hypothesis... 47 2.2 Methods... 48 2.2.1 Study design... 48 2.2.2 Data collection ... 48 2.2.3 Outcome measures ... 50
2.3 Sample Size and Statistical Power Considerations ... 51
2.4 Statistical Analysis... 53
2.5 Ethical Considerations ... 54
3 RESULTS ... 55
3.2 Differences in MSLMSLT by Weight Group... 57
3.2.1 Differences in MSLMSLT by weight group and gender ... 58
3.2.2 Differences in MSLMSLT by weight group and age ... 60
3.3 Differences in MSL for each nap between weight, gender and age groups ... 64
3.4 Correlations... 65
3.4.1 Correlations between BMI%, MSLMSLT, AHI and AI by gender ... 66
3.4.2 Correlations between BMI%, MSL, AHI and AI by age... 68
3.5 Multivariate Regression Analysis- predictors of EDS... 70
3.6 Subsequent Analysis of Data from Subjects Treated with Medications that Influence Sleep and Sleepiness ... 72
3.6.1 Differences in MSLMSLT by Weight Group... 74
3.6.2 Differences in MSL for each nap between weight groups... 75
3.6.3 Correlations between BMI%, AHI, AI and in MSLMSLT... 76
4 DISCUSSION ... 77
4.1 Study Population ... 77
4.2 EDS and Weight ... 78
4.2.1 The role of gender and age... 78
4.2.2 The role of sleep pathology: sleep apnea and sleep fragmentation ... 81
4.2.3 Changes in EDS levels throughout the day... 82
4.2.4 EDS and weight in children and adolescents treated with medications that are known to influence sleep and sleepiness. ... 82
4.3 Limitations ... 84 4.4 Strengths ... 86 4.5 Conclusions... 87 4.6 Future directions ... 88 References... 91 Appendices... 105
Appendix A-List of medications that rendered exclusion from the study during data collection ... 105
Appendix B-List of medical conditions that rendered exclusion from the study during data collection... 106
Appendix C- Questionnaires and scales to assess EDS ... 107
List of Abbreviations
AHI- Apnea Hypopnea Index AI- Arousal Index
BMI- Body Mass index
BMI%- Body Mass Index Percentile CSHQ-Children Sleep Habit Questionnaire
CASQ-Cleveland Adolescents Sleep Questionnaire CSA- Central Sleep Apnea
DLMO- Dim light melatonin onset DSPS- Delayed Sleep Phase Syndrome. ECG-Electrocardiogram
EDS- Excessive Daytime Sleepiness EEG- Electroencephalography EMG-Electromyography EOG- Electrooculography ESS- Epworth Sleepiness test GI-Gastrointestinal
HPA- Hypothalamic-Pituitary-Adrenal MSL – Mean Sleep Latency
MSLnap - Mean Sleep Latency in a nap MSLT- Multiple Sleep Latency Test NREM- Non Rapid Eye Movement OB- Obese
OSA- Obstructive Sleep Apnea OW- Overweight
OWr - Overweight range
PDSS-Pediatric daytime Sleepiness Test PLMD-Periodic Leg Movement Disorder PSG- Polysomnography
PSQS-Pediatric Sleep Quality Scale
PSQ-SS- Pediatric Sleep Questionnaire- Sleepiness Scale REM- Rapid Eye Movement
RLS- Restless Leg Syndrome SCN- Suprachiasmatic nucleus SDB- Sleep Disordered Breathing SEM- Slow Eye Movement SMR- Sexual Maturity Rating SOL- Sleep Onset Latency
SQS- Sleep Quality Scale SWS- Slow Wave Sleep TST-Total Sleep Time
List of Tables
Table Page
1.1 EDS in children according to age. 15
1.2 Causes for EDS in children and adolescents (adapted from Kothare and Kaleyis). 17
1.3 Primary causes for EDS by age group. 21
1.4 Assessment of subjective daytime sleepiness in children and adolescents. 30
1.5 A summary of all the currently published studies examining the relationship between EDS and obesity in children and adolescents. 44
3.1 Exclusion process details. 55
3.2 Characteristics for the total population (n=188). 56
3.3 Mean MSLMSLT by gender group. 58
3.4 Mean MSLMSLT by age group. 61
3.5 Correlations between BMI%, MSLMSLT , AHI and AI for the entire population. 65 3.6 Correlations between BMI%, MSLMSLT , AHI and AI by gender. 66
3.7 Correlations between BMI%, MSLMSLT , AHI and AI by age. 68
3.8 Multiple regression model predicting EDS for the entire population. 70
3.9 Multiple regression model predicting EDS for each age group 71
List of Figures
Figure Page
1.1.a PSG recording of awake child. 5
1.1.b PSG recording of sleep stage 1. 5
1.1.c PSG recording of sleep stage 2. 6
1.1.d PSG recording of sleep stage 3. 6
1.1.e PSG recording of sleep stage 4. 7
1.1.f PSG recording of REM sleep. 7
1.2 Age related trends for sleep stages. 8
1.3 The two process model. 12
1.4 The regulation and functions of hypocretin. 13
1.5 International 10-20 System used to record EEG. 25
1.6 An example of one epoch on a polysomnography recording. 26
1.7.a CDC BMI for age percentile growth charts for boys 35
1.7.b CDC BMI for age percentile growth charts for girls. 36
1.8 Complications of childhood obesity. 38
2.1 A graphic representation of apnea(obstructive-right) and hypopnea (left). 51
3.1 The frequency of normal vs. abnormal MSLMSLT in each weight group for the total study population (n=188). 57
3.2 The frequency of normal vs. abnormal MSLMSLT in each weight group for male subjects (n=116). 59
3.3 The frequency of normal vs. abnormal MSLMSLT in each weight group for
female subjects (n=72). 60
3.4 The frequency of normal vs. abnormal MSLMSLT in each weight group for subjects age <13, C group (n=119). 62
3.5 The frequency of normal vs. abnormal MSLMSLT in each weight group for subjects age ≥13 , A group(n=69). 63
3.6 MSLnap by subjects weight, gender and age group 64
3.7 Correlation between BMI% and MSLMSLT for the entire population. 65
3.8 Correlation between BMI% and MSLMSLT for males and females. 67
3.9 Correlation between BMI% and MSLMSLT by age group. 69
3.10 Distribution of the type of medication used between the weight groups 73
3.11 The frequency of normal vs. abnormal MSLMSLT in each weight group for the medicated subjects (n=68) 74
3.12 MSLnap by subject’s weight in the medicated group. 75
List of Appendices
Appendix A- List of medications that rendered exclusion from the study during data collection. Appendix B- List of medical conditions that rendered exclusion from the study during data collection.
1
INTRODUCTION AND BACKGROUND
1.1 Statement of the problem
In recent years obesity has been identified as a rising pandemic in modern society, affecting adults and children alike (1). In Canada, the prevalence of obesity is estimated to have tripled in children over the last 25 years (2).
Daytime sleepiness has been recognized as a frequent complaint among adult obese individuals (3). Excessive daytime sleepiness (EDS) in obese adults is traditionally perceived as a
consequence of the high prevalence of obstructive sleep apnea (OSA). OSA occurs when the sleeping individual experiences repeated episodes of total (apnea) or partial (hypopnea) upper airway obstruction which results in the temporary reduction of blood oxygen levels and usually ends with a brief arousal from sleep (4). Since the mid-nineties our group and other researchers have suggested that obesity may be related to daytime sleepiness even without the presence of OSA (3;5-9).
The concept that obesity per se may be related to EDS has also been explored in the pediatric literature (10-13), but the evidence in children and adolescents is limited by methodological issues.
Impaired sleep has been noticed to have a negative effect on memory, learning and academic performance, as well as on mental wellness (14-20). In children in particular, difficulties with academic achievement and mental integrity may have a devastating effect on academic future and psychosocial development. Moreover, sleepiness can also contribute to life-threatening situations such as motor vehicle accidents, particularly in adolescents (21).
Despite the rise in pediatric obesity, there is a paucity of evidence about its relationship to EDS. In light of the impact of sleepiness on daytime performance, there is a need for further
investigation on the interplay between weight and daytime sleepiness in children and
adolescents. The purpose of this study was to investigate the relationship between weight and daytime sleepiness in children and adolescents.
1.2 Sleep and Sleepiness
1.2.1 Sleep
Definition:
Using a simple behavioral approach, sleep can be defined as a behavioral state of temporary disengagement from, and unresponsiveness to, the environment (22-24).
The modern study of sleep was made possible with the demonstration of spontaneous electrical brain activity and the invention of the electroencephalograph (EEG) by Hans Berger in Germany in the second decade of the 20th century. This invention made it possible to measure and quantify sleep without disturbing the sleeper (25). Sleep measurement today uses EEG with other
measurements such as tracing of muscle tone and eye movements to establish a state of sleep and to follow the various changes in brain activity throughout the sleep process. A detailed
description of the process of sleep measurement called polysomnography (PSG) are described below.
ormal Sleep:
In order to understand the unique features of pediatric sleep, including the developmental
aspects, an understanding of normal adult sleep is needed. Sleep is viewed as involving two basic components: non- rapid eye movement (NREM) and rapid eye movement (REM) sleep. These alternate periodically throughout the sleep session (22). These two components differ by the type of cortical activity viewed on the EEG, muscle tone, eye movements and psychological activity. In NREM sleep, cortical activity, as recorded on the EEG, is synchronized while muscle tone is minimal. In REM sleep, the EEG shows desynchronized cortical activity, the body is
physiologically paralyzed and dreaming usually occurs (22).
NREM sleep is further divided into stages. Sleep staging was standardized in 1968 with the acceptance of the Rechtschaffen and Kales manual of sleep scoring (26). NREM sleep was divided into four stages simply named stages 1-4. In 2007, the American Academy of Sleep Medicine published new scoring recommendations in which stages 3 and 4 were merged into one stage and NREM sleep stages were renamed N 1-3 (27). Since this recommendation was not
accepted as a mandatory standard of practice outside the United States and in Canada, the traditional 4 stages of NREM sleep will be used throughout this thesis.
ormal sleep stages: The various graphs recorded on a PSG study are observed in 30 minute sections called epochs. These are scored individually as a specific sleep stage according to the criteria outlined below(23;26;28).
− Awake
In active wakefulness, the EEG usually shows desynchronized high frequency low amplitude waves probably due to differences in the processing time of the various activities conducted when a person is awake (23). During ‘relaxed wakefulness’ the EEG shows rhythmic alpha activity most prominent at the posterior head region (above the occipital region of the cortex) when eyes are closed and low voltage mixed frequencies when eyes are open. Eye movement changes with slow eye movement (SEM) appearing with drowsiness. Muscle tone is relatively high with voluntary movements occurring.
− REM sleep
Stage 1- This is usually the transitional stage between waking and sleep, where awareness of the external environment gradually disappears. It tends to be of short duration. This stage is
generally characterized by slowing of the EEG waves, with low voltage, mixed frequency and occasional vertex sharp waves and theta waves. In children, bursts of synchronized high voltage theta waves may emerge. SEM is visible and usually precedes the change in EEG. Muscle tone may slightly decrease.
Stage 2- The EEG shows relatively low voltage mixed frequency activity interrupted by wave forms called sleep spindles and K-complexes. SEM gradually disappears and muscle tone is similar to stage 1.
Stage 3- ≥ In each of the epochs there is 20% and ≤ 50% high amplitude slow frequency waves (delta waves). Eye and muscle tone are not changed.
Stage 4- More than 50 % delta activity is evident in each epoch. Eye and muscle tone are not changed.
Stages 3 and 4 are commonly considered together and termed as ‘slow wave sleep’ (SWS) or deep sleep. Sleep intensity is evaluated, in part, as the amount and quality of the delta waves. In children, the amplitude of these delta waves is generally greater.
− REM sleep
EEG shows relatively low voltage mixed frequency waves with theta and alpha activity, and stage specific saw tooth waves. This stage is also characterized by phasic rapid eye movements (REM) and by a general suppression of muscle tone.
The above listed scoring criteria and sleep stages are demonstrated in figures 1.1.a to 1.1.f. These figures were all taken with permission from the records of a healthy eight year old child without sleep complaints who attended the Youthdale Child and Adolescent Sleep Centre. This child was a volunteer for another project with the aim to collect normative data on pediatric PSG. The first six lines (labeled F3, F4, C3, C4, O1, and O2) in each figure are the EEG channels. The next lines labeled LOC and ROC are recording of eye movement via electro-oculography, and the line labeled CHIN1 reflects the chin muscle tone via electeromyography. The remaining lines as well as a complete description of the PSG recording technique are available in section 1.2.3).
Figure 1.1.a: PSG recording of awake child.Alpha waves (rectangle) are visible especially above the occipital region, EEG channels O1 and O2. The eyes are open, blinking occasionally (ellipses).
Figure 1.1.b: PSG recording of sleep stage 1. General slowing of the EEG waves is present in all the EEG channels. Slow eye movements are visible (colorless rectangle). An arousal was also marked by the PSG scorer (colored rectangle).
Figure 1.1.c: PSG recording of sleep stage 2. Mixed frequencies in the EEG. Sleep spindles (rectangle) and K-complex (circle) are present.
Figure 1.1.d: PSG recording of sleep stage 3. High amplitude delta waves are present, but do occupy more than 50% of the epoch.
Figure 1.1.e: PSG recording of sleep stage 4. High amplitude delta waves are present in more than 50% of the epoch.
Figure 1.1.f: PSG recording of REM sleep. Mixed frequency on the EEG with stage specific saw tooth waves (rectangle). Phasic eye movements are present (ellipse) and muscle tone is reduced (throughout the CHIN channel).
Developmental aspects of sleep in children and adolescents:
Figure 1.2: Age-related trends for sleep stages. Age (years) related trends for stage 1 sleep, stage 2 sleep, slow wave sleep (SWS), rapid eye movement (REM) sleep, wake after sleep onset (WASO) and sleep latency (in minutes). (Image taken from Ohayon et al., 2004)
The total amount and composition of sleep changes throughout the life span (22;29)(Figure 1.2). The main differences in sleep during childhood are seen in total sleep time (TST), SWS, REM latency and Stage 2. These changes are both quantitative and qualitative (22;29;30). While TST and SWS show a steep decline during the adolescent years (29), several studies have also demonstrated the superior quality of SWS in young children (under 10 years old) by demonstrating the difficulty in disturbing a child’s sleep while in SWS (22).
Newborns (0-2 months)
Newborn babies sleep 16-20 hours per day and this is divided into 1-4 hour periods. Sleep and wake are initially governed by hunger and satiation in the newborn, regardless of light/dark changes and other external cues. Through the first months of life, consolidation of a night sleep
period is usually achieved, driven by the growing awareness to external cues both biological (light/dark) and social (31). In a newborn baby, the previously described EEG patterns of sleep stages cannot be identified. Only three distinct stages can be recognized in a newborn baby: active sleep, quiet sleep and indeterminate sleep. The terms ‘active sleep’ and ‘quiet sleep’ were created in the early years of sleep research and continue to be relevant. The terms ‘active sleep’ and ‘quiet sleep’ describe a ‘REM like’ sleep and a ‘NREM like’ sleep, respectively (32). Active sleep comprises about 50% of the sleep period. It resembles REM sleep with visible rapid eye movements, irregular heart rate, respiration and frequent small movements of limbs and face muscles (32). Babies at this age usually enter the sleep period through this stage. Quiet sleep resembles NREM sleep with regular respiration and heart rate, minimal body movement and no eye movement (32). Indeterminate sleep has some features of both (33;34). Most sleep problems at this age are caused by a mismatch between parents’ expectations in regards to their child’s sleep or their difficulties interpreting their baby’s behavior (33).
Infants (2-12 months)
Sleep time gradually declines to a minimum of about 13 hours per day at 6 months and then further declines to about 12 hours per day at 12 months (33). It should be noted that great individual variation in sleep can be found in this age group (34). Longer night sleep periods and shorter daytime naps are apparent by the age of 3 months. About 70% of infants sleep with no intermittent wake period at night by the age of 9 months and have about 2 naps during the day (33). Distinctive NREM and REM sleep become apparent during the first 6 months of life with 50 minute cycles (from the start of one NREM to the start of the next one) (32;33). Most sleep problems at this age revolve around sleep onset and night awakenings.
Toddlers (1-3 years)
TST at this age is about 12 hours per day. By the age of 1.5 years most toddlers only require one nap a day. Most sleep problems at this stage have to do with sleep onset difficulties and bedtime resistance (33).
Preschoolers (3-5 years old)
Sleep time for most children at this age is about 11-12 hours per 24 hours. From infancy through early childhood, naps are needed; approximately 25% of children at age 5 still require a nap (35).
This will be further discussed in the segment addressing daytime sleepiness in children. Sleep cycles reach the typical adult duration of 90-110 minutes. The percentage of SWS and REM is high (34). Sleep problems at this age are still mainly of the sleep onset and bedtime resistant type, but problems such as sleepwalking and night terrors may appear. OSA is also common, mainly due to the high prevalence of tonsil and adenoid enlargement at this age (33).
School age (6-12 years)
TST needed at this age is 10-11 hours per day. Children at this age are usually very alert, making any sign of daytime sleepiness highly suggestive of the presence of sleep problems. There are a wide range of sleep problems at this age including insufficient sleep, anxiety-related difficulties and OSA (33).
Adolescents (13-18 years)
TST should be about 9-9.25 hours per day at this age. However, several studies, including one from our group, have pointed out that this desired amount of sleep is seldom achieved by adolescents (30;33;36). Sleep architecture (sleep stage distribution) resembles adult sleep architecture with a gradual reduction in the amount of SWS and REM sleep coupled with an increase in stage 2 sleep (29;33). A physiological delay in sleep time onset (delayed sleep phase) of about 2 hours is common at this age group, with a preference of later bedtimes and wakeup times. The exact mechanism behind this delay is not yet clear. Increased sensitivity to light, slower development of the drive to sleep (sleep pressure) and possible effects of gonadal hormones on sleep regulation have been suggested and explored in humans and animal studies (37). Together with the social demands of school and extracurricular activities, insufficient sleep and EDS is common among adolescents (29;33). This will be further discussed in section 2.1.2. The spectrum of sleep disorders at this age is wide and includes many sleep pathologies that are found in adults.
Sleep- wake regulation
The sleep-wake cycle is controlled by the balance between arousal and sleep-promoting agents such as hormones and neuroreceptors mainly in the brainstem and hypothalamus (38). The most widely accepted model for the regulation of the sleep-wake cycle in mammals comprises two main processes (39-41):
1) A homeostatic system (Process S) located mainly within the preoptic area of the brain regulates the quantity and intensity of sleep (39). This system generates ‘sleep pressure’ – a need to sleep which increases progressively with time from the end of the previous sleep period (41).
2) A circadian system (Process C) regulates the timing of sleep during the day-night cycle. The circadian rhythm of the sleep/wake cycle is controlled by a circadian pacemaker located in the anterior hypothalamus in the suprachiasmatic nucleus (SCN). This is mediated through a hormone named melatonin. Melatonin secretion is entrained by light (42). Melatonin is suppressed to an almost non-existent level by light and rises in the evening when light intensity declines (41). The circadian system has a pacemaker which has a natural duration slightly longer than 24 hours but is entrained by environmental cues (also called zeitgebers) to fit the 24-hour day (30). The circadian pacemaker
influences not only the sleep/wake cycle but other behaviors as well such as feeding and sexual behavior (41).
It has been suggested that these two processes (S and C) act both as allies and opponents. The increased sleep pressure generated by the homeostatic system combined with the circadian drive to sleep with darkness in the evening time works to initiate sleep. Later through the night, while the sleep pressure declines, the continued circadian signal works to maintain the sleep period. Sleep ends when both the sleep pressure and circadian sleep drive are decreased (40;41).
Figure 1.3: The two process model This is a graphical representation of sleep regulation according to the two-process model. S represents the homeostatic sleep drive, rising during waking and declining during sleep. C represents the circadian rhythm cycle and is measured by body temperature. The optimal time for sleep occurs when S is at its peak and C is in its low. This coincides with the typical nighttime sleep period. Wake up typically occurs where C and S intersect. (Taken with permission from Borbely AA. Sleep homeostasis and models of sleep regulation. In: Kryger MH, Roth T, Dement WC,
(eds.), Principles and Practice of Sleep Medicine (2nd ed). Philadelphia: WB Saunders Co., 1994: 316.) There is an intricate net of interactions between these two systems and other subsystems that together govern the process of sleep and wakefulness. It is beyond the scope and purpose of this manuscript to describe this interplay in full. However, the relevance of neurotransmitters orexin A and orexin B to sleep regulation and feeding behavior will be described.
Orexin A and orexin B also referred to hypocretin 1 and hypocretin 2 are neuropeptides first reported in 1998 by two separate research groups (hence the two names used) (43;44). While De Lecea’s group could not report on the peptides function, Sakurai and colleagues reported that these peptides increase appetite when given to rats. A link between these peptides and sleep in canines and mice were reported a year later (45;46). Both groups reported that narcolepsy- a sleep disorder characterized by excessive sleepiness- was present when orexin deficiency was induced in these animals. Orexin neurons have been demonstrated to be active in wakefulness and inactive during sleep (47). Other studies showed that lower numbers of orexin neurons and a mutation in the orexin related genes were linked with narcolepsy in humans as well (48;49). Orexin has also been linked with weight control. These peptides are found in the hypothalamus (where both sleep and hunger control centers are located), and are regulated by glucose and hunger-satiation related hormones such as ghrelin and leptin. High levels of the orexins promote
wakefulness and appetite(50). Some case reports have suggested a link between orexin and sleep disorders characterized by excessive sleepiness, as well as with weight control difficulties. These include Prader-Willi syndrome and Klein-Levine syndrome (51) (See section 1.4.3. for more details).
Figure 1.4. The regulation and functions of hypocretin. Hypocretin (Hcrt also referred to as orexin) neurons are present in the hypothalamus. Leptin and glucose inhibit Hcrt secretion while ghrelin increases Hcrt secretion. Increased Hcrt promotes wakefulness, increases appetite, is involved in
reward/pleasure-seeking behaviours, and stimulates sympathetic activity. (Taken with permission from Ganjavi and Shapiro 2007 (51)).
1.2.2 Sleepiness and Excessive Daytime Sleepiness
Definition of sleepiness
There is no clear consensus as to the definition of sleepiness. Sleepiness can be thought of as the tendency to actually fall asleep or sleep propensity, but it is also described using facets of
cognitive ability, mood, motivation and physiological changes (52). While a state of sleepiness will generally be accepted as normal at nighttime, feeling sleepy during the daytime may be perceived as abnormal. What defines daytime sleepiness as excessive is debatable (52).
Similarly, alertness is not easily defined. Definitions can vary between the simple ability not to fall asleep to a more complex concept using indices of cognition and mood (52). It appears that choosing just one definition may be a simplistic approach. While the propensity to fall asleep or stay awake may be objectively measured, other definitions of sleepiness and alertness may be viewed as subjective impressions of these states, and the two aspects do not necessarily correlate (52). Furthermore, sleep and alertness should not necessarily be considered mirror images of each other. Moller et al. examined four groups of subjects with different sleep pathology. While sleepiness scores differed between these groups, alertness evaluated by two separate scales did not vary significantly between the groups (53).
Excessive daytime sleepiness (EDS)
Excessive daytime sleepiness (EDS) is a clinical term used to describe a condition in which individuals fall asleep during the daytime when they would usually be expected to be awake (52;54;55). Our group (52) has reported a wide range of estimated prevalence of EDS (0.3-35.8), depending on the method of assessment and the type of population studied. The situation is similar in children and adolescents with estimates of EDS ranging from 17% to 68%. The highest rates were reported in adolescents (36;55;56).
While EDS may be caused by poor sleep habits or bedtime restriction, EDS may also be a result of an underlying medical condition or sleep pathology. The consequences of EDS may range from social embarrassment (falling asleep on the bus or in class) to lower scholarly
achievements, to impaired daytime function that may even be life threatening (falling asleep while driving a car). EDS is highly treatable in most cases, once the underlying condition has been identified (57).
The presence and level of EDS can be evaluated by subjective or objective measures (52). Subjective measures include asking patients about EDS as part of the medical sleep history and using various questionnaires designed to asses EDS (58-61). The most widely used validated objective measure of EDS in sleep medicine is a sleep laboratory test called the Multiple Sleep Latency Test (MSLT) (54). This and other methods to assess daytime sleepiness will be
described below. EDS in children
In children, as in adults, the exact prevalence of EDS is not clear due to differences in definition and measuring methods. Some estimates show that 17-21% of school-aged children experience EDS and that up to 68% of adolescents complain of EDS (55).
Table 1.1. EDS in children according to age
Infants, toddlers and school preschoolers (0-5 years old)
Daytime sleepiness may be a perfectly normal condition in children of preschool age and under. Most toddlers and some pre-school children need a day-time nap (35).
School aged children (6-12 years old) It is very rare for school-aged children to have a daytime nap. Reports of daytime sleep in pre-pubertal children are considered a cause for concern in regards to the integrity of their night sleep (31;55).
Adolescents (12-18 years old) Daytime sleepiness is more common in adolescents (30;36;62-64).
Causes of excessive daytime sleepiness in children
A child may be considered sleepy when either longer night sleeps or longer and more frequent daytime naps are present compared to other children of the same age, or compared to the child’s previous sleep patterns. A sleepy behavior at a time when peers are not sleepy may also be present (55).
Daytime sleepiness is a symptom that can be attributed to many different causes. In a recent review, Kothare and Kaleyias (2008) offer a convenient approach to categorization of these causes. The first two categories are somewhat intuitive, with sleepiness as a product of either insufficient sleep quantity or quality. The third category reflects conditions in which the need for sleep is increased (55). (Table 1.2)
To date, obesity as an independent cause for sleepiness is not mentioned in any review
concerning childhood sleepiness. A few studies examining obesity per se as a cause for pediatric EDS have been published and will be reviewed in section 1.4.
Table 1.2: Causes for EDS in children and adolescents (adapted from Kothare and Kaleyis).
Decreased quantity of sleep Decreased quality of sleep Increased need for sleep
Self-induced or socially determined sleep restriction
Idiopathic sleep fragmentation Inherited or acquired neurological and medical conditions
Insomnia Sleep disordered breathing (SDB) e.g. OSA.
Drug related (medical or illicit)
Circadian rhythm disorders Movement disorders Depression related
Parasomnias Narcolepsy
Medical conditions (e.g. nocturnal asthma attacks)
Klein–Levin syndrome
Environmental (noise, temperature)
Idiopathic hypersomnia
Decreased sleep quantity
It is widely agreed that the most common cause of EDS in children and adolescents at any age is lack of sufficient total sleep time due to inadequate sleep hygiene and self restriction of sleep time. The reasons for this include homework, extra-curricular activities, social demands, use of technology (e.g., television, video games, and internet), and the use or consumption drugs (e.g., caffeine, alcohol). This type of sleep loss increases through the adolescent years when school and work loads rise while parental control over sleep behavior decreases (35;65-67). Li et al studied parents’ report of 19,299 elementary school children and showed a positive correlation between the presence of media devices in the bedroom and a reduction in sleep duration (65). Gibson and colleagues reported findings from two surveys with a total of 3235 Canadian adolescents
(secondary school) from diverse socioeconomic backgrounds, in which EDS as well as other sleep-related topics were assessed with a self-reported questionnaire. The study used anonymous self reported measures and suffered from low participation rate in some schools. However, its results were consistent with those of others, showing high prevalence of sleep deprivation in this age group to be associated with EDS and reduced performance in school as well as in
extracurricular activities (36). A larger survey of younger adolescents conducted in Japan (9,261 middle school children) showed similar results (64). An interesting study from Brazil reported finding in a unique sample of adolescents (age 11-16 years). Although living in the same rural area and attending the same school, close to a half of this study subjects lived without electricity. The researchers showed decreased sleep times in subjects living with electricity vs. those living without it (68).
Insomnia in toddlers and preschoolers is mainly of a behavioral nature with children resisting the appropriate bedtime. Adult type insomnia driven by social and psychological stressors and anxiety is more likely to emerge during the adolescent years. Given this, insomnia is most often a symptom of an underlying condition that requires further exploration. These underlying
conditions include untreated or under treated sleep disorders, medical conditions including psychiatric conditions, medication use, and alcohol and drug abuse (33;35).
Another mechanism with particular relevance in pediatric EDS is a circadian sleep problem called Delayed Sleep Phase Syndrome (DSPS). DSPS is a disorder characterized by the
continuous inability to fall asleep at a conventional bedtime with a tendency to fall asleep toward the early morning hours (69). This disorder has been noted to be more common in adolescents. During the adolescent years, along with the process of puberty, there is a physiological delay in the secretion of melatonin in some children and a general preference for later bedtime and wake up times (70). In some cases, this physiological shift in sleep phase causes a significant
interference in daily function giving a clinical picture consistent with DSPS(41). DSPS may have debilitating implications, since personal and social schedules are skewed, which may lead to social and psychological problems (69;71). Once the diagnosis of DSPS has been established it can be successfully treated with either light therapy or with the use of exogenous melatonin (69;72). Being exposed to artificial electrical light has been shown to contribute in further promoting the natural sleep phase delay in adolescents (68). The phase delay that is seen in teenagers is sometime volitional and sometimes biological. It is self evident that for some
teenagers it would be a combination of the two. It is highly likely that “volitional” population will not present at a sleep clinic as this is a form of choice, where as within the biological group there will be many who find this undesirable and so will seek a remedy.
Decreased sleep quality
Sleep fragmentation is currently defined by the appearance of a brief arousal on the EEG recording (73). These repeated short interruptions in the sleep continuum have been linked to daytime sleepiness (74-76). Sleep fragmentation can occur without any apparent reason, but also accompanies many of the disorders in this category.
Sleep Disordered Breathing (SDB) is a term that refers to a group of conditions in which
breathing is disturbed within the sleep period and ranges from simple snoring to actual pauses in breathing called sleep apnea (67). OSA is a situation in which the sleeping individual
experiences repeated episodes of total (apnea) or partial (hypopnea) upper airway obstruction which result in temporary reduction of blood oxygen levels and usually ends with a brief arousal from sleep (4). In central sleep apnea (CSA), respiratory effort is reduced or absent intermittently due to central nervous system or cardiac system dysfunction. As with OSA, brief arousal usually occurs at the end of the respiratory compromised spell (4). All of these conditions have been linked with EDS in children at any age (77;78) although, unlike adults, children with these disorders may also appear to be hyperactive (35;79).
The main movement disorders linked with EDS is restless legs syndrome (RLS). This is a sensory motor disorder in which individuals experience a strong uncomfortable, almost irresistible urge to move their legs, which is made worse by rest. This is also typically more severe in the evening and nighttime. In many cases this is associated with a leg movement disorder during sleep called Periodic Limb Movement Disorder (PLMD) (4). RLS has been shown to be more common in adult patients with type 2 diabetes mellitus (80;81). The prevalence of RLS and PLMD is understudied in the paediatric population. A recent study reported a 2% prevalence of RLS in school-aged children and adolescents (20).
Parasomnias are arousal disorders that are more common in preschoolers and school-aged children than in adults and include a variety of unusual activities during sleep such as screaming, walking and talking (4). EEG arousals are apparent during transitions from SWS to REM sleep
and daytime sleepiness may occur (35).
Medical conditions such as asthma, cystic fibrosis, rheumatic diseases, burns and infection (viral, bacterial and fungal) and others may cause disturbances to night sleep due to pain or respiratory or neurological compromise (33).
Increased sleep need
This group consists of an assortment of inherited or acquired, relatively rare conditions that have a well known association with sleepiness or have sleepiness as a hallmark characteristic.
Examples include narcolepsy and Klein-Levine syndrome (see section 1.4.3).
Some medications have been noted to interrupt sleep (mainly with insomnia) or to promote alertness or daytime sleepiness. In some cases both insomnia and EDS are listed in the side effect profile of a specific medication. Psychostimulant medication for the treatment of attention and hyperactivity deficit spectrum disorders, various antidepressants and anxiolytic medications, anticonvulsants and antipsychotic medications are among the pharmaceutical treatments employed in the pediatric population that have been noted to interact with sleep and sleepiness (82). While sleepiness related complaints have been recorded as adverse effects of these drugs in clinic trials, their effects on EDS were generally not studied with objective measures of daytime sleepiness (with the exception of a group of studies in treatment with psycho stimulants-
Modafinil and Armodafinil in patients with narcolepsy (83-85)).
As in adults, psychiatric disorders in the pediatric population, mainly anxiety and depression, have been reported to interact with sleep. Insomnia, nightmares, early morning awakenings and lethargy are common in children and adolescents affected by these conditions and may all contribute to EDS (86).
Table 1.3: Primary causes of EDS by age group.
Infants (2-12 months)
Toddlers (1-3 years)
Preschool (3-5 years) School age (6-12 years) Adolescents (12-18 years)
Insomnia – behavioral Sleep restriction Insomnia – behavioral SDB Parasomnias Sleep restriction Insomnia- behavioral or other SDB Parasomnias Sleep restriction Insomnia- psychological or other SDB RLS Sleep restriction Insomnia- psychological or other
Circadian rhythm disorders SDB
RLS
1.2.3 Consequences of EDS in Children and Adolescents
Daytime consequences of sleep disorders have been studied extensively across the age range. Despite the different etiologies that lead to EDS, sleepiness seems to be an incapacitating condition in adults. Sleepiness has been shown to have an impact on family and social
interaction, work and cognition (including memory, concentration and decision making) (87). Chronic EDS has been linked with an undesirable effect on mood, decreased work performance and indications of reduced quality of life (88-90). Safety is also compromised when daytime sleepiness occurs with higher rates of traffic or motor vehicle and workplace accidents (91;92). Research in children and adolescents has produced similar findings. Children who report being poor sleepers were shown to have more behavioral difficulties, daytime hyperactivity, and more depression and anxiety symptoms (93-95). This association was demonstrated in studies using various subjective and objective measures of sleep and behavioral issues; some showing behavioral issues to be reversible after sleep problems are treated (14-19).
Smedje et al. studied a large group (n=635) of 6-8 years old children using subjective measures (parent completed questionnaires) to assess for both sleep and behavioural issues. Findings from this study indicate an association between behavioural difficulties and sleep problems such as restless sleep, bed wetting, sleep walking and nightmares (18). In a small case control study,
designed to assess the effect of adenotonsillectomy on behaviour and psychological function, vigilance and continuous performance tests were shown to improved after surgery and parents reported a reduction in aggressive behaviour, inattention and hyperactivity (15).
Chervin and colleagues reported PSG findings from 113 children and adolescents (2-18 years) who were assessed for behavioural difficulties with parent-completed questionnaires, showing an association between behavioural issues with both SDB and PLMD (17). In another study by the sane group, indicators of conduct problems and aggressive behaviour were two to three times more prevalent in children at high risk for SDB and PLMD (96). PLMD and SDB were also shown to be highly prevalent in a sample of sleep clinic patients with attention deficit and hyperactivity disorders (19).
In a large survey including children and their parents, RLS has been reported (by parents and children alike) to negatively affect mood. Children and adolescents with RLS were more commonly diagnosed with attention-deficit disorder, depression and anxiety (20).
Using actigraphy (a technique used to record rest and activity levels over days or weeks - see section 1.2.3.) along with questionnaire assessment of behavioural problems, researchers from Finland showed shorter sleep duration to be associated with behavioural problems in primary school aged children (16). Another study using similar methods (actigraphy and questionnaires assessments) and population (healthy elementary school-age children) failed to show a
connection between sleep duration and behavioural problems. However, they reported a lower intelligence quotients in individuals who had shorter sleep time (97).
School problems are repeatedly reported in children with sleep-related breathing disorders and may be due to any of the above behavioral and cognitive issues. Lower scholastic achievement was shown to be more common in children with sleep-related breathing disorders, and vice versa. Sleep related breathing disorders were found to be more common among children in the lower range of academic performance (98-101). Recently, Beebe et al (102) studies a group of overweight children and adolescents, age 10-16 years old with SDB. These researchers were able to demonstrate an association between SDB, lower grades and behavioral issues at school. They were able to show (though not definitively) that behavior, specifically attention difficulties, were the mediator between SDB and lower school performance.
As children reach late adolescence and obtain a license to drive, increased motor vehicle accidents associated with sleep disorders occur, as is the case in adults (21).
1.2.4 Measuring Sleep
As with most medical evaluations, proper assessment of sleep in adults and children alike
requires an initial interview to obtain medical and sleep histories. These should take into account social, environmental and psychological factors (35). The information obtained is then used to determine the need and nature of further testing.
Assessment of nocturnal sleep: Polysomnography (PSG)
History and development
As noted earlier, the modern study of sleep came into being following the invention of the EEG which was used to give one of the earliest descriptions of sleep stages in 1936 (28). The addition of eye movement monitoring made the identification of REM sleep possible by Kleitman’s group in Chicago in 1953. Throughout the years, additional monitoring elements were added and about half a century passed until the term polysomnography (PSG) was given. Early technology involved heavy, cumbersome, paper-based equipment. Today PSG uses computer-based, digital recordings. This has improved the recording and analyzing abilities and has gradually
contributed to better understanding of sleep (103). Current method
The current PSG allows for the simultaneous monitoring of several body system activities using electrodes placed on the patients body and enables the interpreter to correlate events happening in one body system to those of another one (104).
− The standard PSG consists of monitoring:
− electrical brain activity, using electroencephalography (EEG)
− muscle tone using electromyography (EMG)
− heart rate using at least one lead electrocardiography (ECG)
− respiratory effort using chest wall and abdomen movement with piezoelectric belts to evaluate respiratory effort (other types of electrodes may be used for this purpose as well)
− airflow: several types of transducers are used for this. These are mainly
thermister/thermocouples (devices that sense temperature as a surrogate of airflow) and a pressure transducer (PFlo—a device that detects the fluctuations in pressure caused by inspiration and expiration).
− blood oxygen saturation, using a pulse-oximiter (a non-invasive indirect method relying on changes in light absorption)
− audio and video monitoring
− time
The data collected during the PSG is then analyzed using criteria established by Rechtschaffen and Kales 1968 (26) combined with arousal scoring rules set by the American Sleep Disorders Association position paper from 1992 (105). The recording is divided into 30 second periods, called epoch, that are viewed and manually scored by a trained individual. Sleep is staged into wake and 5 sleep stages. These are stages 1-4 (also called non-REM or NREM sleep) and REM (Rapid Eye Movement) sleep. The differentiation between the stages is made based on the type of brain waves seen on the EEG, eye movements and the chin muscle tone. The total sleep time (TST), sleep onset latency (SOL) (the time it took the patient to fall asleep), REM onset latency (the time from the beginning of the sleep period to the beginning of the first REM period) any intervening wakefulness, and percentage of time spent in each stage is calculated. Respiratory analysis, along with any movements or behavioral abnormalities completes the sleep analysis.
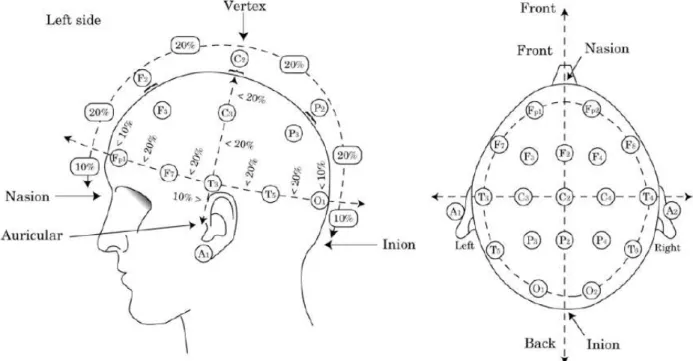
Figure 1.5: International 10-20 System used to record EEG. This method was first described by Jasper in 1958 (106), and was designed to create a reproducible method to place EEG electrodes. The letters used are: “F”,frontal lobe; “T”, temporal lobe; “C”, central lobe; “P”, parietal lobe; “O”, occipital lobe;“A”, ear. Even electrode numbers (2, 4, 6, and 8) refer to the right hemisphere and odd
electrode numbers (1, 3, 5, and 7) refer to the left hemisphere. “Z” refers to an electrode
placed on the midline. The smaller the number, the closer the position to the midline. “Fp” stands for Front polar. (The Figure was taken with permission from Avidan and Zee, 2006).
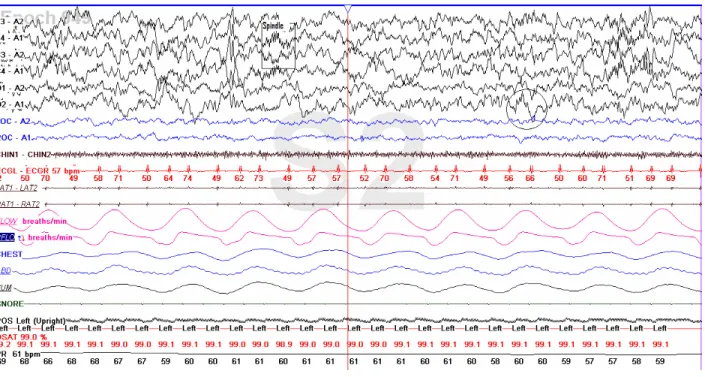
Figure 1.6:- An example of one epoch on a polysomnography recording. The first six lines (F3, F4, C3, C4, O1 and O2) represent the EEG recording. the next two lines- LOC and ROC- represent the EOG recording. EMG of the submental muscles is next (CHIN1-CHIN2) followed by the ECG recording. the next two lines- LAT and RAT are the EMG for the anterior- tibialis muscles of the legs. The next portion of the epoch screen is dominated by the big wavy graphs of the breathing channels- airflow, Pflow & respiratory effort. Next are snoring and body position. The last two graphs represent oxygen saturation heart rate measurement. (Taken with permission from a recording of an eight years old child done at the Youthdale Child and Adolesecnets Sleep Centre).
Special considerations when conducting PSG in children
There are numerous challenges in conducting reliable sleep studies in the young pediatric population (especially in babies, toddlers and pre-school children), including difficulties with fitting many electrodes on the small body of a frequently impatient child. There are compliance issues especially in toddlers. Familiarizing the child with the sleep test process beforehand is important in creating a more child-friendly sleep laboratory (talking with the child, showing the sleep laboratory and equipment to be used). Pediatric PSG scoring requires a very experienced scorer familiar with the special features existing in PSG at different ages throughout childhood (32;103). (A review of the discrete features in every age is beyond the scope of this thesis).
Assessment of daytime sleepiness
The objective and subjective assessment tools used to assess daytime sleepiness are listed below. The results of these tests do not necessarily concur. It has been suggested that they may be considered complimentary to each other as each groups measures EDS in light of a different definition (52) ( as previously discussed in section 1.2.2).
Objective measure of daytime sleepiness The Multiple Sleep Latency Test (MSLT).
This is the most widely used objective measure to assess daytime sleepiness. The MSLT is conducted after a PSG overnight study and consists of four 20 minute naps separated by 2-hour intervals starting at 1.5 to 3 hours after the participant has awakened from his overnight sleep study. Between the sessions, the participant is required to stay awake and is monitored by a technician for compliance with this instruction. During the nap sessions, the participant lies down in bed and is instructed to try to go to sleep while EEG, EOG, ECG and EMG are recorded. Sleep latency is defined as the time from lights off to the first epoch scored as any stage of sleep or at 20 minutes if no sleep occurs. If a patient falls asleep within the 20 minute nap, he/she is allowed to sleep for 15 minutes. If after 4 naps there is REM onset in only one session, then a 5th session should be performed. If there are two naps with REM onset within the first 4 naps, then there is no need for the fifth nap. A mean sleep latency (MSL) is calculated. In adults, it is generally accepted that an MSL of less than 11 minutes is considered suggestive of mild sleepiness, between 8-5 minutes moderate sleepiness and a mean sleep latency of less than 5 minutes suggests severe sleepiness1 (54;107;108).
Despite its wide popularity as an objective measure of EDS, the MSLT is also subject to criticism. The most basic argument revolves around what exactly does the MSLT measures. Is
1
A clear classification of what is mild, moderate and severe objective sleepiness is described in the 1st edition of the International Classification of Sleep Disorders (ICSD), but is absent from the current (2nd) edition. That
classification describes the level of sleepiness in relation to the level of physical activity and attention needed during the activity in which a daytime sleep episode occur, the frequency in which sleep episode occur and the impact of these episodes on the person’s occupational and social function.
measuring a subject’s ability to fall asleep- or sleep propensity- is enough to encompass the entire scope of sleepiness? Does the ability to fall asleep under isolated and “ideal” conditions that usually do not occur in day-to-day life represent sleepiness? Johns argues that looking at sleep propensity alone in a specific situation is a too narrow approach to EDS, and suggests that the questionnaire developed and validated by him- the Epworth Sleepiness Scale- has a wider and better view of daytime sleepiness(109). The MSLT results may be influenced by sleep restriction or longer than usual sleep duration in the days prior to the test (regretfully objective monitoring of sleep schedule with actigraphy prior to the MSLT is relatively rare in clinical practice) (52).
These rules defining the severity of daytime sleepiness per the MSLT are generally agreed upon for adults, but some dispute still exists. Johns argues that EDS on the MSLT should be noted only when MSL is lower then 3.2 minutes (110). If this criterion is correct then the MSLT’s ability to discriminate between levels of sleepiness is highly questionable. Others suggest an even higher cut-off point, an MSL of 13 and below considered indicative of mild EDS (111). Indeed clinical practice indicates that the wider definition may be a more valid one (Colin Shapiro-personal communication, 2010).
However, in the pediatric population the criteria for categorization of EDS on the MSLT are even less clear. In children and adolescents there is insufficient research to establish such
normative MSLT criteria. One reason may be the differences in MSLT protocols used in term of nap length (20 or 30 minutes). That may give a different impression as to what is normal. For example, a few studies in pre-pubertal children using nap lengths of more than 20 minutes showed mean MSL values ranging from 21 to 28 minutes(10;112;113) while research using shorter nap times showed a mean MSL of approximately 18 minutes (114). This shorter mean MSL may be the result of a ‘ceiling effect’ created by a nap opportunity that was too short. In addition, it has been shown that MSL varies in children at different stages of puberty with children in earlier stages of puberty having longer MSL than adolescents at the end of puberty (115). Our clinic has initiated a study of MSLT norms in the pediatric population. Since commencing this study we have become aware that Gozal’s group in Chicago have a large database of MSLTs in normal children (i.e. without sleep disorders) and we eagerly await the publication of pediatric norms.
In light of the comment cited above, it is logical to assume that one should not use the same MSL value to define subjective EDS for all children regardless of pubertal stage and age. This point is demonstrated well by Kotagal and Goulding in their review of the literature about sleepiness measurements in children (116). Their example shows how a decrease in MSL by the same percentage would give a different MSL value for a child in the first stages of puberty compared to a child who has completed the pubertal process. It renders the former not excessively sleepy and the latter as excessively sleepy by the standardized adult criteria (116).
Another confounding factor in the utility of the MSLT in children is age. Given that 5-year-old children may still need a daytime nap, makes interpretation of MSLT results at this age very problematic(108).
Due to this uncertainty and based on clinical impression and personal communications with specialists in the field of pediatric sleep analysis, our laboratory defines MSLT results as ‘abnormal’ if the MSL is under 16 minutes for children 13 years and older or under 19 minutes for children under 13 years of age (based on the longer normative MSL in pre- or early pubertal children)(116;117).
Subjective measures of daytime sleepiness
There are a few validated scales and questionnaires designed to detect the level of daytime sleepiness in adults (52). The most popular and widely used is the Epworth Sleepiness Scale (ESS), although its correlation with the MSLT has been questioned (ranging from no correlation found at all to a week negative correlation of r=-0.37) (52;58;110;118). In children and
adolescents even fewer questionnaires have been carefully investigated (60;61;119;120). Table 1.4 summarizes the various scales and questionnaires used in paediatric sleep assessment.
Table 1.4: Assessment of subjective daytime sleepiness in children and adolescents * Epworth sleepiness scale (ESS) (121) Paediatric daytime sleepiness scale (PDSS) (61) Children Sleep Habit Questionnaire (CSHQ) (60) Paediatric Sleep Questionnaire-Sleepiness Scale (PSQ-SS) (59) School Sleep Habits Survey (SSHS) (122) Cleveland Adolescents Sleepiness Questionnaire (CASQ) (120) Year of first publication 1991 2003 2000 2000 1998 2007 Validation + in adults + + + + + Target age (years) adults 11-15 4-12 2-18 13-19 11-17 Completed by: Adult, or child in modified un-validated versions
Child Parent Parent Child Child
*These questionnaires are shown in appendix C, for the purpose of providing a more comprehensive review of this aspect.
The ESS has only been validated for use in adults and contains questions that may be
inappropriate for young children (e.g. driving a car). Scales completed by parents may have reliability issues, especially in adolescents. All self-completed questionnaires have a somewhat limited target age range. An interesting attempt to create a pictorial sleepiness scale has been reported by a group in South Africa which may be of potential use in children since it does not require literacy skills, but more research is needed (123).
At the Youthdale Child and Adolescents Sleep Centre, the Pediatric Daytime Sleepiness Scale (PDSS) for children 15 years old and under (61) and the Epworth Sleepiness Scale (ESS) for older adolescents (110) are used to aid in the evaluation of daytime sleepiness. In our view, there are currently no superior tools available for assessment of subjective pediatric daytime
Miscellaneous methods to assess daytime sleepiness
There are several additional methods that have been experimented with to assess daytime sleepiness in adults. These methods are not widely used due to the complexity of execution or due to lack of validity. To date, none of these have been used for the purpose of evaluating EDS in children or adolescents.
− Pupillometry- This method is based on the finding that a larger variability in pupil diameter is present with sleepiness. The patient is seated in a dark room and asked to keep a fixed gaze on a red target. Pupil diameter is then measured by infrared light. This method was found to poorly correlate with the MSLT and to lack discrimination between levels of sleepiness (124).
− Evoked Potential- This method measures the changes in EEG evoked potentials, usually in response to auditory stimulus. It is not widely used mainly due to large inter-subject variability (125).
− Alpha Attenuation Test- EEG alpha waves decrease when the eyes are closed and increase with eyes open. The patient is seated in a lighted room and asked to alternate between open and closed eyes, remaining a whole minute in each state. This is repeated 8 times. By measuring the differences in EEG alpha power between these two states in a controlled manner an alpha attenuation coefficient is calculated. A good correlation with the MSLT has been found. However, due to the small samples studied there is a need for a greater number of larger studies in order to validate this methods (126). This test is shorter in time to complete and may have particular utility in children but this remains to be evaluated.
− Cognitive and psychometric testing- This is an indirect approach to evaluate EDS and therefore less reliable. It is based on the observation that cognitive and psychomotor performance deteriorate when EDS is present. However, a wide variability in patients performance on these test has been observed, making this a poor measure for EDS (127).
Evaluation of sleep circadian rhythm disorders
Dim Light Melatonin Onset
The presence of circadian rhythm disorder can be assessed through measurements of melatonin secretion (42;128) which is accurate but is also both labour intensive and costly. In order to measure the natural rhythm of melatonin secretion without the suppressive impact of artificial light, individuals are kept in a dim lit environment from about 2 hours prior to the common melatonin secretion onset time. Melatonin is measured hourly throughout the night by the collection of saliva samples which have been found to reliably represent circulating melatonin levels (42). While this technique, called the dim light melatonin onset (DLMO) test is highly reliable, it is very labour intensive and somewhat uncomfortable for the tested subject (subjects are awake, can listen to music, but are not allowed to have light so they cannot read, watch television or play video games).
An indirect measure of the sleep-wake cycle can be achieved using actigraphy. An actigraph is a small device resembling a wrist watch that is usually worn on the wrist. The device senses movement and so activity/non-activity periods are recorded. Besides estimating the sleep-wake cycle of an individual, it can also be used to evaluate daytime sleepiness, usually as an adjuvant to PSG and MSLT. A sleep diary will be completed in conjunction with the actigraph to help determine lights-off and lights-on times on the actigraphy recording (129).
Conducting two PSG- one on the preferred “delayed schedule” and another on an enforced conventional schedule- can provide supporting evidence for DSPS. If the findings show normal sleep analysis on the preferred schedule while on the enforced schedule sleep onset latency is dramatically increased, then the diagnosis of DSPS is supported (4;41).
1.3 Childhood Obesity
Obesity is defined as a state of excess body fat (130). The presence of excess fat impairs the functioning of many important organs and can lead to adverse health problems effecting almost every body system (131).
1.3.1 Measurements
There are several methods used to evaluate overweight and obesity in general:
−
Calculating the Body Mass Index (BMI) using measured weight and height.−
Skin-fold thickness as a measure of body fatness. This technique is relatively fast and inexpensive; however, measurements have been noted to vary widely between measurers.−
Hydro-densitometry- underwater weighing. This method relies on the lower density of fat tissue compared to bone and muscle tissue, which is responsible to different weight reading in and out of water.−
Air-displaced phethysmography- relying on a similar principle as the above notedmethod, but with measurement of the amount of air displaced after a person is seated in a closed container for 20 seconds.
−
Imaging techniques such as Computed Tomography or Magnetic Resonance Imaging or Dual Energy X-ray Absorptiometry (DEXA) to evaluate total body or regional fat.−
Bio-electrical impedance. This method measures fat free body mass and a calculation of fat mass can be extrapolated.−
Total body potassium- A rarely available technique of measuring total body potassium levels based on the amount of naturally occurring radioactive potassium detected using a whole body counter. This again is a measurement of lean body mass by which fat body mass can be calculated (132).The BMI is calculated by dividing weight in kilograms by the squared height in meters (kg/m2). It is an easy and cost-effective method and is used in clinical practice. The other listed methods are generally more difficult to perform (both from the measured and the measurer perspective) and may require training and experience, and involve expensive equipment (133-135). The BMI is limited by not being specific to fat tissue. High weight can be a result of high muscle tissue percentage, in which case the BMI will be increased in spite of actual low body fat percentage. Nonetheless, the use of BMI was noted as being reliable because it correlates with other measures of excess fat tissue and weight related complications, as well as being simple to use (133).
Defining a uniform measure for overweight and obesity in children is complicated due to wide changes in body morphology influenced by age and gender. There are several internationally agreed cut-off points to define overweight and obesity in children (136). Due to age and gender differences in weight and height in children and adolescents, the BMI percentile (BMI%) is a better indicator of overweight and obesity. Children who are at or above the 85th percentile and are below the 95th percentile are considered overweight. Those at or above the 95th percentile are considered obese (134;137). Charts plotting BMI% for age (figure 1.7) and gender based on USA data are available from the Center for Disease Control (138). This can be used for Canadian youth as the general prevalence of overweight and obesity is similar between Canada and the USA (2).
1.3.2 Prevalence of childhood obesity
The prevalence of childhood obesity has been rising substantially over the last three decades around the world (131;136;139). This rise has been documented in industrialized countries as well as in urban centers of developing countries. North and South America are leading this trend with as many as 46% of school-aged children estimated to be overweight and obese as of 2010 (139).
In Canada, over the past 25 years the rate of overweight in children and adolescents (2-17 years old) has increased from 12% to 18% and the rate of obesity has almost tripled from 3% to 8% in. This means that over a quarter of Canadian children and adolescents are currently overweight or obese. This increase is generated mainly by children over the age of 12 years old. The rates of overweight and obesity vary between ethnic groups with Aboriginal youth having the highest rates and South and East Asian youth showing the lowest rates (2;140).
1.3.3 Consequences of childhood obesity
There are many serious physiological and psychological conditions associated with pediatric obesity (Figure 1.8). These complication may be evident in children as young as 5 years old (2). While some conditions promoted by childhood obesity are specific to the pediatric population (e.g slipped capital femoral epiphysis) others used to be considered as diseases of adulthood. Examples of the latter are conditions such as the metabolic syndrome (co-existence of glucose regulation abnormalities, hypertension and dislipidemia) and type 2 diabetes mellitus that have in recent years been reported to appear in obese children (131;137;141-143). Low vitamin D and iron deficiency anemia are more common among obese children and pubertal changes including bone maturation are accelerated in this population(137).
Childhood obesity increases the risk of developing cardiovascular disease in the adult years and a relationship between childhood obesity and mortality during adulthood has also been no