Cost Estimation for Web Applications
Melanie Ruhe
1Siemens AG,
Corporate Technology,
Software Engineering 3
80730 Munich, Germany
[email protected]Ross Jeffery
University of New South Wales
School of Computer Science and
Engineering and CAESER
Sydney, 2052, Australia
Isabella Wieczorek
1Federal Ministry of
Education and Research
53170 Bonn, Germany
Abstract
In this paper, we investigate the application of the COBRATM
method (Cost Estimation, Benchmarking, and Risk Assessment) in a new application domain, the area of web development. COBRA combines expert knowledge with data on a small number of projects to develop cost estimation models, which can also be used for risk analysis and benchmarking purposes. We modified and applied the method to the web applications of a small Australian company, specializing in web development. In this paper we present the modifications made to the COBRA method and results of applying the method. In our study, using data on twelve web applications, the estimates derived from our Web-COBRA model showed a Mean Magnitude of Relative Error (MMRE) of 0.17. This result significantly outperformed expert estimates from Allette Systems (MMRE 0.37). A result comparable to Web-COBRA was obtained when applying ordinary least squares regression with size in terms of Web Objects as an independent variable (MMRE 0.23).
1.
Introduction
With the growing importance of web applications in general business matters, many practitioners see the measurement of web applications as a particularly valuable area of ongoing commercially relevant research. The success of web applications used to be determined by being first-to-market. Nowadays, the quality of software has become an important driver for competitiveness. Quality software applications require appropriate software development and project management processes. For project managers, cost estimation is one of the crucial steps at the beginning of any new software project. Accurate cost estimates are an essential element for being able to provide competitive bids and remaining successful in the market. Over- and underestimates of the expected costs have a significant influence on a company’s reputation and competitiveness. Industry still reports difficulties with determining accurate cost estimates, even though the research on software cost estimation methods started already in the early 1960’s.
Within the last decades a wealth of research focused on developing accurate cost estimation models. However, surveys indicate that only very few organizations actually use them [20]. There are a number of practically relevant reasons for not using cost estimation models: Many cost estimation models are not very accurate [6]. Experience shows that model-based estimates do not perform considerably better than estimates solely based on expert judgement.
Another reason for the rare use of cost estimation models in practice is the lack of sufficient, explicit past project data to systematically build a cost estimation model. Many organizations do not have enough resources for the required measurement methods and tools. Data collection is a time-consuming process that needs to be carefully planned, because consistency and completeness are two key drivers for the usefulness of the data for effort estimation. Only data on recent projects allows for cost estimation research that is meaningful for current projects.
Another reason for the modest use of cost estimation models is the appropriate assessment of the size of a software product. The size of a software product is accepted as a key cost driver for development effort, but it requires precise measurement methods and adequate measures, which are often missing in industry.
Finally, many cost estimation models are based on standard and/or black box methods to derive a cost estimate. The lack of transparency in many cost estimation methods does not allow sufficient calibration to an organization’s specific needs.
The COBRATM (Cost Estimation Benchmarking and Risk
Analysis2) method provides a means for developing a transparent
cost estimation model when using project data internal to an organization. COBRA is a composite estimation method that utilizes expert knowledge and a limited amount of past project data to predict a project’s development effort, as well as to assess the quantitative risks associated with the project. The first application of the method in the MIS context showed a very promising result achieving a Mean Magnitude of Relative Error (MMRE) of 0.09 [1].
The overall purpose of this study is to assess whether the COBRA method is appropriate for accurately estimating development effort of web applications in the context of a small company.
We investigated the appropriateness of the COBRA method in terms of two aspects: (1) To our knowledge, the COBRA method has not yet been applied to small-sized software development companies. However, it is extremely important to derive accurate cost estimates for these types of companies. Furthermore, small organizations are different from large organizations. Thus, refinements of the COBRA method to address specific needs of small companies might be required. (2) We applied the COBRA method in a new application domain, the area of web development. We know practical details about the biggest web development companies such as Microsoft and Netscape, but small niche companies develop the vast majority of
1This study was performed while Melanie Ruhe was a student at the University of Kaiserslautern and Isabella Wieczorek with the Fraunhofer Institute for Experimental Software Engineering (IESE).
2COBRA is a registered trademark of the Fraunhofer Institute for Experimental Software Engineering (IESE), Germany.
Internet software [5]. Many start-up companies developing web applications suffer from underestimating the cost of a new project. Ad-hoc approaches that could be applied in the beginning of web development do not work for larger web applications.
In this study we investigated whether we could repeat the encouraging results from the first publication of the method [1]. Firstly, we adapted and applied COBRA to data collected from twelve web applications that were recently developed at a small Australian company, called Allette Systems. We then compared the derived model to the results initially published in the study by Briand et al. [1]. Furthermore, we investigated our results in comparison to the results obtained from applying ordinary least squares (OLS) regression as well as expert-based estimates to the projects developed at Allette. Consistent to the work of Briand et al., the developed model is validated using n-fold cross-validation [8].
The paper starts with a discussion of related work in Section 2, then presents our research method in Section 3, including the description of the data set, the modeling techniques and the validation criteria. The results of the case study are presented and discussed in Section 4. Section 5 finishes the paper with a summary of the results and stresses some further important conclusions from our results.
2.
Related Work
We reviewed the literature with regards to three different aspects: (1) What has been achieved by empirical research studies on cost estimation within the last fifteen years? (2) What distinguishes COBRA from traditional cost estimation methods? (3) What research has been performed in the area of cost estimation for web development projects?
2.1.
Empirical Research
The results of the most relevant empirical studies in the field of software cost estimation are described in the Encyclopedia of Software Engineering [6]. Existing cost estimation methods could be categorized according to Figure 1. Their strengths and weaknesses are summarized in [6].
Figure 1. Effort Estimation Method Classification
Non-model based estimation methods (expert knowledge) consist of one or more estimation techniques together with a specification of how to apply them in a certain context. These methods are not involving any model building but just direct estimation. They require heavy involvement of experts to generate an estimate for every new project.
Model-based estimation methods (cost estimation tools) involve at least one modeling method, one model, and one model application method. An effort estimation model usually takes a
number of inputs (e.g. a size estimate, cost factors) and produces an effort point estimate or distribution. In contrast to non-model-based estimation methods, model-non-model-based methods are not dependent on individual’s capabilities but require past project data for the model building. Examples are OLS regression, the Constructive Cost Model (COCOMO), and Classification and Regression Trees (CART).
The so-called composite methods combine both of the above approaches by incorporating expert knowledge in the model building process. Composite methods usually do not require as much data as common model-based methods. Examples are Analogy [11] and COBRA [1].
The prediction accuracy of many empirical studies performed within the last fifteen years was reviewed [6, 22]. A high-level summary of the results is presented in Table 1, but only the six mostly applied estimation methods are considered. The averaged MRE values have to be interpreted with care however, because some results are obtained by tailoring the method to a specific context whereas in other studies no tailoring was performed. The numbers are used to give an overview of the results of empirical research in the area of software cost estimation.
Table 1. Descriptive Statistics of Estimation Methods Accuracy Number of Studies Mini mum MMRE Maxi mum MMRE Average MMRE Std. Dev. EXPERT 4 0.31 1.68 0.68 0.67 COCOMO 10 0.19 7.58 3.08 3.12 OLS 18 0.10 1.27 0.69 0.33 CART 5 0.47 3.64 1.19 1.37 ANOVA 3 0.42 0.57 0.48 0.08 ANALOGY 9 0.28 1.45 0.61 0.38
In general, we can conclude that stepwise analysis of variance (ANOVA) performed best considering the average MMRE. OLS regression performed considerably well compared to many other methods. Studies evaluating CART consider this type of models as a good alternative, because of their simplicity, but they seem to provide mixed results.
Analogy performed best, in 60% of the cases reported in published studies. In 30% of the cases it showed the worst predictive accuracy, hence suggesting some instability. Analogy obtained best results when using adaptation rules and heuristics to identify significant variables to measure similarity. A fully automated version of Analogy is more likely to yield good results when used on small data sets with a small number of variables. In this case, a comprehensive search for optimal similarity functions can be performed [23].
Expert judgement (EXPERT) may achieve highly accurate estimates, when being supported by a tool or combined with other cost estimation methods (e.g., analogy, regression). Using solely non-model based methods may lead to very inaccurate predictions. People also tend to underestimate the time required to do a task when they themselves are to do the work [28]. This is confirmed on small tasks by other researchers, while for larger tasks an overestimation has been observed. However, it has also been reported that bottom-up estimation helped predict projects within 6% of their scheduled dates and costs [29].
Boehm validated his COCOMO model in the 1970’s on his TRW data set using the prediction level as an evaluation measure. He obtained very good results for intermediate and detailed
Estimation Methods
Expert Knowledge Cost Estimation Tools
COCOMO, and quite poor ones for the basic COCOMO. Independent evaluations performed on other data sets have not always produced such good results. In general, the accuracy in terms of MMRE ranges form very high (i.e., 0.19) to very poor (i.e., 7.58). It was found that intermediate and detailed COCOMO do not necessarily improve the estimates and that the model systematically over-estimates effort [24]. Other studies found a bias towards underestimating effort when using COCOMO. Intermediate and detailed COCOMO may suffer from over-fitting problems. No publicly available results exist so far about the performance of COCOMO II compared to other estimation methods. Affiliate organizations are currently using COCOMO II. The COCOMO versions generated in ’97 and ’98 were compared with each other. It turned out that the calibration of COCOMO II by incorporating expert knowledge using Bayesian Statistics reached promising results outperforming the COCOMO II version 97 [21].
Despite the fact, that some methods obtained better results than others, very rarely studies obtained good results according to Conte’s evaluation criteria [2]. Composite estimation methods, especially Analogy, grew of interest in the last couple of years because of perceived higher prediction accuracy and acceptance in industry [11]. The initially published application of COBRA was very successful in the context of a large German software development company. As reported, COBRA performed much better than commonly reported results [1]. The MMRE obtained through a cross validation was 0.09, which is very encouraging, though just an initial result. The method was, neither replicated so far, nor was it compared to standard methods, such as OLS regression or any other method.
2.2.
The COBRA method
The COBRA method represents a framework of activities for developing a tailored COBRA model. Each COBRA model consists of two main components. The first component is the causal model that produces a cost overhead estimate. The causal model consists of factors affecting the cost of projects within a local environment (cost-drivers). They are characteristics of the project that are expected to significantly influence effort. The causal model is obtained through expert knowledge acquisition.
Project Team Capabilities
-+
+
Requirements Volatility Reliability Requirements Customer Participation CostFigure 2. Causal Model Example
An example is shown in Figure 2. The arrows indicate direct relationships. A “+” and a “-” indicate positive and negative relationships, respectively. Where one arrow points to another this indicates an interaction.
This qualitative information is quantified using expert opinion. The quantification is the percentage of cost overhead above that of a nominal project. Experts have to compare in mind a nominal / optimal (i.e. a project running under optimal conditions) with a worst case project and estimate the additional
cost in per cent, the cost overhead. Its uncertainty is captured for all relationships in the causal model using variables that underlie triangular distributions.
The second component of COBRA uses data from past projects that are similar according to specified project characteristics. The past project data is used to determine the relationship between cost overhead and cost. Note that this is a simple bivariate relationship that does not require a large amount of data, which explains why COBRA does not have demanding data requirements as opposed to data-driven methods.
Running Monte Carlo Simulation, the determined relationship between cost overhead and cost together with the causal model are utilized to build the COBRA model and to derive a probability distribution of effort for new projects. The probability distribution of effort can be used for various project management activities, such as cost estimation, risk assessment, and benchmarking [1].
In order to evaluate the probability that a project will be over budget, one can generate the descending cumulative cost overhead distribution for the actual project (Figure 3).
P R O B A B I L I T Y 0.00 0.20 0.40 0.60 0.80 1.00 1095 Cost Overhead
Figure 3. Cumulative Distribution Example
Let us assume that the available budget for a project is 1100 Units and that this project’s cost overhead is characterized by the distribution in Figure 3. There is roughly a 80% probability that the project will stay within budget (i.e. a 20% probability to overrun 1095 units). If this probability represents an acceptable risk in a particular context, the project budget may be approved.
The advantages of COBRA over many other cost estimation methods is its applicability in environments with only little project data available. Moreover, COBRA is not restricted to a specific size measure. COBRA is more likely to be accepted in practice as the models provided are rooted to the experts’ own experience that is accessible, reusable and transparent to other people. The method provides a mechanism for developing a tailored cost estimation model, thus increasing prediction accuracy. A detailed description of the COBRA method is given in [1, 26].
2.3.
Web Estimation
While reviewing the literature for relevant methods in the area of web estimation, we distinguished between web hypermedia systems and web applications [10]. Web applications are technically distinct from web hypermedia systems since the user has the ability to affect the state of the system on the web server, where the business logic is implemented [12]. Hypermedia systems are much easier to predict than web applications, because web hypermedia systems are usually much smaller in terms of the expended development effort. Consequently, web applications are
much more complex to develop and manage than web hypermedia systems. Thus, the focus of interest for this study is the estimation of web applications.
The literature and practical experience on web development has reported differences between traditional software applications and web applications. Web applications usually change more often in terms of their requirements, contents, and functionality than traditional software systems. In order to successfully develop and maintain quality web applications, a disciplined approach needs to be followed and better development tools need to be established. Standard software engineering approaches seem limited and cannot appropriately address all the challenges related to web development. Therefore, recent publications stress the need for web engineering and web estimation [3, 9, 15]. Web engineering is similar to software engineering, but identifies more tailored methods and techniques for web development. This is due to the fast evolution of technologies in this area combined with the little documented experience.
To our knowledge, there is only one example in the literature that investigated effort prediction models for web applications: Reifer introduced a cost estimation model called Web model (WebMo) [3, 4]. It adapts the COCOMO II model [21] to the context of web development mainly revising the COCOMO II cost factors. WebMo is based on past project data from 64 web applications, nine cost factors, and the software size measured in Web Objects. Regression analysis was applied to determine the cost estimates. The model has been calibrated and predicted “within 20% of the actual experience at least 68% of the time”. However, the results of the remaining 32% estimates are not reported at all.
More research has been done on estimating effort for web hypermedia systems [9, 10], but as mentioned before, this type of web system is very different from typical web applications in terms of cost estimation issues.
3.
Research Method
This research is designed as a case study. The estimation of web applications is a very new research area with only a few experiences. Thus, we firstly need to gain comprehensive knowledge about the development techniques in small web development start-ups. Case studies are seen as an ideal method for achieving inside information about a new area of interest.
3.1.
Data Set
Allette Systems is a small Australian software development company, with about twenty employees. The company’s main business is to develop web-based systems. Due to the projects’ diversity, we categorized them in order to find a suitable, homogenous subset of projects for the COBRA application.
Project managers of Allette Systems were asked to characterize their software applications in terms of functionality, and a given categorization schema. Based on the analysis of the survey responses, we used the projects categorized as web applications for our study. The project managers of this type of projects were briefly interviewed to ensure that the identified projects were similar according to predefined subjective and objective characteristics, such as functionality, target platform, or complexity. Finally, twelve typical web applications were
assessed as appropriate projects according to the requirements of the COBRA method.
The considered web applications were developed between 1998 and 2002. The web applications were very typical: financial/trading, business-to-business, and intranet applications. Nine, one, and two projects were new developments, enhancements, and re-development projects, respectively.
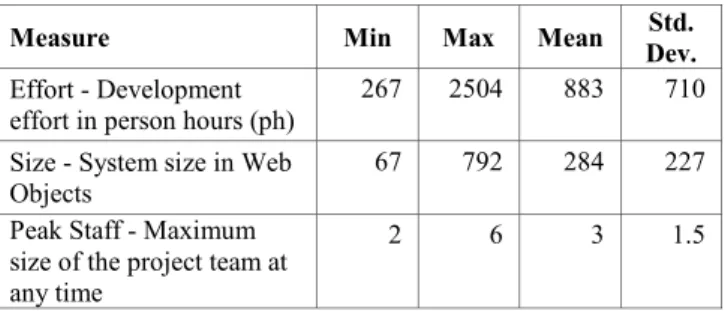
Table 2 presents the descriptive statistics of the general project information of the twelve Web-COBRA projects.
Table 2. Descriptive Statistics
Measure Min Max Mean Dev.Std.
Effort - Development
effort in person hours (ph) 267 2504 883 710 Size - System size in Web
Objects
67 792 284 227 Peak Staff - Maximum
size of the project team at any time
2 6 3 1.5
The development effort spent on web applications at Allette Systems seems to be significantly higher than published effort results on web hypermedia systems (between 58 and 154 ph) [10]. Furthermore, the data collected at Allette Systems shows much higher data dispersion (710 ph) compared to the data on web hypermedia systems (26 ph). The comparison of development effort required confirms the difference in complexity between web applications and web hypermedia systems.
We measured system size using Web Objects introduced by Reifer. [3]. Web Objects are an extension of the traditional Function Points [16], addressing the needs of web development. So far, to our knowledge, no other alternative size measure for web applications has been published or initially validated.
The peak staff numbers at Allette Systems are in line with the published numbers for team size in the area of web development, which are usually small [4].
3.2.
Adaptation of COBRA
The COBRA method has been modified due to the needs of a typical web development company. In the following, we outline the steps to develop our Web-COBRA model and point out the differences to the original COBRATM method [1].
3.2.1.Refinements of the COBRA Method
Firstly, COBRA requires the identification of most important cost factors in a certain environment. In contrast to the first application of COBRA, web development as a new area of research has only few reported experiences. Hence, the literature does not provide experience on potential cost factors for this application domain. Instead of using the list of traditional cost factors and adjusting the definitions based on the expert’s comments, we decided to perform personal interviews with the experts of Allette Systems using open questions [19]. We identified five experts for the interviews and provided each of them with high-level definitions of groups of cost factors related to the software product, the personnel, the software project, and the process. During the interviews the expert explained his/her specific experience with cost factors corresponding to each of the
groups. This process ensured that only cost factors relevant to the area of web development were explored.
Secondly, a qualitative causal model needed to be developed. In contrast to the previous work, only direct relationships of cost factors with cost were modeled. Beside the increased complexity of the model, another drawback of modeling interactions is the necessity to ensure a common understanding among the experts of each interaction, which is not always the case. The literature does not provide adequate interview techniques for these purposes. Moreover, so far it has not been validated, whether the required additional effort to model interactions pays off and drastically improves prediction accuracy. In our study, we avoided interactions by deriving a minimal set of independent cost factors. From the authors point of view, this decision also contributes to a higher transparency of the cost estimation model. Therefore, dependent cost factors were either excluded from the causal model or their definition was adapted to ensure the orthogonality with other cost factors.
Finally, we refined the quantification of the relationships within the causal model. The previous study used a questionnaire to collect the cost overhead multipliers. In this study we performed personal interviews with Allette Systems experts to obtain the multipliers. In the previous study, an outlier analysis was performed to detect and exclude outlying multipliers. In our study, the group of experts discussed their understanding of the cost factors and the multipliers together to improve and validate the quantitative causal model. This additional step in the COBRA development process ensured that the initial multipliers were revised in terms of outliers. Therefore, no outlier analysis was performed.
In order to aggregate the multiple answers for cost overhead estimates, in the previous study alternative ways of aggregation were proposed selecting always the answer of a single expert (e.g., in each simulation run, the expert answers for each cost factor were randomly selected). In our study, we used a measure of central tendency. There are two common ways of determining the central tendency for the distribution of the data: The mean, defined as the average value, and the median, defined as the middle-most value in a set of data [19]. The median is generally more robust towards outliers. We decided to use the mean as a representative value, because outliers in the cost overhead data were excluded in the group discussion. Furthermore, weights can be used in order to take into account the different degrees of experience of the experts. No weights were used, because the experts from Allette Systems had a very similar experience. Consequently, in each simulation step each expert opinion was equally taken into account.
3.2.2.Sizing of Web Applications
An early effort estimate can only be derived from COBRA if size can be measured early on in the software development process. Therefore the literature was reviewed for a problem-oriented size measure for web-based software applications. Web Objects were chosen as the most appropriate size measure in the context of Allette Systems. In contrast to other proposed size measures for web applications, Web Objects are measurable just using the systems requirements [3]. The counting of COSMIC Full Function Points, for instance, requires at least the systems architecture [17]. Furthermore, COSMIC Full Function points are not specifically designed for web applications, whereas Web Objects are specifically tailored for web applications. Describing the full details of the work performed pertaining the sizing of web
applications is beyond the scope of this paper. The interested reader is referred to a forthcoming paper on that topic.
3.3.
Validation Method
3.3.1.Compared Techniques
The following three techniques are used to validate the cost estimation model.
Web-COBRA
We applied the COBRA method as described in the previous section. The system size within Web-COBRA was modelled as an uncertain variable, which underlies a triangular distribution. This decision was made to also reveal the uncertainty in the size estimation. The Web Object counting is a subjective way of measuring size, for which not much experience exists so far. In the Web-COBRA model, an uncertainty of 5% was used.
Ordinary Least Squares Regression
OLS regression is the most common modelling technique applied to software cost estimation [6]. Regression modelling is one of the most widely used statistical modelling technique for fitting a response (dependent) variable as a function of predictor (independent) variable(s). We used development effort as a dependent variable and size measured in Web Objects as an independent variable. As the data was normally distributed we used a linear model specification [8].
Allette Systems Informal Method
Allette Systems previously applied an informal method to predict development effort for web applications. The method involves the structural decomposition of a system into basic components, which are familiar in terms of estimating effort. The project managers of Allette Systems then compare the basic components with similar work that has been done and estimate the component using personal memory. The final estimate is derived by aggregating the components.
The effort estimate of Allette Systems is documented in their timesheet system. It does not necessarily represent the initial estimate, because additional tasks might be added later on in the project and effort is adjusted accordingly. The system does not mark additional tasks. Thus, the “real” initial estimates are not known for all projects.
3.3.2.Cross Validation
If one constructs a cost estimation model using a particular data set, and then computes the accuracy of the model using the same data set, the accuracy evaluation will be optimistic [11]. To avoid this, we applied a procedure known as cross-validation approach. Cross validation is a common way of validating a cost estimation model. The basic idea is to use different subsets for model building (training sets) and model evaluation (test sets).
In our case there are twelve projects in the database and each cross validation step uses eleven projects as a training set to build a new model and apply it to the remaining project (test set). Thus, a separate model is built for each of the twelve training-test-set combinations.
3.3.3.Evaluation Criteria
The estimates are compared with the actual effort by calculating the magnitude of relative error (MRE). This is a commonly used measure for the evaluation of estimation models
[2]. The magnitude of relative error as a percentage of the actual effort for a project, is defined as:
ACTUAL ESTIMATED ACTUAL Effort Effort Effort -= MRE
The MRE is calculated for each project in the data sets. Either the mean MRE (MMRE) or median MRE aggregates the multiple observations.
In addition, we used the prediction level Pred. This measure is often used in the literature and is a proportion of observations for a given level of accuracy:
N k l)=
( Pred
Where, N is the total number of observations, and k the number of observations with an MRE less than or equal to l. A common value for l is 0.25, which is used for this study as well. The Pred(0.25) gives the percentage of projects that were predicted with an MRE equal or less than 0.25.
Conte et al. [2] suggest an acceptable threshold value for the mean MRE to be less than 0.25 and for Pred (0.25) greater or equal than 0.75. In general, the accuracy of an estimation technique is proportional to the Pred (0.25) and inversely proportional to the MRE and the mean MRE.
We also used box-plots of residuals to graphically illustrate under- or overestimation for each estimation method.
The estimates obtained from the different methods were compared and it was tested whether the prediction accuracy of one method was significantly different from another method using a t-test [8].
4.
Results and Discussion
The expert interviews revealed thirty-five potential cost factors in the area of web development, some of them are very similar to traditional cost factors, other cost factors are new. The ranking of the factors supplied the most important cost factors in the context of Allette Systems. A finally approved list of nine most important cost factors was approved at Allette Systems.
Table 3 lists the cost factors in the left column. A very high range was obtained between the minimum and the maximum cost overhead for the factors “Requirements Volatility” and “Importance of Project Management”. This indicated the highest uncertainty for these two factors.
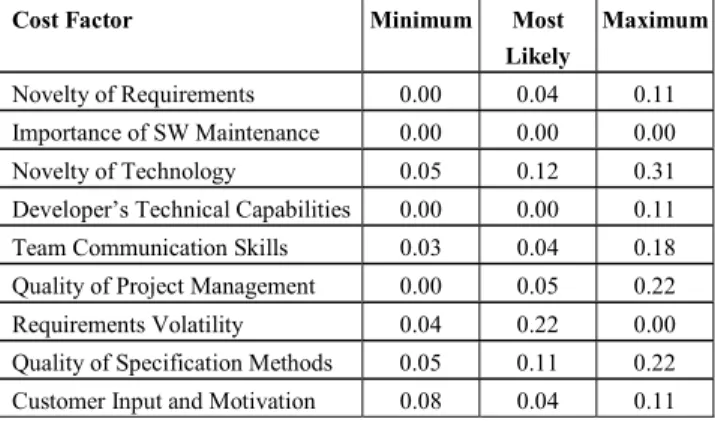
The results of the interviews for the quantification of the causal model were analyzed regarding the given cost overhead estimates (in per cent). Table 3 presents the standard deviations of the cost overhead estimates given by the five experts of Allette Systems.
Table 3. Std. Deviation after Personal Interviews
Cost Factor Minimum Most
Likely
Maximum
Novelty of Requirements 0.10 0.15 0.11 Importance of SW Maintenance 0.19 0.24 0.53
Novelty of Technology 0.11 0.36 1.35
Developer’s Technical Capabilities 0.18 0.27 0.68 Team Communication Skills 0.10 0.16 0.27 Quality of Project Management 0.14 0.29 0.61 Requirements Volatility 0.15 0.24 0.59
Quality of Specification Methods 0.14 0.19 0.30 Customer Participation 0.12 0.14 0.35
Table 3 indicates high variance in the estimates for some of the cost factors: “Importance of Software Maintenance”, “Novelty of Technology”, “Developer’s Technical Capabilities”, “Quality of Project Management”, and “Requirements Volatility”. Especially the maximum cost overhead shows a wide response range between the five experts.
While exploring reasons for this behavior, two options appeared: there is high variance in the expert’s experience or there is a high variance in the understanding and interpretation of the cost factor definitions. In order to further investigate the situation, a group discussion with all five experts was performed. The goal of the meeting was to achieve a common understanding of the cost factors and estimate the cost overhead of each cost factor based on this. The discussion was guided in a way that avoided convergence. Each expert had to explain his/her understanding of the cost factor and estimate cost overhead.
From the experience of this group discussion we can give evidence that even though we carefully defined and tailored the cost factors to Allette Systems needs, experts still interpreted the definitions very differently in the personal interviews. Consequently, the cost overhead estimates showed a high variance. In the group discussion we came to an agreed understanding of the meaning of each cost factor and adjusted the definitions accordingly (see Table 4). After the group discussion we collected and analyzed the data again.
Table 4. Std. Deviation after the Group Discussion
Cost Factor Minimum Most
Likely
Maximum
Novelty of Requirements 0.00 0.04 0.11 Importance of SW Maintenance 0.00 0.00 0.00 Novelty of Technology 0.05 0.12 0.31 Developer’s Technical Capabilities 0.00 0.00 0.11 Team Communication Skills 0.03 0.04 0.18 Quality of Project Management 0.00 0.05 0.22 Requirements Volatility 0.04 0.22 0.00 Quality of Specification Methods 0.05 0.11 0.22 Customer Input and Motivation 0.08 0.04 0.11
Comparing the results in Table 3 with Table 4, we observe a reduction in the response variance for all the cost factors. For some cost factors there is almost no variance at all, which means the experts had the same opinion and/or experience about the cost factors influence on effort. The “Novelty of Technology” is the only cost factor with a standard deviation larger than 0.22. This may be due to different experiences regarding a novel web development technology. The “Importance of Software Maintenance” was a cost factor that showed a variance after the personal interviews but no variance at all after the group discussion. This is one example, where a high variance in the understanding of the cost factor definition was perceived in the group discussion. Therefore, we conclude that both the relevance and the tailoring of the cost factor definitions have a high influence on validity of a cost estimation model and thus the prediction accuracy.
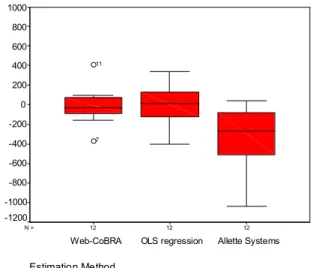
Box plots were used to graphically illustrate the residuals between effort estimate and actual effort spent. If a residual for a
certain project is negative the effort was underestimated and vice versa. Figure 4 depicts the box plots of the residuals of the three estimation methods. The estimates done by Allette Systems generally tend to underestimate development effort. OLS regression and the Web-COBRA model do not show general trends like this.
12 12 12 N = Estimation Method Allette Systems OLS regression Web-CoBRA 1000 800 600 400 200 0 -200 -400 -600 -800 -1000 -1200 7 11
Figure 4. Box plots of the residuals
The length of the box is the interquartile range, containing 50% of all the observations. This range represents the variability of the residual values. It is the smallest for Web-COBRA. Furthermore, the upper and lower tails represent the non-outlier range. This range is very close to the box for Web-COBRA, indicating a very flat distribution. The residuals are within a range of about 100 person hours, only. Exceptions are Project 7 and Project 11, visible as the two outliers in the Web-COBRA box-plot. Usually, outlier values are outside the 1.5 box length. These two projects are very large projects in terms of development effort.
We excluded the two outliers in the cross validation when building the estimation model. The exclusion of a large project has strong effects on the regression coefficient. Thus, the estimates for large projects may be not as accurate as others. The residual represents the absolute prediction error. However, the MRE as a relative indication of the prediction accuracy is within the suggested MRE threshold of 0.25 for these two projects.
The upper and lower tail of OLS regression and Allette Systems are longer, indicating a more peaked distribution of the residuals. The box is almost twice as high for OLS regression and three times as high for Allette Systems than it is for Web-COBRA. In contrast to Web-COBRA, OLS regression more accurately (lower MRE) predicts the two large projects 7 and 11. However, for two other large projects the opposite is perceived. Thus, it seems there is no difference in prediction accuracy for larger projects between the Web-COBRA model and bivariate OLS regression
When looking at the prediction results in terms of MRE values, we observed that the enhancement project within the twelve projects was the project with the highest MRE values when applying Web-COBRA and/or OLS regression. Enhancement projects are generally more difficult to predict than other projects [18]. However, the experts at Allette Systems performed more accurately when estimating this one enhancement project.
Table 5 presents a summary of the MRE results. The different estimation methods are compared in terms of the Min, Max, Mean, and Median MRE. The Pred (0.25) indicates the prediction level.
Table 5. Results summary
Estimation Method Min MRE Max MRE Mean MRE Median MRE Pred (0.25) Informal estimation method (Allette) 0.12 0.68 0.37 0.36 0.25 OLS regression 0.00 0.60 0.24 0.23 0.67 Web-COBRA model 0.02 0.35 0.17 0.15 0.75
Web-COBRA performs best with a mean MRE of only 0.17 and a high Pred (0.25) value of 75% and is within the thresholds suggested by Conte et al. [2]. OLS regression conforms to only the threshold of the mean MRE (smaller than 0.25). Allette Systems prediction accuracy is low when compared to the results of OLS regression and Web-COBRA. The prediction level is low, indicated by a low value of Pred (0.25). The mean MRE is 0.37. OLS regression shows higher prediction accuracy in terms of a higher value of Pred (0.25) and a lower mean MRE value. Web-COBRA performs best with a mean MRE of only 0.17 and a high Pred (0.25) value of 75%. The estimates derived from OLS regression or Allette Systems informal method show a wider range (min MRE, max MRE) than the estimates derived from the Web-COBRA model. Hence, the median MRE is higher for the first two methods than for Web-COBRA.
Table 6 shows the results from testing whether the differences in the MRE values among the different methods are significant using the matched paired t-test.
Table 6. t-test results
Compared Methods Mean MRE_1 Mean MRE_2 p-value (1) Allette Systems -(2) OLS regression 0.37 vs 0.24 0.164 (1) OLS regression -(2) Web-COBRA 0.24 vs 0.17 0.242 (1) WebCOBRA -(2) Allette Systems 0.17 vs 0.37 0.005
The significance test shows that the estimates derived from the Web-COBRA model are significantly better than the Allette Systems estimates on a confidence interval of 0.99. OLS regression did not derive significantly better results than Allette Systems. Also, no significant difference in prediction accuracy could be observed between OLS regression and Web-COBRA.
Besides this objective validation of the COBRA method, we also applied a subjective method, called the technology acceptance method (TAM) [27]. This method was used to determine the appropriateness of COBRA from a practical point of view. The results from analyzing the questionnaires showed a high perceived usefulness (81%). The ease of use was evaluated 86% on average. The self-predicted usage was predicted by 91%. These results show a high appropriateness of COBRA in the context of Allette Systems.
The initial application of the COBRA method achieved a prediction accuracy of 0.09 (MMRE). The developed COBRA
model included only six past projects. Furthermore, the developed causal model of cost factors involved the modeling of interactions between cost factors, which may have a positive influence on the prediction accuracy.
From a practical perspective, a strong weakness of the initial application of COBRA was its use of lines of code as size measure. This solution-oriented size measure is not available early on in the software development cycle, when the cost estimate is required. It is often more important to have an early, relatively accurate effort estimate, rather than a very accurate effort estimate later in the development process.
The WebMo is to the authors’ knowledge the only published model to estimate cost for web application [3, 4]. It uses past project data on nine cost factors and system size measured in Web Objects. Reifer reports prediction accuracy in terms of relative error of less than 0.20 for 68% of 64 projects. We do not know whether this number is an aggregated number (mean/median MRE) or whether cross validation was applied, because no further details are yet published about the WebMo evaluation. Assuming that Reifer means the Pred (0.20) we can conclude that the Web-COBRA achieved about the same prediction accuracy. The disadvantage of WebMo, however, is that it is a data-driven cost estimation model, which requires more past projects than Web-COBRA.
The Web-COBRA model outperforms the cost estimation methods presented in Table 1. In the summary of previous studies (Section 2), only one single study obtained accurate predictions (MMRE less than 0.25) for two estimation methods (COCOMO and OLS) [7]. Within this study a comparison between COCOMO and OLS regression models was performed. They used two different types of factor analysis to reduce the dimensionality, i.e. number of influential factors on cost. Their approach focused on reducing the dimensionality of the cost estimation model by only including context specific cost factors. Based on the results, they conclude that model simplicity and specificity is a possible improvement to state-of-the-art estimation models.
The study on dimensionality reduction and the COBRA method have in common that only the most relevant cost factors for a specific context are used for the cost estimation model building. Therefore, we conclude that tailoring a cost model using only most important factors has a positive influence on the prediction accuracy of cost estimation models.
A distinction between the two COBRA studies and previous empirical studies may be in the homogeneity of collected past project data. A lack of precise definitions of the cost factors causes a large variation in the method’s performance [6].
While developing a COBRA model, a size measurement method has to be investigated, which ensures consistent measurement. The data on the COBRA cost factors is collected with a questionnaire using a Likert-type scale as response category. The project manager has to evaluate the cost factors based on the definition of the cost factor and a worst-case statement. The questionnaire is designed in a way that ensures the easy use of the data collection instrument. Thus, COBRA also provides a means for collecting past project data rather easily and consistently. In the context of Allette Systems, the project managers filled out the questionnaire together with a researcher to assure completeness and consistency of the data. The Web Objects were counted by a researcher using the developed counting manual. Afterwards, the numbers were cross-checked with the project manager of the web application to ensure consistency.
Another important driver of the accuracy of a cost estimation model is the size measure. In the context of Allette Systems we used a size measure that is tailored to the specific needs of web applications, the Web Objects. Reifer’s approach was modified in a way that is most suitable to Allette Systems. A counting manual was developed including detailed instructions and counting examples. After measuring the twelve web applications at Allette Systems and analyzing the data a significant correlation between development effort and size in Web Objects was determined. Within the Web-COBRA evaluation, bivariate OLS regression was performed, where effort is the dependent and size measured in Web Objects the independent variable. A mean MRE of 0.24 was obtained from cross validation. The results implicitly show that size is a good predictor of effort. However, from a practical point of view we know, that it is generally rather difficult to accurately assess system size at an early project stage. Thus, the authors assume that early effort estimates are likely to be more accurate when derived from a cost estimation model that also uses other characteristics than only system size.
5.
Conclusions
The work presented in this paper was based on the original COBRA model provided in [1]. We modified that work by (1) instantiating a new sizing metric for web applications based on the work of Reifer [4], (2) modified the data collection and validation process for the derivation, definition and collection of cost factor s and values, and (3) changed the nature of the cost factor model to one of orthogonal drivers thereby excluding interactions between cost drivers. This modified model (Web-COBRA) was then applied in a small web application development organization and results of this compared with both bivariate OLS regression model and the subjective estimates originally used by the organization during the project development.
The results show that bivariate OLS regression predicts effort less accurately than the Web-COBRA model, even though significantly. However, from a practical point of view the subjective results of the TAM indicate a high acceptance of the COBRA method and a relatively low complexity. In contrast to this, OLS regression lacks of transparency and ease of use.
Web-COBRA produced significantly better estimates than the subjective estimates developed in the organization. We believe that it is necessary to use an orthogonal cost factor definition structure in this type of work, based on the interviews carried out in the organization. We found that common agreement on the exact interpretation of an explicitly defined cost factor cannot be assumed, and that if a white box model is to be achieved in practice, then simplicity will be an important model characteristic. This further suggests that cost factor information and values cannot be reliably captured by questionnaire in the type of organization that was involved in this study. It is necessary to validate all definitions and subjective data values through interview and cross validation between experts within the organization.
We note that it is also generally rather difficult to accurately assess system size at an early project stage. Thus, we propose that early effort estimates are likely to be more accurate when derived from a cost estimation model that also uses characteristics other than system size alone. This deeper consideration of project characteristics should lead to a better understanding of the project at hand. Whether system size alone is a good effort predictor for web applications still needs to be investigated. For web
hypermedia systems it was shown that effort can be accurately predicted using only size measures [9]. We doubt that this also applies for web applications based on the experiences gained in this case study.
Several issues need to be investigated to improve the reliability and generalizability of the results. A follow-up study at Allette Systems is proposed to investigate questions regarding the acceptance of the model in the company as well as the prediction accuracy when estimating projects in the future. Further replications of this case study need to be performed in similar environments to allow more general conclusions. Instantiating Web-COBRA models in several similar environments will enable comparisons between the models.
Consistent and comprehensive comparisons between different COBRA models will require consistent size measurement. The Web Object counting approach is considered to be a future size measure for web applications, but this also needs to be validated by further case studies. Therefore, future research should focus on establishing Web Objects as a suitable future size measure for web applications.
Further case studies in small companies need to be performed to improve the understanding of their work practices. Once we achieve this, we can tailor research activities more towards the needs of small companies. Thereby, we will be able to better contribute to improved software project management in small companies.
6.
ACKNOWLEDGMENTS
We would like to thank Allette Systems for supporting the research project with their project data and personal support. We are thankful to all involved employees of Allette Systems who have made this work possible. We highly appreciate the methodological details on the COBRA method that were provided by the Fraunhofer Institute for Experimental Software Engineering (IESE).
7.
REFERENCES
[1] L.C. Briand, K. El Emam, F. Bomarius, COBRA: A Hybrid Method for Software Cost Estimation, Benchmarking, and Risk Assessment. Proceedings of 20th International Conference on Software Engineering, April 1998, pp. 390-399.
[2] S.D. Conte, H.E. Dunsmore, V. Y. Shen. Software engineering metrics and models. The Benjamin/Cummings Publishing Company, Inc., 1986.
[3] D. Reifer. Web-Development: Estimating Quick-Time-to-Market Software. IEEE software, vol. 17, no. 8,
November/December 2000, pp. 57-64.
[4] D. Reifer. Ten deadly Risks in Internet and Intranet Software Development. IEEE software, vol. 18, no. 2, March/April 2002, pp. 12-14.
[5] M.A. Cusumano, D.B. Yoffie. Competing on Internet Time: Lessons from Netscape and Its Battle with Microsoft. Simon & Schuster Free Press, New York, 1998.
[6] L.C. Briand, I. Wieczorek. Software Resource Estimation. Encyclopedia of Software Engineering. Volume 2, P-Z (2nd
ed., 2002), Marciniak, John J. (ed.) New York: John Wiley & Sons, pp. 1160-1196.
[7] G.H. Subramanian, S. Breslawski. Dimensionality Reduction in Software Development Effort Estimation. Journal of Systems and Software, 1993, vol. 21, no. 2, pp. 187-196. [8] W. Hayes. Statistics. Fifth Edition. Hartcourt Brace College
Publishers. 1994
[9] E. Mendes, N. Mosley, S. Counsell. A Comparison of Length, Complexity & Functionality as Size Measures for Predicting Web Design & Authoring Effort. Proceedings of the 2001 EASE Conference, Keele, UK, pp. 1-14.
[10]E. Mendes, I. Watson, C. Triggs, N. Mosley, S. Counsell. A Comparison of Development Effort Estimation Techniques for Web Hypermedia Applications. Proceedings of the IEEE Metrics Symposium, 2002.
[11]F. Walkerden, R. Jeffery. An Empirical Study of Analogy-based Software Effort Estimation. Empirical Software Engineering, 42, June 1999, pp. 135-158
[12]J. Conallen. Building Web Applications with UML. Addison-Wesley, 2000.
[13]B.W. Boehm. Software Engineering Economics. Prentice Hall, NJ, 1981.
[14]L.H. Putnam. A general Empirical Solution to the Macro Software Sizing and Estimating Problem. IEEE Transactions on Software Engineering, 1978, vol. 4, no. 4, pp. 345-361. [15]Y. Deshpande. Consolidating Web Engineering as a
discipline. Software Engineering Australia, April 2002, pp. 31-34.
[16]J. Albrecht, J. R. Gaffney. Software function, source lines of code, and development effort prediction: a software science validation. IEEE Transactions on Software Engineering, vol. 9,1983 no. 6, pp. 639-648.
[17]T. Rollo. Sizing E-Commerce. Proceedings of the ACOSM 2000 - Australian Conference on Software Measurement, Sydney, 2000.
[18]T. C. Jones. Estimating Software Costs. McGraw-Hill, New York, 1998.
[19]Judd, Smith, Kidder. Research Methods in Social Relations. Sixth edition. Harcourt Brace Jovanovich College Publishers, Fort Worth, USA, 1991.
[20]F.J. Heemstra. Software cost estimation. Information Software Technology, 1992, vol. 34, no. 10, pp. 627-639. [21]B.W. Boehm, C. Abts, A.W. Brown, S. Chulani, B.K. Clark,
W. Horowitz, R. Madachy, D. Reifer, B. Steece. Software Cost Estimation with COCOMO II. Prenctice Hall, NJ, 2000. [22]I. Wieczorek. Improved Software Cost Estimation. A Robust
and Interpretable Modeling Method and a Comprehensive Empirical Investigation. Fraunhofer IRB Verlag, vol. 7, 2001
[23]M. Shepperd, C. Schofield, B. Kitchenham. Effort Estimation Using Analogy. Proceedings of the 18th International Conference of Software Engineering, 1996, pp. 170-175.
[24]C.F. Kemerer. An Empirical Validation of Software Cost Estimation Models. Communications of the ACM, vol. 30, no. 5, 1987, pp. 417-429
[25]S. Chulani, B. Boehm, B. Steece. Bayesian Analysis for the Empirical Software Engineering Cost Models. IEEE Transactions on Software Engineering, vol. 25, no. 4, 1999 [26]M. Ruhe. The early and accurate effort estimation of web
applications. University of Kaiserslautern, diploma thesis; available via email from the author.
[27]F.D. Davis. Perceived Usefulness, Ease of Use, and Usage of Information Technology. MIS Quarterly, September 1989, pp. 319-340.
[28]T. DeMarco. Controlling Software Projects. Yourdan Press, 1982
[29]R.C. Tausworthe. The work breakdown structure in sofware project management. Journal of Systems and Software 1. 1980, pp. 181-189