Radiographic Damage Associated With Low Bone
Mineral Density and Vertebral Deformities in
Rheumatoid Arthritis: The Oslo-Truro-Amsterdam
(OSTRA) Collaborative Study
MARIETTE C. LODDER,
1GLENN HAUGEBERG,
2WILLEM F. LEMS,
1TILL UHLIG,
2RAGNHILD E. ORSTAVIK,
2PIET J. KOSTENSE,
1BEN A. C. DIJKMANS,
1TORE K. KVIEN,
2 ANDANTHONY D. WOOLF
3Objective. To examine variables associated with bone mineral density (BMD) and vertebral deformities in women with rheumatoid arthritis (RA) from 3 northwest European countries.
Methods. Female patients were recruited from rheumatology clinics in Oslo, Norway; Truro, UK; and Amsterdam, The Netherlands (150 total, 50 per center, age 50 –70 years, disease duration>5 years). Demographic and clinical data were collected and BMD was measured by means of dual energy x-ray absorptiometry. Associations between demographic and clinical measures on the one hand and BMD and vertebral deformities on the other were investigated by single and multiple regression analyses.
Results. Body mass index (BMI), medication use, RA damage measures, and BMD differed significantly between the 3 centers. Overall, Norwegian patients had the lowest BMI, used more corticosteroids and antiosteoporotic drugs, had lower joint damage measured by Larsen score, and lower BMD at both spine and hip. High age, low BMI, and high cumulative dose of corticosteroids (last 2 years) are related to low BMD. A high Larsen score was associated with low BMD at the hip. Larsen score was the independent determinant of vertebral deformities after correction for center, age, BMI, and BMD.
Conclusion. Data from 3 countries on BMD and vertebral deformities in female patients aged 50 –70 years with long-standing RA are presented, demonstrating an association between radiographic RA damage and low BMD and between radiographic RA damage and vertebral deformities.
KEY WORDS. Rheumatoid arthritis; Postmenopausal women; Bone density; Vertebral deformities; Radiography.
INTRODUCTION
Generalized low bone mass is considered a complication of rheumatoid arthritis (RA) (1). Over the past few years, generalized bone loss was largely thought to be 1 of 3 separate types of bone involvement in RA, the other 2
being juxtaarticular osteoporosis and bone erosions of in-dividual joints. Recently, however, it was suggested that some of the pathophysiologic mechanisms involved in generalized osteoporosis are common to those for local bone involvement (2). The osteoclast plays a central role in these processes, and the biology of this cell depends on the balance between receptor activator of nuclear factor B ligand and osteoprotegerin (3,4).
During the last few years, the extent of osteoporosis in RA became more clear. A 2-fold higher frequency of osteo-porosis was shown in 394 female RA patients recruited from a patient register, representative of the underlying patient population in Oslo, as compared with a healthy reference population (5). A similar increased occurrence of reduced bone mass has been reported in male RA patients (6).
In an attempt to unravel the pathogenesis of bone loss and to identify patients at high risk of osteoporosis, the
1Mariette C. Lodder, MD, Willem F. Lems, MD, PhD, Piet
J. Kostense, PhD, Ben A. C. Dijkmans, MD, PhD: VU Univer-sity Medical Center, Amsterdam, The Netherlands;2Glenn
Haugeberg, MD, Till Uhlig, MD, PhD, Ragnhild E. Orstavik, MD, Tore K. Kvien, MD, PhD: Diakonhjemmet Hospital, Oslo, Norway;3
Anthony D. Woolf, BSc, FRCP: Royal Corn-wall Hospital, Truro, UK.
Address correspondence to M. C. Lodder, Department of Rheumatology, Room 4A42, VU University Medical Center, P.O. Box 7057, 1007 MB Amsterdam, The Netherlands. E-mail: [email protected].
Submitted for publication February 20, 2002; accepted in revised form May 31, 2002.
DOI 10.1002/art.10996
© 2003, American College of Rheumatology
ORIGINAL ARTICLE
relation between demographic and disease-related vari-ables on the one hand and bone mass on the other was studied in RA patients (7–9). The demographic variables high age and low body mass index (BMI) were found to be related to low bone mass (10). Moreover, disease-related variables are reported as determinants of low bone mineral density (BMD) (11,12). Despite the overall results men-tioned, studies on osteoporosis in RA show conflicting results with regard to many possible risk factors for low bone mass or osteoporosis (13–15). This lack of unanimity might be ascribed to the complex interaction between in-flammation and corticosteroid use. Moreover, these dis-crepancies might be attributed to differences in method-ologic aspects, such as sample size and patient selection, or local customs in lifestyle and treatment in the various studies.
Symptomatic fractures are the relevant clinical outcome of low bone mass. The increased risk of both hip and vertebral fractures in people with RA compared with those without RA underlines the significance of osteoporosis as a complication in RA (16 –18). However, the contributions of the different risk factors could not be assessed in the mentioned studies on fracture risk in RA.
The present cross-sectional study addresses these issues by identifying factors associated with BMD and vertebral deformities in postmenopausal women with longstanding RA from 3 northwest European countries.
PATIENTS AND METHODS
Patients. In each of 3 centers, general rheumatology clinics in Oslo (Norway), Truro (UK), and Amsterdam (The Netherlands), 50 female patients were consecutively en-rolled. The patients included were 50 –70 years old and fulfilled the American College of Rheumatology (formerly American Rheumatism Association) 1987 revised classifi-cation criteria for RA (19). The disease duration of all patients was 5 or more years. At the time of clinical exam-ination, the 150 patients underwent a BMD measurement unless they had a BMD measurement within the previous 3 months.
Demographic and clinical variables. The demographic and clinical variables of the patients were retrieved by interview and clinical examination. The interviews and examinations were carried out by trained research nurses in Oslo and Truro in cooperation with a local rheumatol-ogist; in Amsterdam the examination was performed by 1 physician (MCL). The demographic variables collected were age, disease duration, body weight, and height. Other data collected concerned menopause status, previous and current use of antiosteoporotic and disease-modifying an-tirheumatic drugs (DMARDs), history of corticosteroid use (never/previous/current use, cumulative amount over the past 2 years, use ofⱖ7.5 mg for⬎6 months, and number of months of corticosteroid use), and smoking status (never/ previous/current smoker). RA disease activity core mea-sures were collected: pain and patient’s and investigator’s global disease activity assessment as measured on a visual analog scale (0 –100 mm), physical disability by means of
the Health Assessment Questionnaire (HAQ; 20 items, score range 0 –3, with higher scores indicating worse dis-ability) (20), 28 tender joint count, 28 swollen joint count, and acute phase reactants (the erythrocyte sedimentation rate [ESR; mm/hour] and C-reactive protein [CRP; g/dl]) measured with local measurement techniques. The modi-fied disease activity score (DAS) was calculated according to published guidelines (21). Serum rheumatoid factor (RF) status was defined as positive if it ever was positive according to locally applied measurement techniques and local cut-off points.
Joint damage was assessed by an 18 deformed joint count (5) and by radiographs. Hand radiographs were read by a trained rheumatologist according to the modified Larsen method (range 0 –120) (22). Intraobserver variabil-ity was calculated by means of intraclass correlation coef-ficient (ICC) on a sample of 30 radiographs reflecting the distribution of damage status at first reading (ICC⫽0.96, confidence interval 0.92– 0.98) and by means of Bland and Altman’s 95% limits of agreement method (23). This method yielded a smallest detectable difference of⫾16.9 modified Larsen score units.
Lateral radiographs of thoracal and lumbar spine were read as proposed by Genant et al (24) by 1 observer (MCL). This semiquantitative method grades vertebrae T4 –L4 on visual inspection into grades 0 (normal), 1 (20 –25% re-duction in anterior, middle, and/or posterior height), 2 (25– 40% height reduction), and 3 (40% height reduction). A vertebra scoring of grade 1 or higher was considered a deformed vertebra. Vertebral deformities in patients were categorized as mild (ⱖ1 vertebral deformity grade 1, with-out grade 2 or 3 deformities), moderate (ⱖ1 vertebral de-formity grade 2, without a grade 3 dede-formity), or severe (ⱖ1 vertebral deformity grade 3). Intraobserver variability was calculated on a sample of 40 radiographs, half of which were judged as having vertebral deformities on first reading. The kappa score for presence versus absence of
ⱖ1 vertebral deformity gradeⱖ1 was 0.80. The weighted kappa scores with quadratic weights for severity and num-ber of deformities were 0.90 and 0.78, respectively.
BMD measurements. BMD measurements of the hip, total hip and femoral neck, and lumbar spine L2– 4 antero-posterior view were carried out by a trained technician at each site. Several quality aspects of the BMD data col-lected on 3 different dual energy x-ray absorptiometry (DEXA) machines (Lunar Expert [Lunar, Madison, WI] in Oslo, Lunar DPX [Lunar] in Amsterdam, and Hologic [Ho-logic, Waltham, MA] QDR 4500 in Truro) were examined. In vitro reproducibility, calculated from measurements of the local spine phantom and expressed as a coefficient of variation (CV), were 0.8%, 0.6%, and 0.4% for the com-plete study period in Oslo, Truro, and Amsterdam, respec-tively. In vivo reproducibility of BMD measurements was investigated by means of duplicate DEXA measurements in 10 healthy volunteers recruited per center (mean age⫾ SD: Norway 55.1⫾4.5, UK 54.7⫾ 5.4, the Netherlands 59 ⫾ 4.1). The CVs were 1.6%, 1.3%, and 1.2% at the femoral neck; 1.3%, 1.0%, and 1.1% at the total hip; and 2.5%, 0.8%, and 0.7% at the lumbar spine L2– 4 in Oslo,
Truro, and Amsterdam, respectively. Crosscalibration of the 3 DEXA machines was carried out by means of a Bona Fide Phantom (Bio-Imaging Technologies Inc., Newton, PA), a calcium hydroxyapatite spine (L1– 4) phantom (range of density 0.7–1.5 g/cm2), that traveled between the
3 centers. At each center, the crosscalibration phantom was measured 5 times on 5 consecutive days. The phan-tom was not repositioned between the measurements within 1 day. A linear regression model was used to adjust the BMD values from Amsterdam and Truro to the Oslo BMD data. The use of a linear model was justified by the highly significant correlations found between the phantom BMD measured in Oslo and Amsterdam (r ⫽ 0.99), and Oslo and Truro (r⫽0.99).
The raw Oslo BMD and the adjusted Amsterdam and Truro BMD values were compared with a pooled Europe-an/US reference database for T and Z score estimation. Details on the database for T and Z score estimation are extensively described elsewhere (5). To ensure the validity of the data from the pooled European/US reference popu-lation, we compared the data of this reference population with data (all obtained with Lunar machines) from popu-lations in Norway, the UK, and The Netherlands (25–27). No substantial difference was found between the pooled European/US reference population and the Scandinavian, British, and Dutch reference populations for the femoral neck and spine L2– 4, because the 95% confidence interval of the mean BMD values were overlapping in each age decade or were close to the BMD values for the pooled European/US reference population.
Ethics. The study protocol was approved by the local medical ethical committees of the 3 centers.
Statistical analysis. Data on all 150 patients collectively were analyzed, as were the data separated by center. Bone mass was expressed as BMD (g/cm2) and also presented as
T and Z scores. Osteoporosis was defined as a T score of
ⱕ⫺2.5 SD (28). Reduced bone mass was defined as a Z score ofⱕ⫺1 SD. The Z score was calculated by adjust-ment for both age and weight. Regarding continuous vari-ables, groups were compared by means of 2-sided t-tests or analysis of variance with Bonferroni correction for multi-ple comparisons. The chi-square test (categorical vari-ables) or the Kruskal-Wallis test was performed where appropriate. In the single analysis (1 independent able), relations between demographic and clinical vari-ables listed in Table 1 on the one hand and BMD and vertebral deformities on the other hand were investigated. Based on the results of the corresponding single analysis (P⬍0.20) and supposed clinical relevance, variables were added to the respective multiple regression models. In all multiple regression models, we adjusted for age, BMI, and center, which was added as a dummy variable in the linear regression models. The multiple regression analyses were performed as backward and forward procedures. The mod-els were then further refined by tentatively adding first-order interactions, square terms investigating curving of the regression, and single variables initially not included in the model. By means of linear regression, the indepen-dent variables associated with BMD at different
measure-ment sites were investigated. Logistic regression was used to examine the determinants of the dichotomous depen-dent variable, at least 1 vertebral deformity gradeⱖ1. A 2-sidedPⱕ 0.05 was considered statistically significant. The software used was SPSS for Windows (Chicago, IL), version 9.0.
RESULTS
Patient characteristics. The demographic and clinical characteristics of the 150 patients included in the study are shown in Table 1. The most striking differences be-tween the centers, occurring for some of the demographic and disease-related variables, exist between Truro and Oslo. Patients in Truro had the highest BMI, and patients in Oslo more frequently used corticosteroids and drugs for the prevention and treatment of osteoporosis. However, the Oslo patients had the lowest BMD values and the lowest radiographic damage scores. The Larsen score of the hands was almost twice as high in Amsterdam patients as compared with the patients from Oslo. The patients’ self-reported perception of pain and physical disability was worst in Truro.
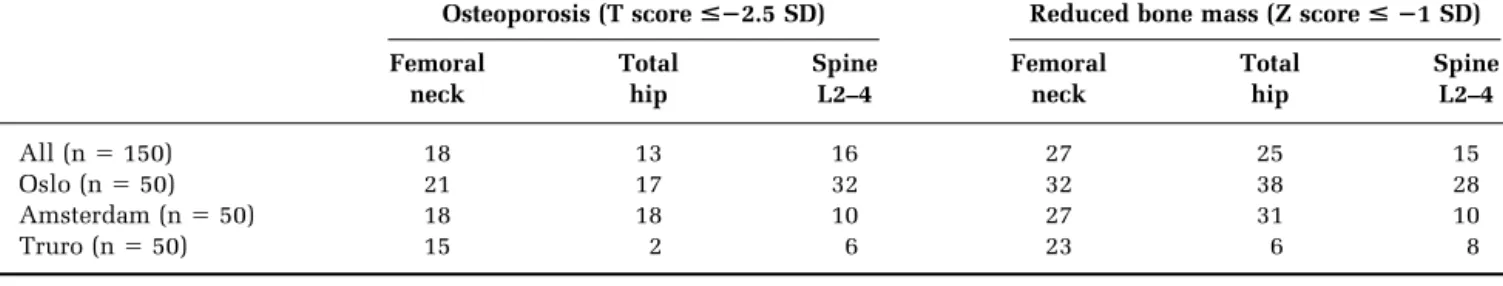
BMD, frequency of osteoporosis, and reduced bone mass. In 6 patients, no hip measurement was performed due to bilateral hip replacement. The BMD and the derived T and Z scores differed between the 3 centers, with a tendency of the values of Oslo patients to be lowest and of Truro patients to be highest. At the total hip and spine, these differences reached statistical significance (Table 1). The frequency of osteoporosis (T score ⱕ⫺2.5 SD) and reduced bone mass (Z scoreⱕ⫺1 SD) per BMD measure-ment site are presented in Table 2. Both osteoporosis and reduced bone mass most frequently occurred in Oslo as compared with Truro and Amsterdam. This applies to all BMD measurement sites. Regarding the total group, re-duced bone mass, expressed as the Z score, occurred more frequently in the hip than in the spine.
Variables associated with BMD. The demographic and disease-related variables listed in Table 1 were investi-gated in a single regression analysis with BMD. The vari-ables investigated as independent varivari-ables associated with BMD are shown in Table 3. Higher age, lower BMI, and higher cumulative dose of corticosteroids used during the last 2 years were independent factors associated with low BMD at all measurement sites. At the hip, total Larsen score was associated with low BMD. The final model for hip BMD explained 54% of the variation in BMD; for the spine model this percentage was 37%. A number of other variables, including smoking status, disease duration, RF status, HAQ, DAS, (mean) ESR, and (mean) CRP, did not show an independent association with BMD in the multi-variate analysis. Although none of the interaction terms contributed significantly to the models, one square term (for BMI) did in the models determining hip BMD. Because the negative effect of this square term only had a small influence on the slope of the regression line (figures not shown), we neglected the effect, giving preference to the more comprehensible linear model.
Frequency of vertebral deformities. Spine radiographs of 142 women were included in the analysis. The spine radiographs of 8 patients were not read because of insuf-ficient quality. Of the 142 women whose spine radiograph was read, 20 (14%) had at least 1 vertebral deformity grade 1 or higher: 9 (18%) in Oslo, 6 (14%) in Truro, and 5 (10%) in Amsterdam. Of the 142 patients, 11 (8%) had at least 1 vertebral deformity grade 2 or higher.
Variables associated with vertebral deformities. Three separate models, including the 3 different BMD measure-ment sites as 1 of the independent variables, investigated the associations with vertebral deformities. Lower femoral neck BMD, after adjustment for age, BMI, and center, was associated with vertebral deformity. Higher total Larsen score was independently associated with vertebral defor-mity after correction for center, age, and BMI, both for the
Table 1. Demographic, disease, therapy, BMD, and damage variables* All patients (nⴝ150) Oslo (nⴝ50) Amsterdam (nⴝ50) Truro (nⴝ50) P Demographic variables Age, years 61.0 (5.8) 61.2 (6.1) 61.8 (5.8) 60.1 (5.4) 0.34 BMI, kg/m2 25.6 (4.8) 23.0 (2.9) 25.7 (3.8) 28.0 (5.9) 0.001†‡§ Menopause 92.0 88.0 98.0 90.0 0.15
Menopause age, years 46.6 (6.3) 48.1 (5.1) 46.8 (6.3) 44.9 (7.0) 0.14
Current smoker 34.2 49.0 32.0 22.0 0.02‡
Disease variables
Disease duration, years 14.0 (5.0–53.0) 12.5 (5.0–53.0) 14.6 (6.5–43.5) 12.5 (5.0–47.0) 0.71
Rheumatoid factor positive 62.7 60.0 66.0 62.0 0.80
Investigator’s global assessment, VAS 0–100 mm
33.7 (18.1) 29.5 (18.3) 33.9 (15.6) 37.3 (19.7) 0.08
Pain, VAS 0–100 mm 39.8 (23.2) 39.3 (21.1) 33.7 (22.50) 46.5 (24.5) 0.02§
Disease activity, VAS 0–100 mm 42.1 (24.5) 41.9 (21.5) 37.2 (24.3) 47.1 (26.7) 0.13
HAQ, range 0–3 1.5 (0.7) 1.3 (0.6) 1.3 (0.7) 1.9 (0.7) 0.001‡§
28 swollen joint count 7 (0–22) 9 (1–19) 8 (0–15) 6 (0–22) 0.05‡
28 painful joint count 7 (0–28) 10 (1–24) 5 (0–22) 6 (0–28) 0.002†
ESR, mm/1st hour 20.0 (2.0–98.0) 14.0 (3.0–89.0) 24.0 (2.0–61.0) 21.0 (4.0–67.0) 0.20 CRP, mg/l 9.8 (6.0–84.0) 11.0 (6.0–84.0) 7.0 (6.0–45.0) 9.6 (6.0–72.0) 0.10 DAS 4.9 (1.2) 5.0 (1.0) 4.6 (1.2) 5.0 (1.3) 0.11 Therapy variables Corticosteroids Never user 35.6 12.2 52.0 42.0 Previous user 26.2 26.5 20.0 32.0 0.001†‡ Current user 38.3 61.2 28.0 26.0
Ever user of DMARDs 96.7 90.0 100.0 100.0 0.06
Current user of HRT 31.3 52.0 6.0 36.0 0.001†§
Current user of bisphophonates 12.7 16.0 20.0 2.0 0.002‡§
Current user of antiosteoporotic drugs 60.0 90.0 42.0 48.0 0.001†‡ BMD variables BMD femoral neck, g/cm2 0.83 (0.16) 0.80 (0.14) 0.83 (0.17) 0.86 (0.17) 0.17 BMD total hip, g/cm2 0.89 (0.20) 0.84 (0.16) 0.84 (0.19) 1.00 (0.19) 0.001‡§ BMD spine L2–4, g/cm2 1.12 (0.22) 1.04 (0.18) 1.14 (0.24) 1.19 (0.21) 0.002‡
Z score femoral neck ⫺0.15 (1.17) ⫺0.27 (1.10) ⫺0.14 (1.19) ⫺.03 (1.21) 0.61
Z score total hip ⫺0.02 (1.45) ⫺0.39 (1.25) ⫺0.42 (1.43) 0.74 (1.39) 0.001‡§
Z score spine L2–4 0.66 (1.65) 0.15 (1.57) 0.85 (1.77) 1.00 (1.49) 0.009†‡
T score femoral neck ⫺1.25 (1.34) ⫺1.50 (1.20) ⫺1.27 (1.40) ⫺0.98 (1.38) 0.17
T score total hip ⫺0.88 (1.65) ⫺1.37 (1.33) ⫺1.30 (1.61) 0.04 (1.60) 0.001‡§
T score spine L2–4 ⫺0.84 (1.83) ⫺1.34 (1.51) ⫺0.53 (1.96) ⫺0.10 (1.79) 0.001†§
Damage variables
18 deformed joint count 6 (0–18) 4 (0–15) 5 (0–16) 8 (0–18) 0.003‡§
Total Larsen score hands, 0–120 36.0 (0.0–117.0) 24.5 (0.0–117.0) 46.5 (2.0–105.0) 33.5 (0.0–102.0) 0.004†§
ⱖ1 vertebral deformityⱖgrade 1 14.1 18.0 10.0 14.3 0.52
ⱖ1 vertebral deformityⱖgrade 2 7.7 12.0 6.0 4.8 0.37
* Data are presented as mean (SD) for continuous variables with normal distribution; median (range) for continuous variables with nonnormal distribution; and percentage for counts.Pvalues are for the overall group comparison; in case of a significant difference in the overall comparison of groups, differences between individual groups are presented. BMD⫽bone mineral density; BMI⫽body mass index; VAS⫽visual analog scale; HAQ⫽health assessment questionnaire; ESR⫽erythrocyte sedimentation rate; CRP⫽C reactive protein; DAS⫽disease activity score; DMARDs⫽ disease-modifying antirheumatic drugs; HRT⫽hormone replacement therapy; antiosteoporotic drugs⫽hormone replacement therapy, bisphospho-nates, calcium, and/or vitamin D supplementation.
† Difference between Oslo and Amsterdam. ‡ Difference between Oslo and Truro. § Difference between Amsterdam and Truro.
model including total hip BMD and for the model includ-ing spine BMD. Thus, femoral neck and not total hip and spine BMD were independently associated with vertebral deformities. The variables on the use of corticosteroids (never/ever use, not current/current use, cumulative amount over the past 2 years, never/ever use ofⱖ7.5 mg for ⬎6 months, and number of months of corticosteroid use) were consecutively investigated in these models; none of these variables showed a significant contribution to any of the models. None of the added first-order inter-action terms and square terms demonstrated a significant result.
DISCUSSION
The main conclusion from this study in postmenopausal women with longstanding RA is the association between joint damage measured by the Larsen score and low BMD measured by DEXA and the association between joint damage and vertebral deformities, or in other words a relation between radiographic damage and osteoporosis in RA patients.
In line with previous studies in RA, high age and low BMI were independent variables associated with low BMD at all measurement sites (5). The RA-specific marker for
BMD found in this study was high total Larsen score. This variable was associated with low BMD at the hip. Total Larsen score represents cumulative joint damage and could be considered a measure that reflects cumulative disease activity. Therefore, this variable seems an appro-priate measure of past fluctuating disease activity, which can be used in cross-sectional studies on BMD in RA. Moreover, a recent study by Sinigaglia et al (29) showed the presence of erosions associated with a higher preva-lence of osteoporosis at both the spine and the hip. These findings suggest that some of the disease mechanisms for generalized osteoporosis may be common to those of local bone involvement. Even more in line with our results are data presented by Sambrook et al (30) showing an inverse association between Larsen score of the feet and both age-adjusted BMD and ultrasound measures.
In our population of 50 –70 year olds, there was no significant association between Larsen score and BMD of the spine. The absence of this significant association might be ascribed to osteoarthritis of the spine, atherosclerosis of the aorta, and vertebral deformities, increasing measured BMD and thus obscuring a possible relation between po-tential predictors and true BMD. The same mechanism probably explains the lower R2of the final model for spine
BMD as compared with the final model for hip BMD. The
Table 2. Frequency of osteoporosis and reduced bone mass in hip (femoral neck and total hip) and spine L2– 4 among RA patients from Oslo, Truro, and Amsterdam
Osteoporosis (T score<ⴚ2.5 SD) Reduced bone mass (Z score<ⴚ1 SD) Femoral neck Total hip Spine L2–4 Femoral neck Total hip Spine L2–4 All (n⫽150) 18 13 16 27 25 15 Oslo (n⫽50) 21 17 32 32 38 28 Amsterdam (n⫽50) 18 18 10 27 31 10 Truro (n⫽50) 15 2 6 23 6 8
* Data presented as percentages. RA⫽rheumatoid arthritis.
Table 3. Multiple linear regression analysis of BMD (g/cm2
) at different sites of measurement (dependent variable), demographic variables, and disease variables (independent variables)*
Femoral neck Total hip Spine L2–4
Beta SE 95% CI Beta SE 95% CI Beta SE 95% CI
Center (dummy Oslo-Amsterdam) 0.022 0.029 ⫺0.036 to 0.080 ⫺0.008 0.033 ⫺0.074 to 0.058 0.040 0.042 ⫺0.042 to 0.123 Center (dummy Oslo-Truro) 0.010 0.030 ⫺0.050 to 0.071 0.10 0.034 0.028 to 0.165† 0.045 0.044 ⫺0.042 to 0.132 Age, years ⫺0.006 0.002 ⫺0.01 to⫺0.003† ⫺0.008 0.002 ⫺0.012 to⫺0.003† ⫺0.0056 0.003 ⫺0.011 to⫺0.0003‡ BMI, kg/m2 0.016 0.002 0.011 to 0.021† 0.018 0.003 0.013 to 0.024† 0.022 0.004 0.014 to 0.029† Cumulative steroids last 2 years, grams ⫺0.007 0.002 ⫺0.012 to⫺0.003† ⫺0.010 0.003 ⫺0.015 to⫺0.005† ⫺0.013 0.003 ⫺0.019 to⫺0.006† Total Larsen score
hands
⫺0.0014 0.0004 ⫺0.002 to⫺0.001† ⫺0.0016 0.0004 ⫺0.002 to⫺0.001† ⫺0.0009 0.0005 ⫺0.002 to 0.0002
R2 45 54 38
* BMD⫽bone mineral density; SE⫽standard error; 95% CI⫽95% confidence interval; BMI⫽body mass index; R2⫽percentage of total variance
explained in the model. Dummy variables for center Oslo is reference category. †P⬍0.01.
difficulties in interpreting findings on spine BMD are re-flected in recent recommendations preferring the measure-ment of BMD in the hip to other sites (31). In accordance with previous reports, cumulative corticosteroid dose dur-ing the 2 years before BMD measurement was indepen-dently associated with low hip and spine BMD (1,32). RF status, disease duration, and HAQ score, variables related to BMD in other studies (5,12,13), did not independently predict low BMD in this study. An explanation for this may be that these variables are incorporated in the total Larsen score.
The multiple regression analyses investigating vertebral deformities showed age and total Larsen score as indepen-dent variables associated with this endpoint. In contrast with findings of other studies showing relations between corticosteroid use and vertebral deformities (33–35), none of the variables related to corticosteroid use was signifi-cantly associated with vertebral deformities in the current study. The reason for the discrepancy between the data from literature and our findings could be a lack of statis-tical power in the detection of a relation between cortico-steroid use and vertebral deformities; only 20 of the 142 women who had their spine radiographs assessed had vertebral deformities, and 65% of the patients were clas-sified as ever using corticosteroids. Besides, the mean dose of corticosteroids used was relatively low in our patients. The effects of corticosteroids on bone are complex (36). The value of glucocorticoids in reducing the rate of radio-graphic progression in RA was elegantly proven by Kirwan (37). The beneficial effect on suppression of disease activ-ity, radiographic progression, and the potential reversibil-ity of corticosteroid effects after tapering and stabilization of continued therapy should be weighted against the in-duction of osteoporosis. The significance of negative influ-ence of RA on bone is underlined by the current finding of the Larsen score as independent predictor of vertebral deformities. Previous studies also found an effect of dis-ease-related variables with vertebral deformities in RA (29,38).
Despite the fact that this study on osteoporosis in RA contains data from 3 geographically closely related Euro-pean countries, remarkable differences in treatment of RA and osteoporosis, joint damage, and BMD are shown. The most striking findings were the frequent use of corticoste-roids and the low mean Larsen score in the Norwegian patients as compared with the other centers. The differ-ence in BMI between patients from the 3 centers could reflect a different lifestyle regarding diet and physical ac-tivity. The variation in joint damage and BMD between the centers suggests an effect of the differences in antirheu-matic treatment in these patient groups of similar age, RF status, disease duration, and menopausal age.
The difference in RA treatment regarding corticosteroid use might originate from local clinical preference. The frequent use of antiosteoporotic drugs in Oslo can be ex-plained by recent local research on osteoporosis in RA, resulting in the start of antiosteoporotic treatment in some patients.
All patients were consecutively recruited from eligible patients attending the outpatient clinic. Therefore, we con-sider these patient samples representative of the respective
clinic population. The sample size of 50 patients per cen-ter was chosen for practical reasons. The adjustment for center in the multiple regression analysis controls for the heterogeneity between the respective centers regarding, for instance, BMI and corticosteroid use. Despite the cross-sectional design of the study, the relation between disease activity and BMD could be investigated by the use of total Larsen score as a representative of cumulative disease activity. Potential bias is introduced in multicenter studies by different assessors and, here, DEXA machines. How-ever, the radiographs were scored by one assessor whose reproducibility was tested and found adequate. The repro-ducibility of DEXA measurements was acceptable. The BMD data were cross-calibrated and no difference was found between BMD data of national reference popula-tions and the pooled European/US database, allowing for the use of this pooled database for T and Z score calcula-tions.
At first sight, there is a discrepancy between the findings for the total group and the subgroup of Oslo patients re-garding the association between radiographic joint damage and BMD. The patients from Oslo have the lowest total Larsen score but also the lowest BMD as compared with the other 2 subgroups. However, when the final multiple regression model (BMD as dependent variable) con-structed for the total group is applied to the subgroup from Oslo, total Larsen score of the hands is independently associated with low BMD.
The current data were obtained from women with long-standing RA, therefore, they cannot be generalized to other patient groups such as men and women with early RA. Yet, osteoporosis is mainly a problem of postmenopausal women who sustained the various deleterious RA-related effects on bone for a prolonged period of time. Conse-quently, the presented data concern a patient group of particular interest. Considering the median disease dura-tion of the patients, radiographic damage in the majority of patients may have in part developed prior to the availabil-ity of DMARDs, which prevent radiographic damage. Fu-ture investigations will examine radiographic damage and its relation to bone status in patients of similar disease duration who have been exposed to newer and more ef-fective drugs with known effects on bone destruction.
In summary, the new findings on the relation between radiographic joint damage and BMD and vertebral defor-mities further support the suggestion of some common pathogenetic mechanisms for generalized osteoporosis and local bone involvement (2). The results highlight that the future research agenda should focus on possible asso-ciations between the aggressive suppression of disease activity in RA patients and the prevention of joint damage, BMD loss, and the resulting vertebral deformities.
ACKNOWLEDGMENTS
We would like to thank Liz Stanley for assistance in Truro and Pieter Prins in Amsterdam for reading the hand radio-graphs. We gratefully appreciate Ingerid Mu¨ller, Sidsel Arnkværn, Margareth Sveinsson, and Ann Katrine Kong-torp in Oslo, Elaine Cotton in Truro, and Ems van Vloten
and Helen Wieringa in Amsterdam for technical assis-tance.
REFERENCES
1. Deodhar AA, Woolf AD. Bone mass measurement and bone metabolism in rheumatoid arthritis: a review. Br J Rheumatol 1996;35:309 –22.
2. Sambrook PN. The skeleton in rheumatoid arthritis: common mechanisms for bone erosion and osteoporosis? J Rheumatol 2000;27:2541–2.
3. Gravallese EM, Manning C, Tsay A, Naito A, Pan C, Amento E, et al. Synovial tissue in rheumatoid arthritis is a source of osteoclast differentiation factor. Arthritis Rheum 2000;43: 250 – 8.
4. Hofbauer LC, Khosla S, Dunstan CR, Lacey DL, Boyle WJ, Riggs BL. The roles of osteoprotegerin and osteoprotegerin ligand in the paracrine regulation of bone resorption. J Bone Miner Res 2000;15:2–12.
5. Haugeberg G, Uhlig T, Falch JA, Halse JI, Kvien TK. Bone mineral density and frequency of osteoporosis in female pa-tients with rheumatoid arthritis: results from 394 papa-tients in the Oslo County Rheumatoid Arthritis register. Arthritis Rheum 2000;43:522–30.
6. Haugeberg G, Uhlig T, Falch JA, Halse JI, Kvien TK. Reduced bone mineral density in male rheumatoid arthritis patients: frequencies and associations with demographic and disease variables in ninety-four patients in the Oslo County Rheuma-toid Arthritis Register. Arthritis Rheum 2000;43:2776 – 84. 7. Lems WF, Dijkmans BA. Should we look for osteoporosis in
patients with rheumatoid arthritis? Ann Rheum Dis 1998;57: 325–7.
8. Hall GM, Spector TD, Griffin AJ, Jawad AS, Hall ML, Doyle DV. The effect of rheumatoid arthritis and steroid therapy on bone density in postmenopausal women. Arthritis Rheum 1993;36:1510 – 6.
9. Martin JC, Munro R, Campbell MK, Reid DM. Effects of dis-ease and corticosteroids on appendicular bone mass in post-menopausal women with rheumatoid arthritis: comparison with axial measurements. Br J Rheumatol 1997;36:43–9. 10. Kvien TK, Haugeberg G, Uhlig T, Falch JA, Halse JI, Lems WF,
et al. Data driven attempt to create a clinical algorithm for identification of women with rheumatoid arthritis at high risk of osteoporosis. Ann Rheum Dis 2000;59:805–11.
11. Eggelmeijer F, Camps JA, Valkema R, Papapoulos SE, Pauwels EK, Dijkmans BA, et al. Bone mineral density in ambulant, non-steroid treated female patients with rheumatoid arthritis. Clin Exp Rheumatol 1993;11:381–5.
12. Gough AK, Lilley J, Eyre S, Holder RL, Emery P. Generalised bone loss in patients with early rheumatoid arthritis. Lancet 1994;344:23–7.
13. Laan RF, Buijs WC, Verbeek AL, Draad MP, Corstens FH, van de Putte LB, et al. Bone mineral density in patients with recent onset rheumatoid arthritis: influence of disease activity and functional capacity. Ann Rheum Dis 1993;52:21– 6. 14. Kroger H, Honkanen R, Saarikoski S, Alhava E. Decreased
axial bone mineral density in perimenopausal women with rheumatoid arthritis: a population based study. Ann Rheum Dis 1994;53:18 –23.
15. Laan RF, van Riel PL, van Erning LJ, Lemmens JA, Ruijs SH, van de Putte LB. Vertebral osteoporosis in rheumatoid arthri-tis patients: effect of low dose prednisone therapy. Br J Rheu-matol 1992;31:91– 6.
16. Spector TD, Hall GM, McCloskey EV, Kanis JA. Risk of ver-tebral fracture in women with rheumatoid arthritis. BMJ 1993; 306:558.
17. Huusko TM, Korpela M, Karppi P, Avikainen V, Kautiainen H, Sulkava R. Threefold increased risk of hip fractures with rheumatoid arthritis in Central Finland. Ann Rheum Dis 2001;60:521–2.
18. Cooper C, Coupland C, Mitchell M. Rheumatoid arthritis, corticosteroid therapy and hip fracture. Ann Rheum Dis 1995; 54:49 –52.
19. Arnett FC, Edworthy SM, Bloch DA, McShane DJ, Fries JF, Cooper NS, et al. The American Rheumatism Association 1987 revised criteria for the classification of rheumatoid ar-thritis. Arthritis Rheum 1988;31:315–24.
20. Fries JF, Spitz P, Kraines RG, Holman HR. Measurement of patient outcome in arthritis. Arthritis Rheum 1980;23:137– 45.
21. Prevoo ML, van ’t Hof MA, Kuper HH, van Leeuwen MA, van de Putte LB, van Riel PL. Modified disease activity scores that include twenty-eight-joint counts: development and valida-tion in a prospective longitudinal study of patients with rheu-matoid arthritis. Arthritis Rheum 1995;38:44 – 8.
22. Larsen A. How to apply Larsen score in evaluating radio-graphs of rheumatoid arthritis in long-term studies. J Rheu-matol 1995;22:1974 –5.
23. Bland JM, Altman DG. Statistical methods for assessing agree-ment between two methods of clinical measureagree-ment. Lancet 1986;1:307–10.
24. Genant HK, Wu CY, van Kuijk C, Nevitt MC. Vertebral frac-ture assessment using a semiquantitative technique. J Bone Miner Res 1993;8:1137– 48.
25. Falch JA, Meyer HE. [Bone mineral density measured by dual X-ray absorptiometry: a reference material from Oslo]. Tidsskr Nor Laegeforen 1996;116:2299 –302.
26. Truscott JG, Simpson DS, Fordham JN. A suggested method-ology for the construction of national bone densitometry ref-erence ranges: 1372 Caucasian women from four UK sites. Br J Radiol 1997;70:1245–51.
27. Burger H, van Daele PL, Algra D, van den Ouweland FA, Grobbee DE, Hofman A, et al. The association between age and bone mineral density in men and women aged 55 years and over: the Rotterdam Study. Bone Miner 1994;25:1–13. 28. Kanis JA, Melton LJ, III, Christiansen C, Johnston CC,
Khal-taev N. The diagnosis of osteoporosis. J Bone Miner Res 1994; 9:1137– 41.
29. Sinigaglia L, Nervetti A, Mela Q, Bianchi G, Del Puente A, Di Munno O, et al. A multicenter cross sectional study on bone mineral density in rheumatoid arthritis. Italian Study Group on Bone Mass in Rheumatoid Arthritis. J Rheumatol 2000;27: 2582–9.
30. Sambrook P, Raj A, Hunter D, Naganathan V, Mason R, Rob-inson B. Osteoporosis with low dose corticosteroids: contri-bution of underlying disease effects and discriminatory abil-ity of ultrasound versus bone densitometry. J Rheumatol 2001;28:1063–7.
31. Genant HK, Cooper C, Poor G, Reid I, Ehrlich G, Kanis J, et al. Interim report and recommendations of the World Health Organization Task-Force for Osteoporosis. Osteoporosis Int 1999;10:259 – 64.
32. Dykman TR, Gluck OS, Murphy WA, Hahn TJ, Hahn BH. Evaluation of factors associated with glucocorticoid-induced osteopenia in patients with rheumatic diseases. Arthritis Rheum 1985;28:361– 8.
33. Lems WF, Jahangier ZN, Jacobs JW, Bijlsma JW. Vertebral fractures in patients with rheumatoid arthritis treated with corticosteroids. Clin Exp Rheumatol 1995;13:293–7. 34. Naganathan V, Jones G, Nash P, Nicholson G, Eisman J,
Sam-brook PN. Vertebral fracture risk with long-term corticoste-roid therapy: prevalence and relation to age, bone density, and corticosteroid use. Arch Intern Med 2000;160:2917–22. 35. van Staa TP, Leufkens HG, Abenhaim L, Zhang B, Cooper C.
Oral corticosteroids and fracture risk: relationship to daily and cumulative doses. Rheumatology (Oxford) 2000;39:1383–9. 36. Verhoeven AC, Boers M. Limited bone loss due to
corticosteroids; a systematic review of prospective studies in rheumatoid arthritis and other diseases. J Rheumatol 1997; 24:1495–1503.
37. Kirwan JR. The effect of glucocorticoids on joint destruction in rheumatoid arthritis: the Arthritis and Rheumatism Coun-cil Low-Dose Glucocorticoid Study Group. N Engl J Med 1995;333:142– 6.
38. Hooyman JR, Melton LJ III, Nelson AM, O’Fallon WM, Riggs BL. Fractures after rheumatoid arthritis: a population-based study. Arthritis Rheum 1984;27:1353– 61.