ITALIAN MUTUAL BANKS:
Performance, Efficiency and Mergers and Acquisitions
Foreword by Roberto Di Salvo
Two papers by
Juan Sergio Lopez, Alessandra Appennini, and
Stefania P.R. Rossi
and
Roberto Di Salvo, Maria Carmela Mazzilis,
and Andrea Guidi
Société Universitaire Européenne de Recherches Financières Vienna 2002
CIP
Italian Mutual Banks: Performance, Efficiency and Mergers and Acquisitions (Two papers)
Juan Sergio Lopez, Alessandra Appennini, and Stefania P. R. Rossi
JEL Classification: G21
Keywords: bank efficiency, cooperative banks, mutual banks, DEA, stochastic cost frontier. Roberto Di Salvo, Maria Carmela Mazzilis,
and Andrea Guidi
JEL Classification is: G21 G28 Keywords: banks, mergers
Vienna: SUERF (SUERF Studies:15)
ISBN 3-902109-07-6 © 2002 SUERF, Vienna
Copyright reserved. Subject to the exception provided for by law, no part of this publication may be reproduced and/or published in print, by photocopying, on microfilm or in any other way without the written consent of the copyrightholder(s); the same applied to whole or partial adaptions. The publisher retains the sole right to collect from third parties fees payable in respect of copying and/or take legal or other actions for this purpose.
Contents
Foreword by Roberto Di Salvo 5
ARE ITALIAN MUTUAL BANKS EFFICIENT?
Evidence from two different cost frontier techniques 7
Abstract 7
Introduction 9
1. Efficiency estimates: methodological aspects 9
1.1 Methodologies to measure efficiency 9
1.2 The concept of efficiency 11
1.3 Structure of the paper 12
2. Defining the model 15
2.1 Defining banking output 15
2.2 Defining the cost function 16
2.3 Variables affecting efficiency 16
3. Empirical findings 19
3.1 DEA efficiency scores 19
3.2 Determinants of efficiency 21
4. Comparing parametric and non-parametric results 23
5. Conclusion 27
References 29
Annex 1-A:Methodological approaches to model the production process in the
banking industry 33
Annex 1-B: The choice of input and output variables 34
Annex 2: Survey of studies using non-parametric techniques to analyze the
efficiency of Italian banks 35
Annex 3: Stochastic cost frontier 39
MERGERS AND ACQUISITIONS BETWEEN MUTUAL BANKS IN ITALY: An analysis of the effects on performance and productive efficiency 45
Abstract 45
1. Introduction, principal conclusions and limitations 47
2. Studies of bank mergers 49
4. The results of the exploratory analysis 57
5. Data envelopment analysis 61
5.1 Main results 61
5.2 The constant returns model 61
5.3 Variable returns model 63
5.4 Cost DEA model 64
Methodological Appendix 65
References 71
SUERF 73
Italian Mutual Banks: Performance, Efficiency
and Mergers and ,Acquisitions
Foreword
1The Italian co-operative credit banks (CCB) are endowed with a strong local attitude, small size, autonomy-based governance and mutual principles. They play an important role in financing households, craftsmen and small enterprises. Nowadays, about 500 CCBs account for 3000 branches (10.5 % of the total number of branches in Italy) and market shares ranging from 5% of total bank loans to 7% of deposits. So far, they have thrived benefiting from their deep knowledge of local economies and from structural regulation that hampered competition in the banking industry. Besides, they have benefited from network externalities, since scale economies have mainly been exploited through outsourcing strategies within a three-tiered organisation. Nevertheless, both the deregulatory process and technological development are making contestable even local and isolated markets, putting pressure on the performance of these financial institutions.
Generally speaking, local/mutual banks still maintain their traditional comparative advantages due to their capacity to lower the effects of asymmetric information. However, increasing competition implies that they have also to cope with slimmer profit margins which entail lowering costs and broadening the sources of revenues. Since CCBs largely represent the segment of small, local and mutual banks still operating in Italy, their ability to face this new business environment may affect a non negligible part of the Italian economy.
The two papers presented in the SUERF Study deal with two aspects related to the long term economic viability of mutual banks: economic efficiency and the search for optimal scale or dimension. The first paper uses up-to-date mathematics and statistical tools to investigate the cost efficiency of a panel 5
1.The two papers that follow were presented at the Conference “Efficiency and competition in the co-operative banking industry in Europe: key-issues for further development” held in Rome on 21-22 June 2001.
of 450 CCBs over the period 1995-99. This study is completed with an analysis of possible determinants of the efficiency scores. The second paper analyses the effect of mergers and acquisitions (M&A) between Italian mutual banks on their efficiency and economic performance. The paper’s aim is to test the hypothesis whether the M&A wave over the past ten years has increased the efficiency level of mutual banks, both in terms of overall performance and productive efficiency.
The analysis refers to 94 CCBs which have been involved in M&As over the period 1995-1998 and is carried out on both merged and non-merged banks, either before concentration or in the subsequent years.
The empirical tests show significant results as Italian mutual banks turn out to be increasing their cost efficiency over time and the concentration wave in the 1990s has been successful in re-designing the structure of the co-operative banking industry.
These results have also relevant policy implications: internal growth may be successful in reducing inefficiency due to extremely small size, while M&As are likely to be helpful for both preventing bank defaults and improving market positioning. Indeed, the search for more efficiency is expected to be more properly fulfilled through network integration policies rather than by increasing the size of any single bank.
Roberto Di Salvo Head of the Research Center Credito cooperativo – Federcasse Via M. D’Azeglio, 33 00184 Rome – Italy email: [email protected] 6
Are Italian mutual banks efficient?
Evidence from two different cost frontier techniques
Juan Sergio Lopez, Alessandra AppenniniResearch Department,
Federazione Italiana delle Banche di Credito Cooperativo, BCC-CRA Via Massimo D’Azeglio 33, 00184 Rome
[email protected] [email protected]
Stefania P. S. Rossi2
Department of Economics
Università degli Studi di Napoli “Parthenope” Via Medina 40, 80133 Naples
Abstract
The aim of this paper is to analyze the efficiency of co-operative banks in Italy. The increasing competition induced by the ongoing process of liberalization in Europe has been affecting also these small financial institutions that used to operate in a more protected environment. Based on a panel of about 450 banks covering the period 1995-99, we employ two different techniques: non-parametric frontier analysis, and non-parametric frontier analysis. By means of this analysis it is possible to compare the results obtained using these two methodologies and analyze the determinants of bank inefficiency.
JEL Classification: G21
Keywords: bank efficiency, cooperative banks, mutual banks, DEA, stochastic cost frontier.
Corresponding author: Juan Sergio Lopez
7
2 The Italian version of this paper will be published in the Proceedings of the Conference “Competition and Efficiency of Cooperative Banks in Europe; Key-issues for Further Development” held in Rome on 21-22 June 2001, Cooperazione di Credito, n. 173-174, January-March 2002.
The Authors are grateful to Francesco Cesarini and the Advisory Board of the Review
Cooperazione di Creditofor their support and useful comments. A special thank is addressed to Allen Berger for his comments on a previous version. The Authors also wish to thank David T. Llewellyn, who participated at the Conference and outlined this issue within a broader perspective, and Robert DeYoung for his comments and encouragement for further research. The usual disclaim applies. Although this paper is the result of a joint effort, sections 1, 3, Annex 1 and Annex 2 are written by Lopez and Appennini; sections 2, 4, and Annex 3 are written by Rossi.
9
Introduction
After decades of steadily growing business and improving economic performance, Italy’s mutual banks (banche di credito cooperativo) are increasingly feeling the heat of competition; although they continue to record earning growth, in the last few years they have underperformed the more dynamic segments of the banking system. Without entering into the details of the developments that are altering the environment in which mutual banks operate, two aspects have a crucial bearing on any analysis of mutual banks’ performance: efficiency in the use of productive factors and attainment of optimal size. This is especially so now that local markets are infinitely more contestable following the liberalization of branching and the rise of aggressive, specialized intermediaries. Peripheral location and integration into the local economy remain important but are no longer sufficient to guarantee high profitability and growth. Cost efficiency and scale efficiency can be two important operational factors on which to act in order to maintain and increase market shares in a more competitive environment. Against this background, the measurement of efficiency is an essential step for formulating a strategy of competitive repositioning.
1.
Efficiency estimates: methodological aspects
1.1 Methodologies to measure efficiency
The literature concerning the problem of measuring efficiency in the field of applied economics can be divided into two principal strands: the approaches that use parametric statistical methods and those that use non-parametric methods.
Non-parametric methods, known as data envelopment analysis (DEA), apply linear programming techniques to construct an efficient production frontier. Since they do not require explicit specification of the production function, they are particularly suitable for analyzing the efficiency of non-profit
10 Efficiency estimates: methodological aspects
institutions and, more generally, of multi-input, multi-output organizations. However, DEA does not allow random errors (for example, data observation errors) to be taken into account, with the risk of confusing random deviations with deviations from the efficient frontier. Parametric methods do not involve this risk, but by imposing the specification of a production frontier they can confuse specification error with the measure of efficiency. A comparison of the two methodologies has been carried out in Ferrier and Lovell (1990) and Resti (1997) which find that efficiency scores obtained with the two methods are comparable and consistent, whereas an extensive study by Bauer et al. (1998) reaches opposite conclusions.
The choice of non-parametric methods, or DEA, appears to be particularly appropriate in the case of mutual banks in light of the following considerations:
Although mutual banks must satisfy the constraint of economic viability, they are characterized by an objective function not reducible simply to profit maximization (Fried et al. 1993, Di Salvo and Galassi 1997, Cardilli and Di Battista 1997). As mentioned above, non-parametric techniques of efficiency analysis are particularly well-suited to analyzing such organizations inasmuch as they do not require a prior definition of the production function (and hence the cost function). In fact, the first applications of DEA in the field of economics concerned non-profit institutions, such as schools and hospitals, for which the definition of profit and the production function proved most problematic.
The assumption of technological homogeneity of the units is absolutely unavoidable when a DEA methodology is applied. This assumption is more plausible in the case of mutual banks than in that of sets embracing commercial banks of widely different sizes and specialization. As noted by Hunter (1997), many studies of the US market reach the conclusion that large and small institutions operate on different cost functions and may therefore be considered as operating in different industries. The other necessary assumption for applying DEA is that of the independence of the decision-making units. It too is satisfied by the institutional structure of mutual banks.
Although applying a non-parametric method is justified by the type of bank considered, the observation by Bauer et al. (1998) that in order to be useful for policy and regulatory purposes the two methods should produce at least some consistent results remains cogent. Hence, in our study we accompany
the use of DEA with estimation of a parametric frontier. The results reached by means of the former method will be compared with those yielded by the latter. Given the technological homogeneity of the banks in question and notwithstanding the pronounced differences between the two methods used, it is reasonable to expect the result to be homogeneous to some degree. 1.2 The concept of efficiency
It is appropriate to clarify the notion of efficiency of a production unit. According to Koopmans (1951), a decision-making unit producing a vector of output yusing a vector of input xis technically efficient if:
an increase of one unit of output necessarily implies a reduction of one unit of another output or an increase in the use of at least one input; a reduction of one unit of input requires an increase of another input or a reduction of one output.
In particular, the concept of efficiency underlying the DEA model is that of Debreu (1951) and Farrel (1957) and is based on the radial measure of the possible proportional reduction (expansion) in inputs (outputs) compatible with a given vector of output (input). The radial measure (which is not the only possible measure) has the advantage of allowing immediate economic interpretation of efficiency scores by indicating the possible percentage reduction in the utilization of inputs if efficient production were to obtain. In short, the DEA method identifies as efficient those decision-making units for which there exists no other unit or linear combination of units that can produce a given output with equal or smaller input (or produce equal or the greater output with a given input). The efficient frontier is thus constructed by the linear combination that connects the efficient units, forming a convex set of production possibilities.
The DEA method produces technical efficiency scores ranging from 0 (maximum inefficiency) to 1 (maximum efficiency). By inserting the prices of the productive factors it is also possible to estimate cost efficiency, given by the product of technical efficiency (net of the effect of prices) and allocative efficiency.
Figure 1 illustrates a simplified situation in which an output is produced using two inputs3. There are five production units with different input/output ratios.
Efficiency estimates: methodological aspects 11
The frontier is the piecewise line AA’. The efficient units are the number 2 and 5 whereas the number 1, 3 and 4 are inside the frontier. The segment that radially projects the productive unit on the efficient frontier (1-1’, 3-3’ and 4-4’) measures the technical inefficiency. If factor prices are known, the straight line BB’ is obtained and the allocative inefficiency can be measured (segments 1’-1’’, 3’-3’’ and 4’-4’’).
FIGURE1
1.3 Structure of the paper
Like part of the recent literature, our study is divided into two parts. In the first part we calculate the efficiency score of each individual decision-making unit by applying linear programming techniques and test for the existence of economies of scale. In the second part, we try to “explain” the efficiency scores obtained in the light of environmental and/or operational variables (statistical analysis). From the methodological point of view, we apply a tobit panel regression (Destefanis and Pavone 1996, Casu and Molyneux 2000). An alternative would be to use variables that already incorporate operational and environmental aspects. For example, Siems and Barr (1998) employ variables that reflect the economic result of the bank (net-interest income and 12 Efficiency estimates: methodological aspects
income from services) as outputs. Prometeia (1999) also defines an efficient frontier on the basis of income variables. However, these approaches tend to equate the concept of profitability with that of efficiency, thereby possibly obscuring elements that can be brought out by non-parametric models. For example, where banks that operate in environments of markedly different competitiveness are compared on the basis of profitability alone, the outcome can be that units whose profitability depends on the particular configuration of their market will be defined as efficient, thus possibly concealing inefficiencies in the production process of banks with good profitability. This situation can be significant for institutions such as mutual banks, which operate in markets where the relatively dominant position they used to enjoy is increasingly threatened by the proliferation of bank branches.
2.
Defining the model
2.1 Defining banking output
The application of non-parametric methods for the calculation of efficiency in the banking sector has made considerable headway in the past few years. Research in this field has shown that the DEA and free disposal hull (FDH) methods are well-suited to a typically multi-input, multi-output industry such as banking. On the other hand, there is no consensus on the definition of bank output and the variables representing it (Colwell and Davis 1992, Resti 1994 and 1997). In addition, available data are abundant but of a type not entirely adequate to the requisites of the methodology. Accordingly, conducting a DEA or FDH study preliminarily requires:
a clear definition of the inputs and outputs of banking output (Annex 1-A); an evaluation of the adequacy of the database, with explicit discussion of the motivations and implications of the use of proxies (Annex 1-B). With regard to the first issue, an appreciable variety of models based on different definitions of the output of banking services can be found in the literature. In empirical applications the discussion centres on two main issues: whether deposits should be included in input or output and whether output should be measured in physical or monetary units.
The lack of consensus on a general model makes it advisable for researchers to adopt a pragmatic approach based on theoretical and methodological considerations, the objective of their particular study and the database available. It should also be stressed that the choice of a given approach will not only be reflected in the selection of input and output variables but will also affect the final results (Favero and Papi 1995, Hunter and Timme 1995, Resti 1997).
In this paper we adopt a model compatible with the user cost theory and the value added approach.
2.2 Defining the cost function
The model selected specifies three output variables, three input variables and the related input prices:
Output variables Customer loans Customer deposits Income from services Input variables:
Number of staff Branches
Other administrative costs (including fees and commissions payable) Input prices:
Labour costs/Number of staff
Depreciation plus premises and fixed asset expenses /Branches Other administrative costs/Total assets
The data we use are drawn from the archive of company accounts and (for premises and fixed asset expenses) the archive of supervisory returns, both of which are managed by Federcasse.
2.3 Variables affecting efficiency
As mentioned earlier, after estimating the efficiency scores a second-level analysis is performed in order to identify the variables that influence the level of efficiency found.
Technical efficiency is modelled according to the following schema:
(1) where:
Comp is an index of concentration (used as a proxy of an index of competition) calculated using the following formula4:
16 Defining the model
Comp= (2)
I = 1,...,N are the branches of banks operating in the area; J = 1,...,K are the towns of the area.
In practice, the index is the sum of the bank’s market share in each town, weighted by the bank’s share in the total number of branches.
BalIbsare balance sheet and income indicators:
a) Non interest income (the share of gross income deriving from fees and commissions and from profit on financial operations), which approximates the degree of diversification of the bank’s output. It is taken to be the natural alternative to a reduction banks’ primary source of income, i.e. net interest income. Income diversification should be a sign that the bank is sensitive to market signals and able to adapt to the shifting conditions of the market.
b) Value added per employee (Vap). We expect a positive correlation between Vap and bank efficiency.
c) Ratio of loans to deposits as a proxy of the bank’s market orientation. We expect that banks that are more active in the market need to be more efficient in order to withstand competition.
d) Bad debts over total customer loans is a measure of the risk the bank runs in the course of carrying on business. A negative sign or an insignificant value would indicate that efficiency is not achieved by reducing screening and monitoring activity (and the related costs).
dAreaisare 4 dummies, included in order to test the effect of the macro regions considered (North-West, North-East, Centre and South), i = 1,..n, n=4;
dSizeksare 3 dummies, included in order to test the effect of the different bank size (small, medium, large), k=1,..n, n=3.
All the monetary variables are deflated to 1995 values. The sample consists of 449 mutual banks present throughout the period of time considered (1995-1999).
3.
Empirical findings
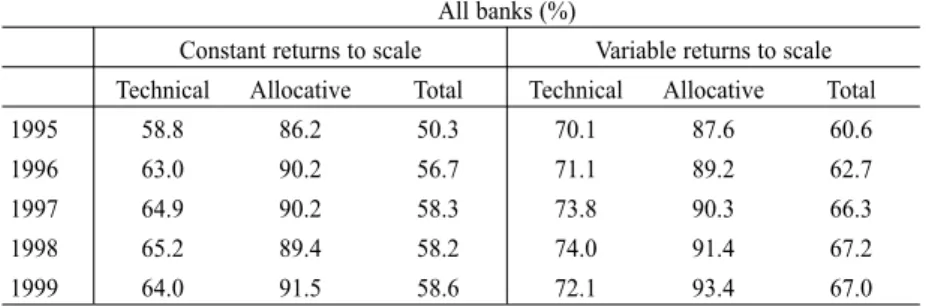
3.1 DEA efficiency scores5
As shown in Table 1, cost efficiency – the product of technical efficiency and allocative efficiency – averages below 70 per cent and exhibits a slightly rising trend, which comes to a halt in 1999. Variability is rather high (from a minimum of 40 per cent to 100 per cent).
Table 1 – Efficiency scores obtained with the DEA method
The decomposition between technical efficiency and allocative efficiency shows that the former is by far the more significant in determining overall (cost) efficiency.
These results are consistent with other studies carried out with different samples and in different countries. For example Berger and Humphrey (1997) surveying 122 studies on bank efficiency point out that: “the mean and median efficiencies for the non-parametric techniques are .72 and .74 respectively (...) the range is .31 to .97”. Our results are also consistent with Resti (1997) and Ferrier and Lovell (1990).
On average, large banks show higher efficiency than the others (except in 1995), whereas medium-sized banks always have the lowest scores (Table 2). 19
All banks (%)
Constant returns to scale Variable returns to scale Technical Allocative Total Technical Allocative Total
1995 58.8 86.2 50.3 70.1 87.6 60.6
1996 63.0 90.2 56.7 71.1 89.2 62.7
1997 64.9 90.2 58.3 73.8 90.3 66.3
1998 65.2 89.4 58.2 74.0 91.4 67.2
1999 64.0 91.5 58.6 72.1 93.4 67.0
Total efficiency is the product of technical efficiency and allocative efficiency.
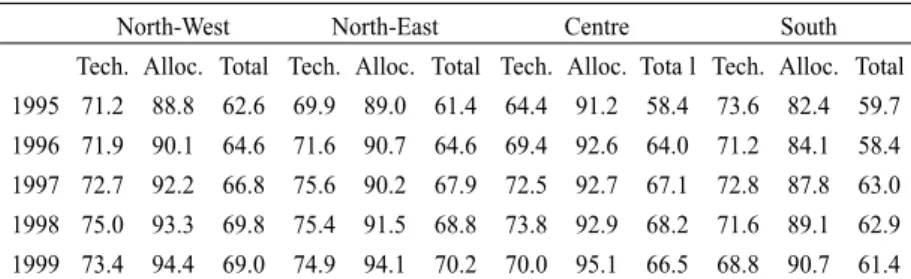
The breakdown by geographical area shows that banks of the North are more efficient, on average, than those of the Centre and South.
The DEA method allows us to calculate economies of scale by comparing the efficiency scores obtained under the assumption of constant returns to scale with those obtained under variable returns to scale. The number of banks with increasing economies of scale is very high (between 70 and 75 per cent of the total).
It is worth noting that scale economies tend to turn from increasing to decreasing when the size of the bank increases (Table 5).
20 Empirical findings
Table 2– Efficiency scores by bank size (% ) (Variable returns to scale)
Large Medium-sized Small
Technical Allocative Total Technical Allocative Total Technical Allocative Total
1995 73.7 87.8 64.7 62.2 89.5 55.1 75.9 85.8 64.1
1996 77.0 91.2 70.1 65.4 91.4 59.7 74.2 86.0 62.5
1997 77.3 93.1 72.0 68.7 90.5 62.0 77.6 88.3 67.7
1998 78.0 92.5 72.1 69.5 91.8 63.5 76.7 90.2 68.4
1999 78.8 93.7 73.8 67.0 94.2 63.0 73.8 92.2 67.2
Table 3– Efficiency scores by geographical area (%) (Variable returns to scale)
North-West North-East Centre South
Tech. Alloc. Total Tech. Alloc. Total Tech. Alloc. Tota l Tech. Alloc. Total 1995 71.2 88.8 62.6 69.9 89.0 61.4 64.4 91.2 58.4 73.6 82.4 59.7 1996 71.9 90.1 64.6 71.6 90.7 64.6 69.4 92.6 64.0 71.2 84.1 58.4 1997 72.7 92.2 66.8 75.6 90.2 67.9 72.5 92.7 67.1 72.8 87.8 63.0 1998 75.0 93.3 69.8 75.4 91.5 68.8 73.8 92.9 68.2 71.6 89.1 62.9 1999 73.4 94.4 69.0 74.9 94.1 70.2 70.0 95.1 66.5 68.8 90.7 61.4
Table 4– Economies of scale (number of banks)
Increasing Constant Decreasing Total
1995 314 26 109 449
1996 337 30 82 449
1997 332 15 102 449
1998 319 16 114 449
3.2 Determinants of efficiency
We analyze the possible determinants of the efficiency scores estimated using DEA by running a panel regression in which the efficiency scores are set in relation to the exogenous variables specified in equation 1. A Tobit model is used in order to avoid possible distortions due to the fact that the dependent variable is constrained between the values of 0 and 1.
Empirical findings 21
Table 5– Economies of scale in 1999 (number of banks)
Increasing Constant Decreasing Total Size (total assets)
Small (up a 50 mill US$) 157 2 0 159
Medium (from 50 to 150 mill US$) 169 8 10 187
Large (over 150 mill US$) 40 10 53 103
Number of branches 1-2 95 6 0 101 3-5 179 5 7 191 6-10 74 6 23 103 over 10 18 3 33 54 Total 366 20 63 100
Table 6– Tobit efficiency estimates
Variable Coefficient z Significativity (1)
Value added per person 0.0003 5.60 *
Non interest income 0.0025 9.05 *
Competition index -0.0346 -2.33 ** Loans/deposits 0.0006 4.33 * Bad loans/Loans -0.0015 -2.27 ** Small 0.0046 0.24 Medium -0.0683 -6.36 * North-West 0.0354 2.12 ** North-East 0.0473 3.57 * Center 0.0317 1.93 *** Constant 0.5401 27.86 * sigma_u 0.0923 30.64 sigma_e 0.0715 59.41 rho 0.6249 0.618 (1) *(1%), ** (5%), ***(10%).
Random effects u_i ~ Gaussian Wald chi2(10) = 294.04 Log likelihood = 2226.0447 Prob > chi2 = 0.0000
Overall, the coefficients are significant and of the expected sign. Efficiency calculated using DEA appears to be linked positively with value added per employee. Diversification of output (non-interest income) and market presence (ratio of loans to deposits) are found to have a positive influence on efficiency. It is interesting to note that the variable that proxies for the level of competition in the local market indicates that as competition increases so does efficiency. The indicator of the ratio of bad debts to total loans is negative, even if not highly significant. This ensures that efficiency is not achieved by saving on screening and monitoring.
The variables of geographical location indicate significantly higher efficiency for mutual banks of the Centre and North than those of the South, while the variables of size indicate that medium-sized mutual banks are less efficient than small ones and large ones.
4.
Comparing parametric and non parametric results
Bauer et al. (1998), try to overcome the simple contraposition of parametric and non parametric approach. Considering that there is no consensus on the best method to measure efficiency and that the method employed affects the results, the authors decline six consistency conditions that should be met when using frontier estimates. Three of those are related to the mutual consistency of the different approaches: a) the efficiency scores should have comparable means and other distributional properties; b) the different approaches should rank the institutions in a similar order and c) should identify mostly the same institutions as best and worst practice. The others require that results should be consistent with reality: 1) stable over time; 2) compatible with market’s competitive conditions; 3) consistent with standard non frontier performance indicators.
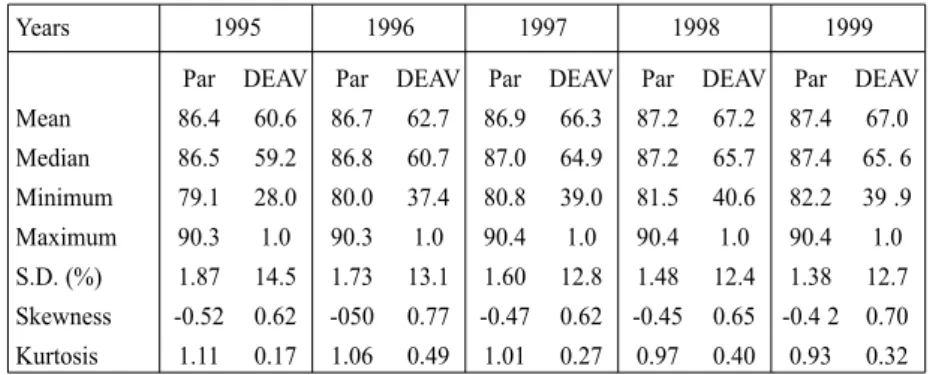
In order to evaluate the results obtained with the two different techniques we first refer to Bauer et al. (1998) consistency conditions. Table 7 reports descriptive statistics of the efficiency scores generated by the two different approaches6.
23
Table 7– descriptive statistics of the efficiency scores
Years 1995 1996 1997 1998 1999
Par DEAV Par DEAV Par DEAV Par DEAV Par DEAV Mean 86.4 60.6 86.7 62.7 86.9 66.3 87.2 67.2 87.4 67.0 Median 86.5 59.2 86.8 60.7 87.0 64.9 87.2 65.7 87.4 65. 6 Minimum 79.1 28.0 80.0 37.4 80.8 39.0 81.5 40.6 82.2 39 .9 Maximum 90.3 1.0 90.3 1.0 90.4 1.0 90.4 1.0 90.4 1.0 S.D. (%) 1.87 14.5 1.73 13.1 1.60 12.8 1.48 12.4 1.38 12.7 Skewness -0.52 0.62 -050 0.77 -0.47 0.62 -0.45 0.65 -0.4 2 0.70 Kurtosis 1.11 0.17 1.06 0.49 1.01 0.27 0.97 0.40 0.93 0.32 Par: parametric; DEAV: DEA variable return to scale
The parametric approach yields a higher average efficiency and displays less variability than the linear programming approach. Moreover, the distributional characteristics of the scores produced by the two methodologies are quite different. To further qualify this evidence we check whether the ranking of banks derived by the two scores are comparable. The results show a significant (at the 1% probability level) but declining correlation in each year (Table 8)
Tables 9 and 10 reports the proportion of banks having efficiency score in the higher 25% and in the lower 25% with both methodologies. The evidence shows that the correspondence is significant at 1%.
24 Comparing parametric and non parametric results
Years 1995 1996 1997 1998 1999 1995 0.517 1996 0.478 1997 0.517 1998 0.420 1999 0.320
Table 9– Correspondence of best practice
Years 1995 1996 1997 1998 1999 1995 50.4 1996 46.0 1997 52.2 1998 46.9 1999 39.8
Table 10– Correspondence of worst practice
Years 1995 1996 1997 1998 1999 1995 46.0 1996 52.2 1997 54.9 1998 44.2 1999 38.9
Table 8 – Spearman rank correlation between parametric and non parametric efficiency scores
At a first look the evidence presented above supports the view that the two methodologies produce comparable results when we analyze the X-inefficiency.
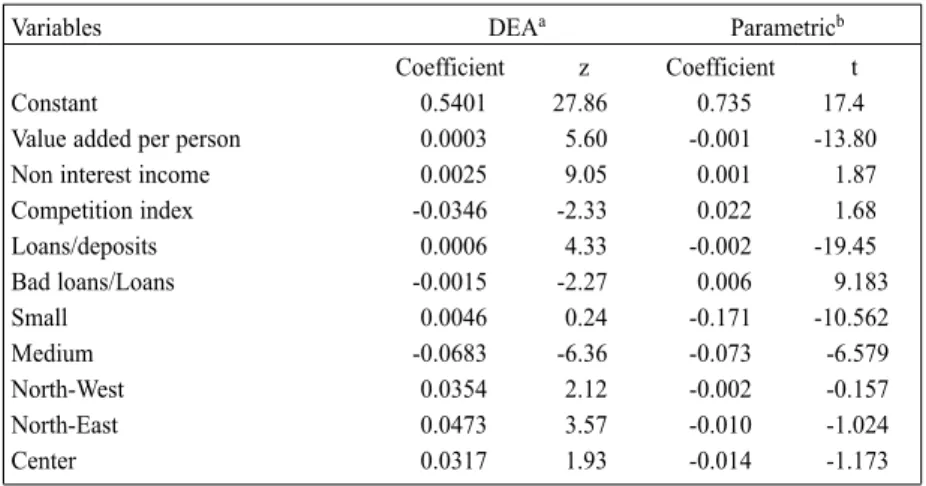
Therefore we go further and we compare efficiency/inefficiency determinants (Table 11).
It is interesting to note that the only variable showing a different effect in the two approaches is the share of non interest income which according to the DEA estimates increases efficiency whereas in the parametric estimates increases inefficiency. The other relevant variables (value added per person, competition index, loans/deposits, bad loans/loans) are significant and affect efficiency in the same way.
Another noteworthy result7is that both methodologies detect the presence of economies of scale, especially for small banks.
Comparing parametric and non parametric results 25
7Tables and calculations are available on request
Table 11– Econometric estimates with DEA scores and translog
Variables DEAa Parametricb
Coefficient z Coefficient t
Constant 0.5401 27.86 0.735 17.4
Value added per person 0.0003 5.60 -0.001 -13.80
Non interest income 0.0025 9.05 0.001 1.87
Competition index -0.0346 -2.33 0.022 1.68 Loans/deposits 0.0006 4.33 -0.002 -19.45 Bad loans/Loans -0.0015 -2.27 0.006 9.183 Small 0.0046 0.24 -0.171 -10.562 Medium -0.0683 -6.36 -0.073 -6.579 North-West 0.0354 2.12 -0.002 -0.157 North-East 0.0473 3.57 -0.010 -1.024 Center 0.0317 1.93 -0.014 -1.173
a)The dependent variable is the efficiency score b)The dependent variable is the inefficiency score
5.
Conclusion
This paper has analyzed the efficiency of co-operative banks in Italy and the findings may be summarized as follow:
➢
There are margins to improve the efficiency of cooperative banks; according to the different methodologies the average inefficiency level ranges from 15% to 33%. Nevertheless this is also the range of inefficiency found in many other studies carried out with different samples and in different countries. Therefore we can presume that cost efficiency in credit cooperative banks is not very different from other financial institutions.➢
Is confirmed the banks located in the North and in the Center of Italy are generally more efficient than the banks located in the South. We also found that there is not a linear relationship between size and efficiency.➢
There is strong evidence of economies of scale especially for small and part of the medium size banks. When the bank size increases, economies of scale tend to turn from increasing to decreasing. This means that efficiency enhancing strategies based only on growing size are viable only for a segment of banks (up to 4-5 branches and 75-100 million USD in assets). Larger banks have to devise more complex strategies.➢
Using statistical analysis we found that there is a significant relationship between efficiency and indicators of productivity, competition, market orientation, revenue diversification. Our reading of these findings is that part of the cooperative banks have opportunely reacted to the new market conditions reaching high level of efficiency. On the other side banks that operate on a lower efficiency level may become vulnerable to changes in their local market.References
Allen, L., Rai, A., (1996) “Operational efficiency in banking: an international comparison, Journal of Banking and Finance 20, 665-672.
Banker R.D., Charnes A., Cooper W.W. (1984) Some model for estimating technical and scale inefficiencies in data envelopment analysis; in Management Science, vol. 30, 1078-1092.
Battese, G. E., Coelli, T., (1992) Frontier production functions, technical efficiency and panel data: with application to paddy farmers in India, Journal of Productivity Analysis 3, 153-169.
Battese, G. E., Coelli, T., (1995) A model for technical inefficiency effects in a stochastic frontier production function for panel data, Empirical Economics 20, 325-332. Bauer P.W., Berger A.N., Ferrier G.D. Humphrey D.B. (1998) “Consistency conditions for
regulatory analysis of financial institutions: a comparison of frontier efficiency methods”, in Journal of Econmics and Business.
Berger N., Humphrey D.B. (1997) Efficiency of Financial Institutions: International Survey and Directions for Future Researches; Wharton Financial Institutions Center Working Paper.
Berger, A.N., Hunter, W.C., Timme, S. G., (1993) The efficiency of financial institutions: a review and preview of research past, present and future, Journal of Banking and Finance 17, 221-49.
Berger, A.N., Mester, L.J., (1997) Inside the black box: what explains differences in the efficiencies of financial institutions? Journal of Banking and Finance 21, 895-947. Cardilli D., Di Battista L., (1997) “Il ruolo del patrimonio nel modello di proprietà
e controllo delle banche di credito cooperativo italiane”; Cooperazione di Credito n. 156-157.
Casu B., Molyneux P. (2000) A comparative study of efficiency in European Banking; Wharton School Center for Financial Institutions, University of Pennsylvania Center for Financial Institutions Working Paper series n.17
Cavallo, L., Rossi, S.P.S., (2000) An X-efficiency analysis of different banking organisational types in Europe. In Bonilla, M., Casasus, T., Sala, R. (Eds.) Financial Modelling, Physica-Springer Verlag, Germany.
Cavallo, L., Rossi, S.P.S., (2001) Do environmental variables affect the performance and technical efficiency of the European banking system? A stochastic frontier approach, European Journal of Finance, forthcoming.
Charnes A., Cooper W., Rhodes E. (1978) “Measuring the efficiency of decision making units”; in European Journal of Operational Research.
Charnes A., Cooper W., Sun D., Huang Z. (1990) “Polyhedral cone-ratio DEA models with an illustrative application to large commercial banks”; in Journal of Econometrics 46, 73-91.
Coelli, T. (1996) A Guide to FRONTIER Version 4.1: A computer program for stochastic frontier production and cost function estimation, Centre for Efficiency and 29
Productivity Analysis CEPA Working Paper 96/07, University of New England Armidale, NSW, 2351 Australia.
Coelli, T. (1996a) A guide to DEAP Version 2.1: A data envelopment analysis (computer) program, Centre for Efficiency and Productivity Analysis CEPA Working Paper 96/08, University of New England Armidale, Australia
Coelli, T., Prasada Rao, D.S., Battese E. (1997) An Introduction to Efficiency and Productivity Analysis, Kluwer Academic Publishers, Boston.
Colwell R.J. and Davis P.E. (1992) “Output and productivity in banking” Scandinavian Journal of Economics, n. 94.
Cusimano G., Vassallo E. (1998) “Redditività ed efficienza delle banche italiane maggiori e grandi”; Il Risparmio n.4-5.
Debreu G (1951) The coefficient of resource utilisation, Econometrica, 19, 273-292. Destefanis S., Pavone A. (1996) “Analisi dell’ efficienza tecnica e banche di credito
cooperativo. Un’ estensione e un’ applicazione dell’ approccio FDH”, Quaderni di Statistica e di Matematica Applicata alle Scienze Sociali, Vol XIII, n. 1-4.
Dietsch, M., Lozano Vivas, A. (2000) How the environment determines the efficiency of banks: a comparison between the French and Spanish banking industries, Journal of Banking and Finance 26 (6) 985-1004.
Di Salvo R., Galassi F., (1997) “Asimmetrie informative e funzione-obiettivo della banca cooperativa locale”; Cooperazione di Credito n. 156-157.
Farrel, M.J. (1957) The measurement of Productive efficiency, Journal of the Royal Statistical Society, Series A, General, 120 (3): 253-281.
Farrel M.J. and Fieldhouse M. (1962) Estimating efficient production function under increasing returns to scale, J. Roy. Statistics SocietySer.A 125, 252-267.
Favero C.A., Papi L. (1995) “Technical efficiency and scale efficiency in the italian banking sector: a non-parametric approach”; Università Bocconi, Workshop su Efficienza, Economie di Scala e Dimensione delle Banche, 21 settembre 1995. Ferrier G.D., Lovell C.A.K. (1990) “Measuring cost efficiency in banking”; Journal of
Econometrics 46.
Ferrier G.D., Kersten K., Vanden Eeckaut P. (1994) “Radial and non radial efficiency measures on DEA reference technology: a comparison using US banking data”; CORE discussion paper n. 9423.
Fried, H.O., Lovell C.A.K., Schmidt, S. (1993) The Measurement of Productivity Efficiency: Techniques and Applications, Oxford University Press, London. Fried H.O., Lovell C.A.K. and Vanden Eeckaut P. (1993) “Evaluating the performance of
US credit unions”; Journal of Banking and Finance, Vol. 17 n.2-3.
Gobbi G., (1995) “L’efficienza e la produttività nelle banche italiane nell’ultimo decennio” in Cooperazione di Credito n.148.
Gobbi G., Pellegrino G. (1995) “La misurazione del prodotto bancario”; Ricerche Quantitative per la Politica Economica, Perugia Convegno B.d’I. CIDE.
Grifell-Tatié E., Lovell C.A.K. (1996) “Profits and Productivity”; Wharton Financial Institutions Center Working Paper.
Humphrey D.B. (1985) “Costs and scale economies in bank intermediation”; in R.C. Aspinwall and R. Eisenbeis, eds., Handbook of banking strategy (Wiley, New York). Hunter W.C. (1997) “Il ruolo delle banche locali e regionali tra concorrenza e progresso
tecnico. L’esperienza degli Stati Uniti”, Cooperazione di Credito 156-7.
Hunter W.C. and Timme S. (1995) “Core deposits and physical capital: a re-examination of bank scale economies and eifficiency with quasi-fixed inputs”, Journal of Money Credit and Banking, N. 27, pp. 165-85.
Koopmans, T. (1951) Activity Analysis of Production and Allocation, John Wiley & Sons, Inc. New York.
Mester, L. (1993) Efficiency in the Saving & Loans industry, Journal of Banking and Finance 17 (2-3) 267-286.
Parigi G., Sestito P., Viviani U. (1992) “Economie di scala e diversificazione nell’industria bancaria: il ruolo dell’eterogeneità tra imprese”; Temi di Discussione Banca d’Italia n. 174.
Prometeia (1999) “Analisi dei bilanci bancari”.
Resti A. (1994) “Il dibattito su efficienza delle banche e economie di scala: il contributo della DEA ed un’applicazione ai dati italiani”; Politica Economica n.2.
Resti A. (1995a) “L’efficienza delle banche italiane: risultati dell’applicazione comparata di tecniche econometriche e matematiche”; in Banca Impresa Società.
Resti, A., (1997) Evaluating the cost efficiency of the Italian banking system: what can be learnt from the joint application of parametric and non-parametric techniques, Journal of Banking and Finance 21 221-250.
Rigon A., 1996. L’analisi della performance, in Marco Onado (a cura di) La Banca Come Impresa, pg. 469-528.
Siems T.F., Barr R.S. (1998) Benchmarking the productive efficiency of US banking; in Financial Industry Studies, Federal Reserve Bank of Dallas.
Tulkens H. (1993) “On FDH efficiency analysis: some methodological issues and applications to retail banking, courts and urban transit”; CORE Reprint n.1046. Tulkens H., Malnero A. (1994) “Nonparametric approaches to the assessment of the
relative efficiency of bank branches”; Core Discussion Paper n. 9447
Vassallo E. (1999) “Efficienza statistica e dimensione del sistema bancario italiano”; Studi e note di economia n.1
Annex 1-A
Methodological approaches to model the production process in the banking industry
Five methodological approaches are most frequently used in the literature: 1. The production approachinterprets the bank as a unit producing services
through the utilization of capital and labour. Output is measured in “physical” quantities (number of accounts, number of transactions, etc.). 2. The intermediation approach interprets the role of the bank as an
intermediary between units in deficit and units in surplus. In this model bank deposits are included among the inputs of production.
3. The asset approachis a variant of the intermediation approach in which liabilities are considered input and assets output.
4. The value added approach treats those financial statement items that absorb a significant share of capital and labour as output and the remainder as either input or insignificant output.
5. Finally, the user cost approach identifies the inputs of the production process in the banking industry as “the net cost a bank must sustain in a given period of time in order to hold one unit of the financial instrument associated with the service”. In operational terms, user cost is calculated as the difference between all the revenues and all the costs (including the opportunity cost) generated by a financial instrument in the bank’s portfolio. For example, the cost of using a bank loan can be approximated by the difference between the interest rate on a riskless security of equal amount (opportunity cost) and the expected yield of the loan. Here again, deposits are included among outputs.
Annex 1-B
The choice of input and output variables
Inputs and outputs are, by definition, flow variables. When flow data are not available, stock variables are used as proxies (implicitly assuming that stocks generate homogeneous flows).
The choice of input and output variables reflects the concept of the production process to be analyzed. In DEA literature there is an abundance of models that use combinations of proxies of capital and labour and variables proxying for bank output.
Input variables:
➢
Labour: the optimal flow variable would be the number of hours actually worked (possibly divided by grade of personnel). The hourly cost of labour would be used as the price. A proxy variable that refers to stocks is the number of staff (assuming that the average number of hours worked is equal) and, for the price, the average wage. Another possibility is to use total labour costs (assuming equality of the price of labour). In this case the different qualities of labour employed are “endogenized”.➢
Capital: the variable should reflect the consumption of physical capital associated with the production process. One flow variable is depreciation. The problem is that the value shown in the financial statements does not express the real “consumption” of capital. The same drawback is also found for the corresponding stock variable that is frequently used, i.e. fixed assets. Another variable used as a proxy of capital is the number of branches.➢
Other administrative costs. These can be approximated by the cost of intermediate goods. Generally, the income statement item “other administrative costs” is used.Output variables: these ought to be the flows of services produced in the time span considered. These are practically impossible to measure with the data available to us. Here again, stock variables (loans and deposits) are used to proxy for flows (Gobbi 1995, Resti 1995a). Whereas for so-called imputed services (services deriving from intermediation activity between units in deficit and units of surplus) the use of stocks is plausible and theoretically justified (Gobbi 1995), for actual services income is used as a proxy. 34
Annex 2
Survey of studies using non-parametric techniques to analyze the efficiency of Italian banks.
Non-parametric methods began to be widely used in studies of bank efficiency in Italy in the nineties. Among the first to adopt them, Resti (1994) applies DEA to the data of a limited sample of banks, developing a model that can be classified as belonging to the value added approach (VAA). More extensive both methodologically and from the standpoint of the database is the study by Resti (1995a), who compares estimations of banks’ efficiency level obtained by applying parametric and non-parametric methods. The sample consists of 270 banks, with data on the annual accounts for 5 years (1988 through 1992). The results show a level of efficiency that is rather stable over time, between 66 and 69 per cent in the constant returns to scale (CRS) model and around 74-75 per cent in the variable returns to scale (VRS) model. The dispersion of efficiency within the sample is pronounced and there is also a significant, stable efficiency differential between banks of the North and those of the Centre and South. Favero and Papi (1995) use the DEA method to measure the technical efficiency of a sample of 174 banks on the basis of data for 1991. They implement two models, one consistent with the intermediation approach (IA), the other with the asset approach (AA). Average efficiency is around 88 per cent (CRS) and 90 per cent (VRS) in the intermediation approach and around 80 per cent (CRS) and 84 per cent (VRS) in the asset approach. After measuring efficiency by applying DEA the authors analyze its determinants. They find a positive relationship with bank size and the share of profits attributable to income from services. Market structure (proxied by a variable based on population and degree of industrialization) is found to have no effect and banks’ regional location a weak effect. Destefanis and Pavone (1996) apply a variant of non-parametric methods called free disposal hull (FDH) characterized by the absence of assumptions on the convexity of the production frontier. In particular, they propose a version of the FDH method “adjusted” to take account of slacks. The analysis is developed using 1994 annual accounts data for a sample of 505 mutual banks and the choice of input and output variables is specified on the basis of the asset approach and the value added approach. The results show average efficiency scores of between 72 and 88 per cent in the models with value-added-approach specification and between 80 and 94 per cent in those constructed according to the asset approach. The authors 35
deepen the investigation of geographical disparities in efficiency with an econometric analysis that utilizes a limited variable dependent (tobit) model. They find that the results depend strongly on the type of model used. Mutual banks in the South are less efficient according to the value added approach, whereas those in the Centre and North-East suffer by comparison under the asset approach. The ratio of bad debts to loans has a negative impact in both specifications, while size has a negative effect on efficiency only under the asset approach.
Cusimano and Vassallo (1998), after conducting a study of profitability of a group of large banks, use the DEA method to evaluate their efficiency under the intermediation approach. The average level of efficiency (calculated for 1995 and 1996) is rather high (between 97 and 98 per cent), although the sample of only 21 banks is very small. Vassallo (1999) applies DEA to a sample consisting of the 40 largest Italian banks for the period from 1991 to 1996. Here again, the efficiency scores are high and increase over time (from 91 to 96 per cent). The technical efficiency of major banks is always higher than that of large and medium-sized banks.
Annex 2 37
AUTHORS OUTPUT VARIABLES INPUT VARIABLES Period Approach Resti (1994) Customer loans Branches 1988-91 VAA
Customer deposits Employees
Net lending to banks Funding from banks +CDs
Resti (1995a) Performing customer loans Employees 1988-92 VAA/UCA Customer deposits Fixed capital
Income from services
Favero Loans to banks Employees
Papi Securities Capital (book value) 1991 AA
(1995) Income from services Loanable funds Financial capital
Loans to banks Employees IA
Securities Capital (book value) Income from services Financial capital Loanable funds
Destefanis Customer loans Customer deposits 1995 AA Pavone Other assets Branches
(1996) Free capital
Employees
Customer loans Branches VAA
Other assets Free capital Customer deposits Employees
Customer loans Branches VAA
Customer deposits Free capital Employees
Cusimano Customer loans Branches 1995-96 IA
Vassallo Securities Employees
(1998) Capital
Reserves Customer deposits
Vassallo Customer loans Employees 1991-96 IA
(1999) Securities Capital and reserves Customer deposits
38 Annex 2
AUTHOR SAMPLE AVERAGE EFFICIENCY SCORES (%)
Resti (1994) 43 MEDIUM-SIZED BANKS 1988-91 N.A.
Resti (1995a) 270 BANKS FOR 5 YEARS 1988 1989 1990 1991 1992 CRS 66.5 68.8 67.9 69.2 67.7 VRS 74.3 75.7 73.9 75.0 73.4
Favero 174 BANKS IA AA
Papi CRS 87.8 79.4
(1995) VRS 90.9 83.9
Destefanis 505 MUTUAL BANKS IA VAA VAA
Pavone a 80.4 73.7 71.8
(1996) b 89.4 81.2 79.4
c 94.9 92.7 88.8
Cusimano 21 MAJOR AND LARGE BANKS 1995 1996
Vassallo CRS 97.0 97.2
(1998) VRS 98.0 98.1
Vassallo 40 BANKS FOR 6 YEARS
(1999) 1991 1992 1993 1994 1995 1996
CRS 85.1 81.5 82.9 86.0 87.2 90.4 VRS 89.2 87.6 90.2 92.8 93.0 94.5
Annex 3
Stochastic cost frontier
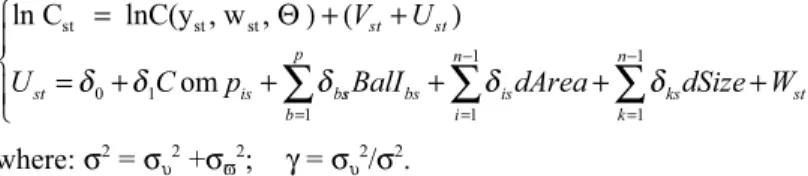
The stochastic frontier model explains the deviation of the observed cost function from the efficient frontier with an error term split in two components: the random noise, and the technical or allocative inefficiency. The cost function can be expressed in this way (Battese and Coelli, 1992):
ln Cit= lnC(yit, wit, Θ) + (Vit+ Uit) i=1,...,N, t=1,...,T (1) where Citis the logarithm of the observed cost of the i-thfirm at time t;
yitis the vector of the output for the i-thfirm at time t; witis the vector of input prices for the i-thfirm at time t;
Θis the vector of unknown parameters;
Vitare random variables which are assumed to be iid N(0, σV2); Uitare non-negative random variables accounting for the inefficiency cost measuring how far the i-thfirm operates above the efficient cost frontier. In this model Uitaccounts for both technical and allocative inefficiencies.
The cost efficiency (EFFit) for the i-thfirm is measured using the following expression:
EFFit= E(Cit| Uit, Xit)/ E(Cit| Uit= 0, Xit) (2)
where Xitare the regression parameters. This expression can assume values between 1 and infinity and it corresponds to eUit.
Using the Battese and Coelli (1995) specification, we can model the inefficiency term, Uit, as an explicit function of a vector of environmental variables zitwhich may influence the i-thfirm’s efficiency:
(3)
Witis the truncation of normal distribution with zero mean and variance σ2. In running the model, the stochastic cost frontier (1) and the inefficiency specification (3) are simultaneously estimated using the maximum likelihood
method, where the likelihood function is expressed in terms of variance parameters σ2=σ
u2+ σv2, and γ= σu2/σ2. The model
In our analysis we employ both the primary stochastic frontier model (Battese and Coelli, 1992) and the model in which the inefficiency term is expressed as a function of a number of explanatory variables (Battese and Coelli, 1995). In both cases we specified the cost function as a translog stochastic frontier.8 The s-th firm total cost can be written as follows:
(4)
where: TC = total cost yiis the i-th output
xkis the price of the k-th input.
The logaritms of yi and xk are all expressed as differences from the mean sample.
In estimating the equation, we impose:
1) the symmetry conditions αij= αji ∀ i, j(i j= 1,...n)
βhk= βkh ∀ i,j(h,k=1,...m)
2) the linear homogeneity conditions by normalizing total cost (TC) and the price of labor (w) by the price of capital (k). This reduces the number of parameters to estimate and corresponds to imposing restrictions on the parameter:
for all i.
We first estimated the cost frontier on the full longitudinal sample, using the Battese Coelli (1992) model. From the estimation of the model we obtained the values of inefficiency for each firm included in the sample. Using these values we compute the average cost efficiency for each class size and for each geographical area.
40 Annex 3
8The translog specification is the most widely used functional forms in the empirical literature on bank efficiency. It presents the well-known advantages of being a flexible form and of including, as a particular case, the Cobb-Douglas specification.
In order to check if differences in inefficiency are influenced by a number of variables we then re-estimated the cost frontier simultaneously with the inefficiency specification term as specified below.
Table reports magnitude and t-statistics of the coefficients of the inefficiency’s determinants obtained by the simultaneous estimation of the following system, using the Frontier 4.1 software (Coelli, 1996):
where: σ2= σ
υ2+σϖ2; γ= συ2/σ2.
42 Annex 3
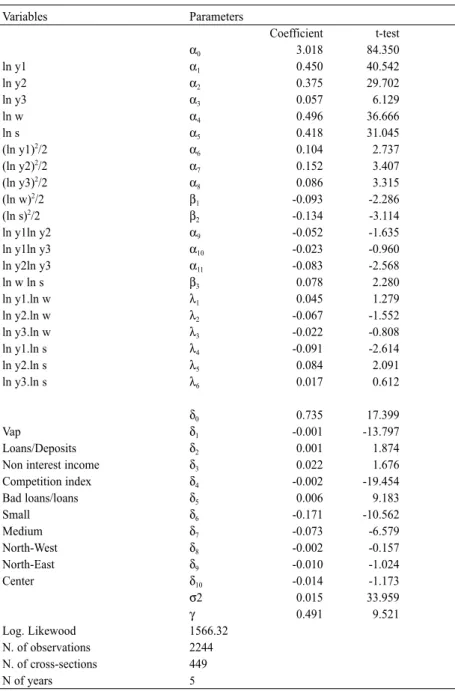
Table A – Translog cost function and inefficiency model estimates
Variables Parameters Coefficient t-test α0 3.018 84.350 ln y1 α1 0.450 40.542 ln y2 α2 0.375 29.702 ln y3 α3 0.057 6.129 ln w α4 0.496 36.666 ln s α5 0.418 31.045 (ln y1)2/2 α 6 0.104 2.737 (ln y2)2/2 α 7 0.152 3.407 (ln y3)2/2 α 8 0.086 3.315 (ln w)2/2 β 1 -0.093 -2.286 (ln s)2/2 β 2 -0.134 -3.114 ln y1ln y2 α9 -0.052 -1.635 ln y1ln y3 α10 -0.023 -0.960 ln y2ln y3 α11 -0.083 -2.568 ln w ln s β3 0.078 2.280 ln y1.ln w λ1 0.045 1.279 ln y2.ln w λ2 -0.067 -1.552 ln y3.ln w λ3 -0.022 -0.808 ln y1.ln s λ4 -0.091 -2.614 ln y2.ln s λ5 0.084 2.091 ln y3.ln s λ6 0.017 0.612 δ0 0.735 17.399 Vap δ1 -0.001 -13.797 Loans/Deposits δ2 0.001 1.874
Non interest income δ3 0.022 1.676
Competition index δ4 -0.002 -19.454 Bad loans/loans δ5 0.006 9.183 Small δ6 -0.171 -10.562 Medium δ7 -0.073 -6.579 North-West δ8 -0.002 -0.157 North-East δ9 -0.010 -1.024 Center δ10 -0.014 -1.173 σ2 0.015 33.959 γ 0.491 9.521 Log. Likewood 1566.32 N. of observations 2244 N. of cross-sections 449 N of years 5
MERGERS AND ACQUISITIONS BETWEEN
MUTUAL BANKS IN ITALY:
An analysis of the effects on performance
and productive efficiency
Roberto Di Salvo,* Maria Carmela Mazzilis*, Andrea Guidi**9 * Federcasse, Research Dept.
Via Massimo D’Azeglio, 33 Rome, Italy Tel +3906482951
** Fondo di Garanzia dei Depositanti del Credito Cooperativo
Abstract
The paper is aimed at testing the hypothesis that the M&A wave over the past ten years has increased the level of efficiency of co-operative credit banks (CCBs), both in terms of overall performance and productive efficiency. The logical development is hinged on two steps: 1) an explorative analysis which is based on the observation of balance sheet ratios by quantiles, 2) a DEA application for estimating productive efficiency scores.
The analysis refers to 94 CCBs which have been involved in M&As over the period 1995-1998 and is carried out on both merged and non-merged banks, either before concentration or in the subsequent years.
9The Italian version of this paper will be published in the Proceedings of the Conference “Competition and Efficiency of Cooperative Banks in Europe; Key-issues for Further Development” held in Rome on 21-22 June 2001, Cooperazione di Credito, n. 173-174, January-March 2002.
We are particularly indebted to Francesco Cesarini and the Advisory Board of the Review
Cooperazione di Creditofor their support and useful comments. We wish to thank David T. Llewellyn who participated at the Conference and helped us frame this work within a broader mutual-issues perspective. Finally, a special thank is addressed to Robert DeYoung for his comments and encouragement for further research.
The explorative analysis mainly shows a higher level of fee-based income for merged banks, which is consistent with the hypothesis that concentration strategies enhance diversification. It also detects some degree of cost reduction just after merging. The DEA application models (CRS and VRS) tends to confirm the results of the previous analysis and estimates higher efficiency for merged banks, a lower efficiency degree for pre-merger banks, and a significant degree of scale economies.
JEL Classification is: G21 G28 Keywords: banks, mergers 46
1.
Introduction, principal conclusions and limitations
In the past few years the Italian banking system has undergone intense restructuring, with an increasing number of bank mergers and acquisitions. The reasons possibly prompting small banks to embark on mergers and acquisitions are manifold: first, the drive to adopt a policy of external growth aimed at economies of scale enabling the institution to enter new markets or defend its local base of operations (strategic-territorial motivations); second, the possibility of diversifying banks’ activities, with the associated benefits in terms of risk control and income growth (strategic-operational motivations); third, the hope of achieving a sounder balance-sheet situation in the face of operational imbalances (rescue motivations). The mix of motivations can vary considerably, depending on the operational position (in balance or not) and the role (active or passive) of the banks involved.
Most of the mergers involving small banks are motivated by the drive to become more competitive (in the case of active banks) and to safeguard balance-sheet stability and profitability (in the case of passive banks). Our study empirically tests whether the numerous concentrations that have taken place in the recent years between mutual banks (banche di credito cooperativo) have actually resulted in gains in operational and productive efficiency.
The analysis we performed on a significant number of concentrations between mutual banks in the four years 1995-98 highlights several economic and strategic factors:
As a rule, the concentrations involved banks with high cost ratios. The improvement in overall operating conditions following mergers and acquisitions was very small.
Concentrations had a marked positive effect on income from services, probably the consequence of an expansion of the range of services offered by the bank resulting from the merger.
Cost efficiency improved slightly following mergers and acquisitions (by an average of 1.7 per cent).
The economies of scale achieved by means of mergers and acquisitions were reasonably significant (5 per cent in the years following the operation).
Despite the relative stability of the results we obtained on a significant number of operations, some of the effects of concentrations may not have been fully captured owing to the limited post-merger observation period, especially in the case of the operations carried out in 1998. Moreover, the nature of financial statement data – for the moment the only data available in time series – precludes developing an analytical model incorporating a wider range of explanatory variables for banks’ production process and hence able to yield a more accurate evaluation of the effects of mergers and acquisitions. 48 Introduction, principal conclusions and limitations
2.
Studies of bank mergers
10Within an extensive study of the restructuring of the Italian banking system in the early nineties, Malavasi (1995) examines some mergers that were carried out in 1993 and 1994, using several financial statement indicators to identify their effects in terms of cost control, product diversification and exposure to credit risk. For the non-parent banks involved, the objectives of cost rationalization were significant and economies of scale tended to emerge gradually with the passage of time. On the other hand, in the case of the parent banks concentrations did not have significant effects, particularly on efficiency levels.
In an analysis of 34 concentrations between Italian banks in the years between 1988 and 1993, Comana (1995)finds that the outcomes depended essentially on the organizational and market compatibility of the banks involved. The empirical results of the analysis were neither unequivocal nor an adequate basis for generalizations concerning the effectiveness and efficiency of mergers.
The study by Resti (1997)considers 67 mergers involving 114 banks between 1986 and 1995 and seeks to identify a measure of “extra-efficiency” that expresses whether and to what extent each bank in the sample was more or less efficient than the benchmark in the pre- and post-merger periods. On average, the results show a gain in efficiency, although the benefits of mergers were particularly significant only where the banks involved had a similar market base and banks resulting from the merger were not overly large.
Giorgino and Porzio (1997) perform a descriptive analysis of mergers, acquisitions and asset transfers in Italy between 1985 and 1997, examine the determinants of these operations and their effects on the banks involved, and investigate the reactions of the market in terms of the value of listed banks. They find strategic-territorial motivations more important than considerations of size, especially in the more recent years. As to the operations’ effects, there was a general increase in the ratio of customer loans to total bank assets, 49
10This survey is limited to the most recent studies carried out in Italy. For the extensive international literature on the subject, see the survey by Berger, Demsetz and Strahan (1998) and the works by Berger and Humphrey (1994), DeYoung (1993; 1997), Pilloff (1994) and Vander Vennet (1996).
a positive impact on indicators of efficiency in the case of mergers and a negative one in that of acquisitions.
Among the most recent studies, Focarelli, Panetta and Salleo (1998)analyze a sample of mergers, acquisitions and majority transfers between Italian banks other than mutual banks in the period 1984-1996. The effects of concentrations, examined by comparing the pre- and post-merger values of financial statement indicators, did not include any gain in cost efficiency for the banks resulting from mergers. However, there was an increase in profitability, with more efficient management of capital and growth in net income from services.
A study by Clemente (1997) of mergers and acquisitions between mutual banks in the period 1990-1994 finds that “strategic” concentrations did not produce significant gains in efficiency and profitability in the short term. In the case of “rescue” operations, there was no appreciable mitigation of the weaknesses of the “passive” banks, especially as regards the quality of the loan portfolio and the shortfall of capital. These findings are in line with those for larger banks involved in concentrations.
A study by Di Salvo, La Torre and Maggiolini (1998) analyzes the determinants of mergers and acquisitions between Italian mutual banks, using a sample of some 130 operations carried out in the period 1990-1997. They find that strategic factors prevailed, in contrast with the emphasis usually placed on rescue motivations. In particular, bank mergers in the North and Centre were primarily motivated by the growth strategies developed by a number of core banks, whereas those in the South more often were dictated by the pursuit of stability.
The present analysis of the effects of mergers and acquisitions on mutual banks’ performance rounds out the previous study within the framework of a line of inquiry that the Research Department of Credito Cooperativo has been developing for a number of years.
3.
Logical structure, method of analysis and data
structure
Analysis of mergers between mutual banks differs from that of the general run of bank mergers in several respects. In the first place, the operations in question exclude acquisitions of control by virtue of mutual banks’ cooperative nature and are not subject to market valuation inasmuch as the banks involved are unlisted. Second, mutual banks’ objective function differs from the conventional one based on the two-fold assumption of profit maximization and cost minimization. In reality, it incorporates composite objectives, among which that of the bank’s stability over time appears to prevail.11In this respect mutual banks constitute a distinct banking industry whose features are better analyzed separately from those of other banks.12 The analysis is therefore logically developed in two phases: a descriptive and exploratory phase, to examine the behaviour of the banks involved in mergers in the light of different parameters (distribution of financial statement ratios by quantiles); and a mathematical and statistical phase (using data envelopment analysis), to estimate banks’ pre- and post-merger efficiency under the two assumptions of constant and increasing returns to scale. The two phases are complementary and entirely consistent with the assumption of a specific objective function of mutual banks. The decision to use a non-parametric method is supported by preliminary investigation showing that the non-parametric technique is well-suited to studying the behaviour of banks of a type where the use of conventional production or cost functions is inappropriate.
Considering the data available for making homogeneous intertemporal comparisons, it was decided to focus on the concentrations that took place between 1995 and 1998. The data are drawn from the Bilbank archive of banks’ annual accounts.
The operations for which it proved possible to analyze a sufficient number of annual accounts numbered 45 and involved a total of 94 banks (Table 1).13
51
11Of course, this objective is compatible with that of maximizing profits in the longer run, allowing for the possibility of deviation from cost efficiency in the short run. See Di Salvo and Galassi (1997) and Cardilli and Di Battista (1997).
12On this subject, see W.C. Hunter (1997).
13Overall, there were 64 concentrations involving 134 mutual banks in the period 1995-98. Our sample thus covers 70.3 per cent of all such operations in the period.
Table 1
Concentrations by geographical area
Concentrations by type of operation
The exploratory analysis was performed using 13 financial statement ratios capable of depicting banks’ operational situation from the point of view of capitalization, risk, profitability, cost efficiency and branch network productivity. The indicators were calculated for the period preceding the concentration on aggregated accounts of the banks participating in the operation; for the post-merger period the ratios were calculated on the accounts of the post-merger bank.14For purposes of benchmarking, the same indicators were also calculated for a significant number of mutual banks for the different reference periods.15
52 Logical structure, method of analysis and data structure
1995 1996 1997 1998 Total Centre 2 1 1 4 North-East 9 8 5 6 28 North-West 3 1 1 5 South 2 4 1 1 8 Total 16 14 6 9 45 1995 1996 1997 1998 Total Mergers 6 5 4 2 17 Acquisitions 10 9 2 7 28 Total 16 14 6 9 45
14The accounts for two financial years preceding the merger and two or three financial years following it were examined.
15The mutual banks analyzed number 469 out of a total of 619 in 1995, 436 of 591 in 1996, 440 of 583 in 1997, and 449 of 563 in 1998. Mutual banks formed in 1993 or later were excluded.
The following parameters were used: Capital indicators
FREE CAPITAL/TOTAL ASSETS (PL/TA) Income indicators
GROSS OPERATING RESULT/ TOTAL ASSETS (RLG/TA) NET INCOME FROM SERVICES/ TOTAL ASSETS (CNS/TA) Cost indicators
OPERATING COSTS/ TOTAL ASSETS (CO/TA) STAFF COSTS/ TOTAL ASSETS (SPER/TA) STAFF COSTS/ NUMBER OF STAFF (SPER/DIP)
OPERATING COSTS/ NUMBER OF BRANCHES (COP/SPORT) OPERATING COSTS/ GROSS INCOME (COP/MINTM)
Productivity indicators
DEPOSITS/ NUMBER OF STAFF (DEPTOT/DIP) LOANS/ NUMBER OF STAFF (CR/DIP)
Distribution indica