LEAF HYDRAULIC GEOMETRY
A Dissertation
Presented to the Faculty of the Graduate School of Cornell University
in Partial Fulfillment of the Requirements for the Degree of Doctor of Philosophy
by
Mónica Juliana Ramírez Carvalho August 2017
LEAF HYDRAULIC GEOMETRY Mónica Juliana Ramírez Carvalho, Ph.D.
Cornell University 2017
The phloem and the xylem form the plant hydraulic system that mediates long-distance water, nutrient, and signaling transport necessary for survival and growth. In leaves, these microfluidic tissues are formed as files of tracheary and sieve elements that ensure the effective distribution of water and the collection of sugars throughout the lamina. The xylem provides the water required to
compensate for water losses during CO2 uptake, and the phloem collects sugar
and provides the osmotically-mediated pressure differential between sources and sinks required for long-distance transport.
Whereas form-function relations of xylem hydraulics have been extensively studied in numerous species and organs, comparatively little is known about many of the basic structural properties of phloem that have direct effects on sap translocation. Using a combination of light, fluorescent,
multiphoton, and transmission electron microscopy, I quantify and compare the phloem and xylem hydraulic structure in two topologically distinct leaf types, Ginkgo and Populus x canescens, which have leaves with an open dichotomous venation pattern and a hierarchical reticulate pattern, respectively.
In both leaf types, phloem and xylem hydraulic transport areas scale isometrically across all leaf vein levels. The conductive areas of individual veins, as well as the cross-sectional areas and lengths of sieve and tracheary elements
increase from minor veins to the petiole in poplar, and from the leaf margin to the leaf base in Ginkgo. This pattern effectively increases sap flow as sugars exit the leaf. At the whole leaf level, however, the hydraulic structure of both leaf types differs significantly. The scaling of Ginkgo hydraulics complies with that observed in single-veined leaves of other gymnosperms, and is consistent with theoretical models based on phloem transport that minimize flow energy
dissipation. The leaf hydraulic structure of both leaf types is consistent with the predictions of Münch’s Pressure Flow Hypothesis.
Finally, previously used models for describing vascular branching render themselves too simplistic and fail to describe the hydraulic geometry of Ginkgo or poplar leaves. However, the scaling of conductive diameters across vein
branching levels are consistent with da Vinci’s area-preservation model, and not with Murray’s law of volumetric conservation.
BIOGRAPHICAL SKETCH
Coffee-addict and obsessive baker, Mónica R. Carvalho (b. 1986,
Medellín, Colombia) is a plant morphologist working on leaf form-function and plant evolution. She obtained a BSc degree in Biology (emphasis in Botany), from the Universidad de Antioquia (Medellín, Colombia) in 2009. During her time as an undergraduate, she volunteered in the Molecular Genetics Laboratory
(Genmol) and worked on the genetic structure of Native American populations and molecular phylogenetics of Andean plants. She joined the Smithsonian Tropical Research Institute in 2007 as an intern, and spent 4 months in northern Colombia digging for fossil plants and vertebrates at the fossil sites now
considered to contain the remains of the earliest known Neotropical rainforest. Between 2007 and 2009 she worked on various projects including leaf
architecture of Malvaceae and plant-insect interactions.
In 2009, Mónica moved to State College, PA where she worked under the supervision of Dr. Peter Wilf on various fossil sites from the Paleocene and early Eocene of Patagonia. She contributed with the description of the fossil ferns from the Laguna del Hunco fossil site and obtained a MSc in Geosciences from the Pennsylvania State University in 2011. She then pursued a PhD in Plant Biology at Cornell University, where she worked on form-functions relations in leaf vasculature under the advisory of Dr. Karl Niklas.
Mónica will continue to work on leaf morphology as a postdoctoral fellow at the Smithsonian Tropical Research Institute.
ACKNOWLEDGEMENTS
The work here presented is based upon research conducted at the Cornell High Energy Synchrotron Source (CHESS), supported by the National Science Foundation (NSF) and the National Institutes of Health/National Institute of General Medical Sciences under NSF award DMR-1332208; the Macromolecular Diffraction at CHESS (MacCHESS) facility, supported by award GM-103485 from the National Institute of General Medical Sciences/National Institutes of Health; and made use of the Cornell Center for Materials Research (CCMR) Shared Facilities, supported through the NSF MRSEC program (DMR-1120296). Imaging data was acquired through the Cornell University Biotechnology Resource
Center, with NYSTEM (CO29155) and NIH (S10OD018516) funding for the shared Zeiss LSM880 confocal/multiphoton microscope. This PhD was partly funded by the Schlumberger Faculty for the Future Foundation.
None of the work here presented would have been possible without the unconditional support provided by my Doktorvater Professor Karl J. Niklas, whose utmost encouragement and unconditional support were essential for developing this work. His vision on plant structure and evolution has been and will always be an inspiration. I thank my committee members, Robert Turgeon and Tom Owens, for the very vivid and insightful discussions they enabled. I could not have asked for a finer committee.
I especially thank William Crepet for all his support during these years, and for all his helping when I needed it most.
Numerous people contributed to this project in technical or logistical support. I would like to thank Arthur Woll (CHESS), Edward Cobb, Maria
Gandolfo, Nicholas Glynos, Adrienne Roeder, Lilan Hong, Leon Kochian, John L. Grazul (CCMR), Rebecca Williams and Joanna de la Cruz (Imaging Facilities, Cornell Biotechnology Center) for their help at various instances in the
development of this work.
I thank Karin Jantz, Tara Nihill, and Tara Reed, who endured all of my last minute administrative, financial, and scheduling requirements during these years.
Finally, I thank my friends and family. In the midst of graduate school-life, those closest to us become our family. Samir Kiuhan, Francisco Leal, José Vargas, Diego Muriel, Camila Martinez, Juana Muñoz, Gwynne Lim, Simon Gunner, Thereis Choo, CT Chua, Amin Saied, Clare Saied, Max Fishman, Ian Small, Andy Read, et alia …
TABLE OF CONTENTS Biographical Sketch Acknowledgements List of Figures List of Tables List of Abbreviations Chapter I: INTRODUCTION Chapter II:
SPATIOTEMPORAL DISTRIBUTION OF ESSENTIAL ELEMENTS THROUGH Populus LEAF ONTOGENY
Chapter III:
THE SCALING OF THE HYDRAULIC ARCHITECTURE IN POPLAR LEAVES
Chapter IV:
HYDRAULIC ARCHITECTURE OF Ginkgo LEAVES Concluding remarks Bibliography iii iv vii x xi 1 10 35 69 99 112
LIST OF FIGURES
Figure 2.1. Composite µ-XRF maps of the abundance of Ca, K, and Zn in developing leaves of grey poplar at different stages of leaf development.
Figure 2. 2. Elemental µ-XRF map for Zn abundance for developing leaves of grey poplar.
Figure 2.3. Elemental µ-XRF map for Ca for developing leaves of grey poplar.
Figure 2.4. Variation in Ca abundance along longitudinal transects across grey poplar leaves in different stages of development. Figure 2.5. Elemental µ-XRF map for K for developing leaves of grey poplar.
Figure 2.6. Leaf growth parameters and changes in element
abundance in relation to leaf development and the transition from phloem importing to phloem exporting, as denoted by the shaded blocks.
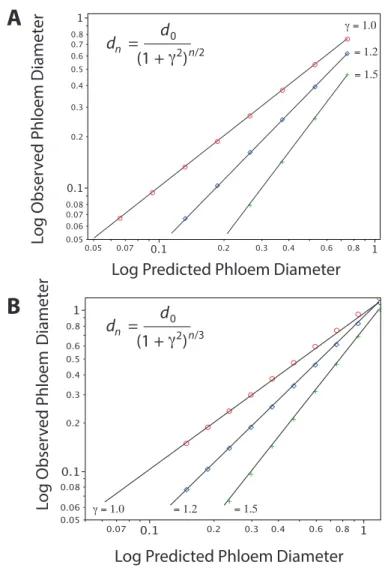
Figure 3.1. Populus x canescens leaf morphology and anatomy. Figure 3.2. Schematics for open dichotomous hydraulic networks with equal and unequal branching orders, and derivation of scaling relationships between parent branch order diameters and higher branch orders predicted by da Vinci’s and Murray’s model. Figure 3.3. Bivariate plots of observed vs. predicted phloem
diameters using da Vinci’s model and Murray’s model showing the effects of unequal diameters of corresponding branches.
Figure 3.4. Mean phloem and xylem conductive areas of single veins, across seven vein orders and petiole, in leaves of Populus x canescens.
Figure 3.5. Total phloem and xylem conductive areas in leaves of Populus x canescens.
Figure 3.6. Allometric relationship of sieve tube member diameter and length across seven veins orders of leaf vasculature and petiole of Populus x canescens. 20 22 23 25 27 28 44 47 49 51 51 53
Figure 3.7. Allometric relationship of metaxylem vessel member diameter and length in leaves of Populus x canescens.
Figure 3.8. Allometry of phloem and xylem conductive areas across seven vein orders and petiole of leaves of Populus x canescens. Figure 3.9. Representative cross-sections of the seven vein orders in leaves of Populus x canescens.
Figure 3.10. Measured and predicted phloem conductive diameters, estimated following DaVinci’s rule and Murray’s law.
Figure 3.11. Phloem and xylem hydraulic coupling model for source leaves of Populus x canescens.
Figure 4.1. Strahler numbering system for vein orders and the positions of arcs used to sample veins shown on a representative Ginkgo leaf.
Figure 4.2. Vascular anatomy of Ginkgo leaves.
Figure 4.3. Illustration of an open dichotomous branching system depicting da Vinci’s and Murray’s models and derivation of scaling relationships between parent branch order diameters and higher branch orders predicted by da Vinci’s and Murray’s rules.
Figure 4.4. Conductive areas of phloem (Aphl) and xylem (Ax) of individual veins, measured in five leaves of Ginkgo biloba. Figure 4.5. Sieve cell and tracheid dimensions measured from individual vein segments in leaves of Ginkgo biloba.
Figure 4.6. Bivariate log-log plot of the isometric relationship between phloem conductive area and xylem conductive area in each of five Ginkgo biloba leaves.
Figure 4.7. Phloem conductive area (Aphl), normalized conductive area, and total conductive area plotted as functions of leaf length and normalized leaf length.
Figure 4.8. Bivariate plot of observed sieve cell conductive diameter (d) across all five Ginkgo leaves plotted against predicted cell
diameter using da Vinci’s model and Murray’s model.
54 55 57 59 66 75 77 80 83 85 86 88 90
Figure 4.9. Hydraulic models for three different vascular topologies represented by open dichotomous vasculature of Ginkgo, single veined vasculature of Pinus and hierarchical reticulate venation in poplar.
Figure 5.1. Allometry of sieve elements of poplar and Ginkgo. Blue depicts poplar, orange depicts Ginkgo.
Figure 5. 2. Representative vein cross-sections showing the grid-like anatomical organization of sieve cells in leaves of Ginkgo. Arrows indicate sieve cells completely surrounded by other sieve cells and therefore lacking direct contact with transfusion cells.
Figure 5.3. Observed and expected numbers of sieve elements in the petiole of poplar and Ginkgo. Expected values were estimated using the mean total numbers of 7th order veins in poplar leaves and the mean total number of veins of rank 1 in leaves of Ginkgo, and assuming that sieve element conduits do not merge along the vascular pathway.
Figure 5.4. Network analysis of a representative leaf fragment of poplar indicating the redundancy in phloem transport pathways when phloem translocation is restricted to veins of decreasing order. A. Sample image. B. Fourteen pathways between a single 7th
order vein and the major veins. C. Shortest pathway. D. Longest pathway. 94 103 104 105 110
LIST OF TABLES
Table 4.1. Coefficients for multiple linear regressions of phloem conductive areas on vein rank and distance from the leaf base. Regressions are leaf-specific and were subsequently used to estimate total conductive areas at any given distance from the leaf base. a, vein rank coefficient; b, distance from leaf base
LIST OF ABBREVIATIONS
Aphl Phloem conductive area Ax Xylem conductive area
cleaf Sugar concentration in the leaf phloem (sources) croot Sugar concentration in the roots (sinks)
do Conductive diameter at branching level 0 dn Conductive diameter at branching level n KT Phloem conductance
LPI, lp Leaf plastochron index
Pleaf Phloem pressure at the leaf (sources) Proot Phloem pressure in the roots (sinks) Q Volumetric flow rate
r Phloem conduit radius STM Sieve tube member VM Vessel member R Ideal gas constant
T Temperature
𝜂 Viscosity
CHAPTER I
INTRODUCTION
The phloem and xylem constitute the long-distance hydraulic transport system in vascular plants that mediates water and nutrient allocation as well as the signaling necessary for survival and growth. The evolution of these two tissue systems overcame the diffusional limitations of internal water and nutrient transport in terrestrial plants, and favored the concomitant evolution of larger body plans on which leaves later developed.
This work
The thesis presented herein contributes to filling the conceptual gap
between phloem and xylem hydraulic research. Historically, plant hydraulics has been dominated by research on the xylem and water transport processes under the premise that these are the backbone of whole plant physiological
performance (Tyree & Zimmermann, 2002; Brodribb, 2009; Sack et al., 2015).
However, increasing evidence indicates that phloem dynamics equally
determine plant hydraulic performance (see Knoblauch & Peters, 2016; Savage et
al., 2016). This thesis examines the functional and structural coupling of the
phloem and xylem hydraulic systems leaves of Ginkgo biloba L. and Populus x
canescens (Aiton) Sm. (also known as Populustremulax alba). The leaves of these two taxa have an open dichotomous and a hierarchical reticulate venation pattern, respectively. They therefore represent two distinct topological types
and extinct plants. Chapter 2 examines the structural and functional coupling between phloem and xylem in minor veins required for leaf photosynthetic maturation during the sink-to-source transition. Using a state-of-the-art elemental analysis technique, the coordination between phloem and xylem
maturation was examined across a leaf developmental gradient. Chapters 3 and 4
describe the leaf hydraulic architecture of Ginkgo and poplar, and examine the
scaling relationships across levels of vein branching and between the phloem and xylem hydraulic architectures. Two structural branching models were used to test for scaling relationships across vein branching levels: da Vinci’s rule and Murray’s Law, which predict for area- and volumetric-preserving scaling
relationships across vein branching levels, respectively. These two chapters also emphasize the hydraulic linkages with the xylem that are required for adequate phloem transport. Finally, Chapter 5 compares the leaf hydraulic geometry of
Gingko and poplar in relation to topology, phloem transport, and future efforts to provide biologically sensible models for phloem transport.
Background: Structure and function of vascular tissues
Together, phloem and xylem form parallel microfluidic systems with different conductive properties and driving forces. Xylem conduits are nearly hollow tubes formed by files of lignified tracheary elements (tracheids or vessel elements) connected end-to-end. Because tracheary elements are dead, water conduction occurs through the apoplast and is driven by the hydrostatic pressure gradient between the roots and leaf evaporative surfaces. Inside the xylem
conduits, cohesion forces between water molecules maintain the integrity of the water column and allow for the ascent of water against the gravitational force.
Even though controversy remains around the adhesion-cohesion theory (Pickard and Melcher, 2006), the biophysics of xylem flow has been described extensively generally from the perspective of simplified pipe systems with laminar flow that follow the fluid mechanics described by Hägen-Poiseuille formulations (e.g., Tyree and Zimmermann, 2002).
In contrast, phloem conduits are formed by files of living sieve elements that therefore mediate flow though their symplast. Sieve elements are devoid of most organelles at maturity and are connected end-to-end via clusters of pores or plasmodesmata-like channels, forming a low-resistance pathway between
photosynthetic (source) and metabolically active or storage (sink) tissues.
Currently, Münch’s Pressure Flow Hypothesis remains the most widely accepted model for phloem flow. This hypothesis states that transport through the phloem follows an osmotically-generated hydrostatic pressure gradient between sources and sinks (Münch, 1930). Experimental evidence indicating mass flow though the phloem is consistent with predictions from Münch’s Pressure Flow Hypothesis
(Kockenberger et al., 1997; Knoblauch & van Bel, 1998; Imlau, 1999; Windt et al.,
2006). However, whether the physical mechanisms that control phloem transport are related to changes in the turgor pressure gradient or biologically-induced changes in flow resistance remain poorly understood (Knoblauch & Oparka, 2012). This gap in our knowledge is particularly true in the case of trees, in which the observed turgor pressure gradients are much lower than those of herbaceous plants, despite the longer distance (and thus higher total resistance) between sources and sinks (Turgeon, 2010). Most of the basic phloem structural
dynamics predict that flow resistance and flow velocities are inversely related, and that flow resistance decreases with increasing sieve element and sieve pore
areas. Reports by Müllendore et al. (2011) and Froelich et al. (2011) compared
observed phloem flow velocities with resistance estimates based on sieve pore and sieve element areas, and found that the observed relationship between flow velocity and resistance did not meet expectations. Instead, an inverse relation between the areas of sieve elements and flow velocity was observed, indicating that some of the basic assumptions involved in estimating phloem transport need to be revised (Knoblauch & Oparka, 2012).
Relationships between phloem transport and hydraulic structure
Direct and concurrent measurements of the parameters required to describe phloem transport, such as turgor pressure, flow velocity, symplast viscosity, and conduit geometry, are difficult to obtain, in large part owing to intrinsic features of phloem conducting cell types. For example, sieve elements are thin walled, operate under positive pressure, and are deeply buried under layers of tissue. Collectively, these features make sieve elements highly
susceptible to mechanical damage that, in turn, makes measurements of phloem translocation inherently difficult to visualize and quantify in living plants.
Nevertheless, Knoblauch et al. (2016) recently examined the relationship between
plant height, phloem conduit conductance, and turgor pressure gradient using newly developed methods for direct pressure measurements in intact sieve elements. They found that the turgor pressure gradient and sieve tube
conductivity increase notably as the distance between source and sink tissues increases with plant height. Their observations were consistent with predictions
based on Münch’s Pressure Hypothesis and highlight the basic form–function coupling in phloem structure.
Given the difficulties in quantifying phloem flow, hydrodynamic models based on Münch’s hypothesis and Hägen-Poisuille formulations have provided insight into the relation between phloem geometry and transport dynamics. For example, the geometry of sieve elements has been found to maximize
translocation rates in relation to transport distances (Jensen et al., 2011), and the
resistance of sieve plates has been found to scale with the sieve element lumen
resistance (Jensen et al., 2012b). Similarly, the geometry of phloem conduits
imposes upper boundaries to sugar loading such that the concentration of sugars in the phloem is sufficiently high to maintain the osmotic-mediated hydrostatic pressure required for phloem translocation, but also sufficiently low to keep sap
viscosity from obstructing phloem flow (Hölttä et al., 2006; Jensen et al., 2013).
Finally, the differences between the geometry of the sieve tube members of most angiosperms and sieve cells of gymnosperms may explain the slower phloem flux rates observed in gymnosperms compared to those of angiosperms (Liesche
et al., 2015). Some of these formulations have successfully predicted flow dynamics in microfluidic systems that mimic long-distance phloem transport
(Comte et al., 2017).
Most of these studies rely on simplifying phloem structures as single tubes formed by files of cells of constant size (Thompson and Holbrook, 2003). Many structural factors such as variable sieve tube size and interconnections between sieve tubes however are known to contribute to transport dynamics. More
relation to phloem structure, detailed descriptions of phloem conduit dimensions and connectivity are still required for a better understanding of phloem
transport. The results presented in chapters 3 and 4 attempt to contribute to our understanding of the basic structural measurements required for describing the
phloem transport pathways in source leaves of Ginkgo and poplar.
Hydraulic coupling of phloem and xylem
Increasing evidence indicates that the phloem and xylem are functionally coupled in ways that ensure the transport of water and photosynthates (Savage
et al., 2016). Daily variations in phloem cell diameters within trees reflect changes
in the radial hydraulic conductance between the xylem and phloem (Sevanto et
al., 2011), and indicate the effective movement of water between both tissues
along the transport pathway. This exchange allows for xylem to provide phloem
with the water required for maintaining sugar translocation rates (Hölttä et al.,
2006; Windt et al., 2006), and for phloem water to move back into the xylem
following a water potential gradient. The latter scenario is intensified under drought conditions and represents an instance in which phloem acts as a water
reservoir for water movement through the plant (Zweifel et al., 2000; Sevanto et
al., 2005). It has also been suggested that phloem is functionally involved in
mechanisms for xylem embolism repair (Salleo et al., 2009; Nardini et al., 2011;
Brodersen & McElrone, 2013).
The structural linkages between phloem and xylem are also seen in the scaling relationships between the functional conductive transverse areas of both transport tissues in stems and leaves (Mencuccini et al., 2011; Jyske and Hölttä, 2015; this thesis). However, the hydraulic, mechanical, and physiological
implications of these scaling relationships remain unknown or at best poorly understood. This gap in our knowledge is largely due to a paucity of data quantifying the dimensional architecture of the phloem. Although the structure-function relationships of tracheary cell-types have been widely studied (e.g., Roth et al., 1995; Zwieniecki et al., 2002, 2007; Sack et al., 2004), the structure-function relationships of sieve cells and sieve tube members are still rarely reported (see however Petit and Crivellaro, 2014; Woodruff, 2014; Jyske and Hölttä, 2015).
The findings presented in chapter 2 provide evidence of the hydraulic coupling between phloem and xylem during leaf development, and the results shown in chapters 3 and 4 provide evidence of the structural link between both
tissues in source leaves of Ginkgo and poplar.
Leaf hydraulic structure
Leaf vasculature provides mechanical support (Niklas, 1999) and ensures an effective distribution and collection system for water and sugars throughout the leaf lamina. The hydraulic structure of the leaf comprises the collection of transporting phloem and xylem conduits in the vasculature, and is determined by vascular topology (the spatial configuration of veins in a leaf) and conduit geometry, e.g., cell diameter and length.
Sugar loading in leaf phloem is essential for plant survival because it provides the osmotically-mediated pressure differential between sources and sinks required for long-distance transport (Münch, 1930; Turgeon & Ayre, 2005;
focuses on the xylem, partly because the physics of water flow through hollow conduits is well established. For example, xylem geometry (the radii and numbers of vessels) is closely related to water transport efficiency
(Roth-Nebelsick et al., 2001; Sack & Scoffoni, 2013). Wide vessel member lumens such as
those in major veins enable greater hydraulic conductivity in accordance with the
Hagen-Poiseuille equation (Sperry et al., 2005; Sommerville et al., 2012), although
they also increase the susceptibility to embolism (Brodribb et al., 2016) due to the
number of inter-conducting pit membranes present in larger vessels (Hargrave et
al., 1994; Wheeler et al., 2005; Lens et al., 2011). Similarly, the length of veins per
leaf area (VLA) is linked to enhanced hydraulic conductance and broadly
correlates with gas exchange rates (Sack & Frole, 2006; Brodribb et al., 2007; Boyce
et al., 2009; McKown et al., 2010).
The architecture of leaf venation is related to a number of other
functionalities (Roth-Nebelsick et al., 2001). However, the relationship between
leaf topology and hydraulics has not been thoroughly studied. Most studies only evaluate broad aspects of reticulate venation and are mainly focused on their relation to water transport (e.g., Roth et al., 1995). For example, the topology of looped vascular networks as opposed to less interconnected systems confers redundancy in transport pathways, resilience to damage (Wylie, 1951), an advantage against herbivory (Haberlandt, 1914; Wagner, 1979), and higher
hydraulic conductance due to increased vascular connectivity (Roth-Nebelsick et
al., 2001). Recent theoretical approaches indicate that vein interconnectivity also
provides flexibility in coping with fluctuating loads (Katifori et al., 2010; Corson
et al., 2010). Even though the ideas of redundancy and response to fluctuating loads are in principle applicable to phloem transport, the effects of vein damage
in reticulate veined leaves are likely to differ for water and for phloem transport (Wylie, 1938; Roth-Nebelsick et al., 2001). The effective redundancy of leaf vasculature depends on the adequate movement of water and solutes between adjacent tracheary or sieve conduits within vascular strands. Whereas adjacent vessels and tracheids are connected by pores that enable water flow, the lateral connectivity between sieve cells and sieve tube members is more restricted. The number of lateral sieve areas connecting adjacent sieve tubes and sieve cells determines the potential interconnectivity between adjacent conduits within a vascular strand.
The following chapters contribute to our understanding of leaf
vasculature by describing the leaf hydraulic structure of Ginkgo and poplar in
relation to their vascular topology. Finally, the section on Concluding remarks examines the implications of these topologies on the physiological processes involved in the phloem loading and on the pathways for phloem export.
CHAPTER II
SPATIOTEMPORAL DISTRIBUTION OF ESSENTIAL ELEMENTS
THROUGH Populus LEAF ONTOGENY
Mónica R. Carvalho1, Arthur Woll2, Karl J. Niklas1,
1School of Integrative Plant Sciences, Plant Biology Section, Cornell
University, Ithaca, NY 14853, USA
2Cornell High Energy Synchrotron Source, Cornell University, Ithaca, NY
14853, USA
Published: Journal of Experimental Botany 67 (9): 2777-2786, 2016
Short running title: Element distribution in developing leaves
Research highlight
We document the preferential spatiotemporal distribution of Zn, Ca and K throughout a developmental sequence at the organ level, and match the compartmentalization of Ca in poplar leaves with the enhancement of the evapotranspiration stream and phloem maturation.
Abstract
Optimal concentrations and distribution patterns of essential elements in plants can vary spatially and temporally. Here, we examine the
spatiotemporal distribution and accumulation of zinc, calcium, and
potassium throughout leaf growth and maturation. Eight developing leaves
of grey poplar (Populus x canescens) covering leaf plastochrons 1 through 10
were selected to ensure observation of the sugar sink-to-source transition. This transition requires coordinated changes of multiple core metabolic processes, and is expected to involve alterations in essential and non-essential element distributions as tissues mature and effect a reversal in phloem flow direction. Whole-leaf elemental maps were obtained from dried specimens using micro x-ray fluorescence spectroscopy. Additional cross-sections of fresh leaves were scanned to check for tissue-specificity in element accumulation. Whereas the anatomical distribution of Zn and K remains relatively consistent throughout leaf development, Ca accumulation varied across leaf developmental stage. Allocation of Ca into the leaf
mesophyll occurs basipetally, matching spatially and temporally the sequence of phloem maturation, positive carbon balance, and sugar export from leaves. The accumulation of Ca likely reflects the maturation of xylem in minor veins and the enhancement of the transpiration stream. Our results independently confirm that xylem and phloem maturation is spatially and temporally coordinated with the onset of sugar export in leaves.
Introduction
Essential elements (e.g., Zn, Ca, and K) are required for adequate
plant growth and reproduction (Hawkesford et al., 2011). Along with other
non-essential elements, these are taken up by roots from the soil and are subsequently moved into the shoot by long distance transport (White, 2011). Once within the shoot, their distribution and compartmentalization varies both spatially and temporally across organs and tissues, following metabolic requirements and uptake availability (Conn & Gilliham, 2010).
Element requirements and tolerance widely vary at the tissue, cellular and subcellular levels. Whereas some elements exist within a broad
concentration range, others become toxic if they accumulate beyond a critical level, indicating that metabolic controls must sense and regulate the targeted translocation of elements in order to maintain plant function. Transport proteins found in xylem and phloem tissues have been shown to mediate the movement of some essential elements into and out of the vascular system of
several species (Yamaji & Ma, 2014; Zhai et al., 2014). However, the specific
mechanisms and timing behind the preferential distribution and
accumulation of most essential elements between cell types in plants remain poorly known (Yamaji & Ma, 2014). The documentation of spatiotemporal patterns of essential element accumulation at the organ and tissue levels is necessary for gaining deeper insights into mineral distribution,
sequestration, and compartmentalization of essential elements in plants. Our knowledge on the distribution of elements at a macroscopic level has greatly increased in the past two decades with the application of
numerous techniques that allow fast in situ detection and quantification (Wu
& Becker, 2012; Zhao et al., 2014). Interest in the accumulation of heavy
metals has driven the application of less traditional methods such as energy dispersive x-ray microanalysis (EDX) and proton-induced x-ray emission (PIXE) for detecting distribution of macronutrients or heavy metals in hyper-accumulating plants at the cellular level. However, mapping the distribution of non-metalloid and/or lighter elements at low concentrations remains challenging and requires analytical methods that provide both high
sensitivity and high spatial resolution. Synchrotron-based techniques using high-energy photon beams that allow for the detection of a wide array of elements have proved useful for visualizing element distribution at the tissue, cellular, and subcellular levels. Recently developed detector systems for synchrotron-based micro x-ray fluorescence (µ-XRF) spectroscopy have enhanced detection speed as well as the ability to spatially resolve elements in low concentrations (Kirkham et al., 2010). This method has been
successfully used to document in situ distributions of elements in
commercially important crop plants including wheat (Regvar et al., 2011),
rice (Moore et al., 2014) and grapefruit (Tian et al., 2014), and in the
hyper-accumulator Noccaea (Thlaspi) praecox (Koren et al., 2013).
Here, we make use of synchrotron-based µ-XRF to explore the temporal and spatial accumulation of essential elements in developing
leaves of grey poplar (Populus x canescens.). As in many other species, the leaf
primordia of this species act as sinks that rely on carbohydrates and other nutrients that unload from long distance phloem transport. As leaves grow
become net sources of photosynthates to newer developing leaves. This sink-to-source transition denotes the irreversible loss of import capacity and the initiation of net carbon export from leaves as they reach full maturity. This process requires a shift in transport direction and involves major changes in central metabolism, enzymatic machinery, symplastic connectivity, and anatomical modifications that are expected to correlate with element provenance, requirements, and allocation (Turgeon, 2006).
The distribution of essential elements in leaves is expected to match metabolic requirements throughout leaf ontogeny. The sink-to-source transition in developing leaves provides a system in which to follow
preferential element distribution in relation to the mechanical and metabolic changes associated with leaf growth. Because most developing tissues have low transpiration rates, young leaves are mostly unlinked from the
transpiration stream and must rely on phloem transport for delivery of nutrients and mineral elements. As sink strength decreases, an increasing proportion of the inorganic nutrients entering the leaves come directly from the roots and through the xylem (Milthorpe & Moorby, 1969). Net
concentrations of essential elements in leaves vary through development as cell division ceases and differentiation initiates. For example, phosphorous
distribution and accumulation in developing leaves of Cucumis sativus has
been well documented to reach a maximum concentration before the sink-to-source transition occurs and subsequently declines due to net export
initiation (Hopkinson, 1964). Contrastingly, the targeted translocation of xylem-transported elements such as Ca from fully mature leaves is unlikely given that specific transport proteins mediating their export have not yet
been found in phloem and that Ca specifically is known to have low phloem mobility. The accumulation patterns differ between mineral elements (Meiri
et al., 1992; Karley et al., 2000; Karley & White, 2009) and are likely to reflect nutrient function, tissue specificity, and differences in transport pathways. However, the preferential distribution and temporal behavior of most mineral elements in leaf tissues remains unknown.
Our goal in this study was to examine the spatiotemporal distribution and the relative abundance of mineral elements throughout leaf growth and maturation. We here describe the distribution of potassium, calcium, and zinc in leaves of grey poplar, making reference to leaf growth, anatomical development and photosynthetic sink to source transition. The distribution of these three elements were emphasized because K is the most abundant cation in plants, Ca has low mobility in the phloem, and Zn is a well studied trace-element model.
Materials and Methods
Plant material and growing conditions
Grey poplar (Populus x canescens) was selected as a model species
because it belongs to a species complex whose leaf development has been extensively studied and in which the use of leaf plastochrons has provided a precise ontogenetic control for understanding leaf development (Dickmann,
1971; Larson & Isebrands, 1971; Larson et al., 1972; Isebrands & Larson, 1973;
Dickmann & Gordon, 1975; Dickson & Larson, 1981). It was also selected because it employs passive rather than active phloem loading, which makes
inferences about essential element transport more transparent (Zhang et al., 2014).
Clones of grey poplar were propagated in vitro from stem cuttings
rooted in Cornell mix growing medium (Boodley & Sheldrake, Jr., 1982) and grown in a growth chamber on 12 h/12 h day/night cycles under 300 µmol
photons/m2 and day/night temperatures of 28˚C/23˚C. Once the plants
reached ~ 25 cm in height (~3 weeks), they were transferred to a cold frame and grown under natural ambient conditions at Cornell University facilities
in Ithaca, NY,between June and July 2014. Plants were watered daily and
were supplemented weekly with a 15-15-15 complete nutrient solution. Leaves were harvested from saplings > 60 cm in height and having reached a leaf plastrochron index (LPI; Larson and Isebrands, 1971) of at least 20. Leaves spanning LPI 1 to 10 were selected to compare element distribution between early developing and fully mature leaves, and to capture the leaf phloem sink to source transition. Leaves were placed in a plant press for 3 days until fully dried. A set of these leaves, spanning LPI 1 to 7 and a fully mature leaf at LPI 10 collected from a single plant was
selected for µ-XRF analysis. A duplicate collection of leaves was freeze-dried for comparing sample preparation techniques. In this case, the harvested fresh leaves were snap frozen in dry ice and lyophilized for 5 days.
Anatomical details and transverse imaging of leaves were obtained
from free hand sections through fully mature, fresh leaves atLPI 10.
Transverse sections were observed under an Olympus BX60 microscope and photographed using a Sony Progressive 3CCD. Leaf area was calculated from high-resolution photographs taken using a Canon T2i camera and 60
mm macro lens (Canon, Japan), and images were processed with ImageJ software (Rasband, 2014).
Even though one of the advantages of µ-XRF is its ability to detect
trace elements in situ using fresh samples, using dehydrated samples
nevertheless increases the sensitivity for trace elements by increasing the signal to background ratio. We tried two leaf dehydration methods as a means to minimize water content in the sample and avoid possible noise caused by dehydration in long scans (>8 hours) of large leaves.
Lyophilization of early developing leaves yielded poor results possibly related to the collapse of undifferentiated cells. Elements in freeze-dried leaves appeared to form irregular streaks throughout the leaf lamina,
contrasting with oven-dried samples in which element distribution followed well-defined leaf veins. Because freeze-dried leaf tissues may have suffered damage, all of the following results are based on observations made from the oven-dried samples.
Elemental X-ray fluorescence
Dried leaves and transverse sections from fresh leaves were mounted between two layers of Kapton® polyimide film for elemental micro x-ray fluorescence (µ-XRF) spectroscopy at the Cornell High Energy Synchrotron Source (CHESS) facilities. Two beamlines were used upon availability. Whole leaves were scanned at the F3 bending-magnet beamline, equipped
with a double crystal Si(111) monochromator (∆E/E ~ 10-4) and a
were scanned at the G3 undulator beamline, which employs synthetic
W/B4C multilayer monochromaters (∆E/E ~ 10-2) for increased flux. A
different single-bounce monocapillary was used in this setup (s/n) which focused the beam to a spot size of 10 µm diameter. Fluorescence spectra
were obtained at 11.2 keV using a 384 element Maia detector (Kirkham et al.,
2010) placed perpendicular to the incident beam and situated at 2mm from the sample. Samples were scanned horizontally at 20 µm step intervals and fluorescence was captured for 1, 5 or 10 ms per step on whole leaf and transversal section samples, as needed. The captured XRF spectra were analyzed using the dynamic analysis (DA) method to obtain elemental maps using the software GeoPIXE v7.1 (Ryan, 2000). The incident flux was
calibrated using reference films of known mass. This flux, in turn, was used to calculate elemental mass from XRF peak areas using a
fundamental-parameters approach (Ryan et al., 2014).
Elemental abundance, a dimensionless number that provides a metric for quantifying the spatial distribution of each element in leaves differing in size and age, was calculated in the following way. The elemental masses for Zn, Ca, and K for each leaf were retrieved as ppm per scanned spot area. Estimated mass per scanned spot area was retrieved assuming that cellulose was the major organic component within each scanned area. This
assumption is consistent with prior stoichiometric measurements of intact eudicot leaves, which show that organic carbon is the most abundant element in leaves. The elemental abundance per surface area scanned was calculated by dividing ppm of each element per surface area by estimated dry mass per surface area. This procedure normalized the abundance of each
element with respect to the abundance of total dry mass. Changes in actual leaf dry mass as a function of leaf development were additionally
determined by weighing dried leaves.
It is important to note that, as in most eudicots leaves, poplar leaves manifest significant anatomical heterogeneity (resulting from differences in the volume fractions of air, cell walls, and cytoplasm). This heterogeneity in tandem with the fact that leaves were dehydrated precluded attempts to measure elemental concentrations in conventional units such as µM.
Results
Leaf elemental maps showed a distribution that varied both spatially across the leaf blade and temporally as gauged by elemental distributions from LPI 1 to LPI 10 (Figure 2.1). We focus here on Zn, Ca, and K
distributions because these elements manifested the most noticeable changes throughout leaf development (see Appendix for the elemental distributions of additional elements detected). The images shown in Figure 2.1 reveal the distributions and abundances of all three of these elements and the
ontogenetic changes in these variables of interest. The spatial distribution of each of the three elements during different stages of leaf development are discussed in detail below (and are shown in Figures 2–3 and Figure 2.5). The co-accumulation of two or more elements obscures the distribution of single elements. For example, the co-accumulation of K and Zn obscures the
accumulation of each of these elements particularly in the apices of lamina teeth and the basal regions of juvenile leaves (Figure 2.1A–B).
Figure 2.1. Composite µ-XRF maps of the abundance of K (red), Ca (green) and Zn (blue) (see color gradients at the bottom of the figure) in developing leaves of grey poplar at leaf plastochrons (LPI) 1 (CHESS scan cycle/run 2014–2/102), LPI 2 (CHESS 2014–2/107), LPI 3 (CHESS 2014–2/120), LPI 4 (CHESS 2014–2/110), LPI 5 (CHESS 2014–3/1530), LPI–6 (CHESS 2014–3/1534), and LPI 10 (CHESS 2014–2/494). Fluorescence intensities of elements were normalized using reference standards, and provide a direct comparison of element abundance across representative leaves for each of the plastochrons shown (see centered scale at bottom for each of the three elements). Maximum pixel brightness corresponds to maximum abundance for each element. Note basipetal accumulation of Ca as leaves mature as shown by green coloration in leaves LPI 05, LPI 06, and LPI 10. Insert A highlights areas characterized by high abundance of Ca and Zn in teeth apices in LPI 1. Insert B highlights areas characterized by high abundance of Ca and Zn at the base of LPI 2 (see arrows). Insert C highlights the absence of co-localized Ca and Zn in teeth apices LPI 10 (see arrows).
LPI 01 LPI 03 LPI 04 LPI 05 LPI 10 LPI 06 K Ca Zn LPI 02 2 cm
Zinc distributions in leaf development
Elemental maps indicated the preferential distribution of Zn
adjoining the leaf vasculature (Figure 2.2A–E). In early developing leaves, the highest Zn abundance was observed at the apices of leaf teeth (Figure 2.2B), in the bundle sheath surrounding the midvein and secondary veins (Figure 2.2A-B), and in the upper and lower epidermis. Similar distribution patterns were observed for leaves between LPI 1 and 4, but the accumulation of Zn decreased in teeth apices with increasing LPI (compare Figure 2.1A–B with Figure 2.1C). Fully mature leaves (at LPI 10) no longer exhibited high Zn abundance in teeth apices (Figure 2.2C), but showed a more pronounced Zn accumulation surrounding veins of higher order and, once again, in the upper and lower epidermis (Figure 2.2D–E). As leaves matured, Zn
continued to accumulate in these regions leaving a ghost-like image pattern in the midvein and higher order vascular strands owing to the greater abundance of Zn in these cells (Figure 2.2C–E). Because transverse sections made from fresh leaves and immediately mounted for analysis yielded the same patterns (albeit with lower spatial resolution), it was unlikely that Zn accumulation around the vasculature was due to element displacement toward the veins during whole leaf dehydration.
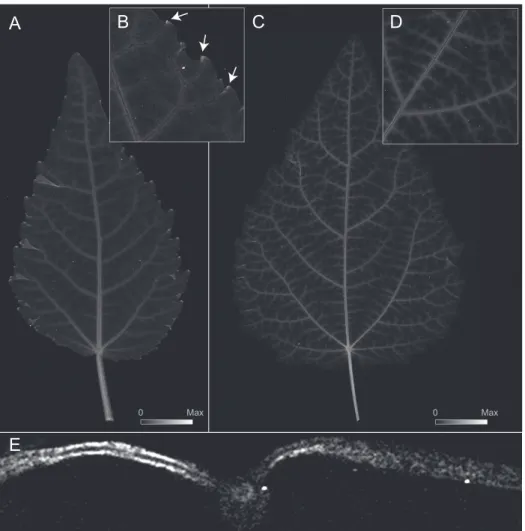
Figure 2.2. Elemental µ-XRF map for Zn abundance for developing leaves of gray poplar. Image intensity matches element abundance (see scales in A and C). A. Early developing leaf at LPI 3. Maximum Zn = 1615 µg Zn/g dry mass. B. Selected area from Figure 2.2A highlighting the localization of Zn at leaf teeth apices (see arrows). C. Fully mature leaf at LPI 10. Maximum Zn = 1305 µg Zn/g dry mass. D. Detail of Zn localization around major veins at LPI 7. E. Transversal section of a fully mature leaf at LPI 10 showing the accumulation of Zn in the upper and lower epidermis and in the peripheral vasculature of the midvein.
Calcium distributions in leaf development
Elemental maps indicated that Ca was highly concentrated in major veins as well as in teeth apices of early developing leaves (see arrows Figure
A B C D
E
Max
2.3A). Whereas the average abundance of Ca in major veins of the LPI 1 leaf was one-half that in teeth apices, the abundance of Ca within the leaf lamina was approximately one-half that of the midvein. The enhanced
accumulation of Ca in major veins is observed as peaks in Ca abundance along the leaf longitudinal transects shown in Figure 2.4.
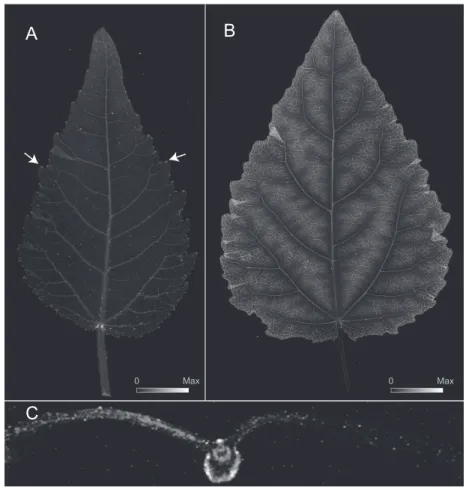
Figure 2.3. Elemental µ-XRF map for Ca for developing leaves of gray poplar. Image intensity matches element abundance (see scales in A and B). A. Early developing leaf at LPI 3, showing Ca localization teeth apices (see arrows) and major veins. Maximum Ca = 10625 µg Ca/g leaf dry mass. B. Fully mature leaf at LPI 10 showing the localization of Ca in higher order veins and in the mesophyll as seen from above (see C for a transverse section). Maximum Ca = 10670 µg Ca/g leaf dry mass C. Transversal section of fully mature leaf at LPI 10 showing Ca in mesophyll, the peripheral tissues in the midvein, and peripheral tissues of the midvein vascular strand.
A B
C
Max
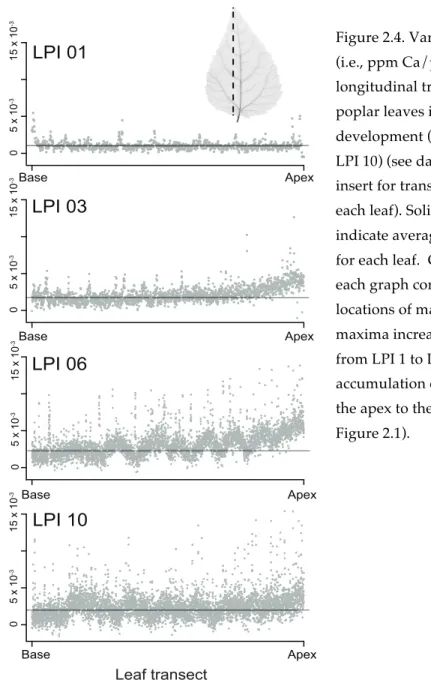
With increasing LPI, the marked difference in Ca abundance between teeth apices and leaf veins decreased, and the accumulation of Ca in the lamina became more noticeable (see Figure 2.3B; see also Figure 2.1). At LPI 3, the accumulation of Ca in the laminar tissues as well as in minor veins increased towards the apex (Figure 2.3A) as illustrated by the deflection in the longitudinal Ca abundance transect in Figure 2.4. Contrastingly, the abundance of Ca in leaf teeth apices decreased at LPI 3 (see Figure 2.1). By LPI 6, more than half of the leaf lamina shows increased amounts of Ca (Figure 2.4). The increasing frequency of peaks observed in the Ca abundance transect shown for LPI 6 in Figure 2.4 indicates an enhanced accumulation of Ca in corresponding minor veins towards the leaf apex. At this developmental stage, the abundance of Ca in leaf teeth no longer differed from that of surrounding tissues (see leaf at LPI 6 in Figure 2.1).
Figure 2.4. Variation in Ca abundance (i.e., ppm Ca/ppm dry mass) along longitudinal transects across gray poplar leaves in different stages of development (LPI 1, LPI 3, LPI 6, and LPI 10) (see dashed line in upper insert for transect orientation across each leaf). Solid lines in each graph indicate average leaf Ca abundance for each leaf. Ca abundance peaks in each graph correspond to the
locations of major veins; peak maxima increase as leaves mature from LPI 1 to LPI 10. Ca
accumulation occurs basipetally (from the apex to the leaf base) (see also Figure 2.1).
Fully mature leaves showed a different distribution pattern compared to that of early developing leaves (Figure 2.3B). Whereas Ca accumulation was noticeable only in major veins of early developing leaves, the Ca abundance in veins of third, fourth, and even fifth order in fully mature leaves averaged twice that in primary and secondary veins (Figure 2.3B).
0 5 x 10 -3 15 x 10 -3 LPI 01 LPI 03 LPI 06 LPI 10 Ca abundance Leaf transect Base Apex Base Apex Base Apex Base Apex 0 5 x 10 -3 15 x 10 -3 0 5 x 10 -3 15 x 10 -3 0 5 x 10 -3 15 x 10 -3
The difference in Ca abundance between the major veins and the lamina was not as marked. Specifically, Ca abundance in the lamina was ~20% lower than that in major veins, compared to a 50% difference observed in early developing leaves (see Figures 3A–B). The maximum Ca abundance for all non-vascular leaf tissues was highest between secondary veins and lowest in proximity to primary and secondary veins. A leaf cross-section that
included the primary veins indicated that Ca is localized in the bundle sheath and the external-most regions of the midvein (Figure 2.3C). Outside these regions, Ca was distributed within the mesophyll.
Potassium distributions in leaf development
The distribution of K in leaves was far more homogeneous than that observed in the elemental maps of Zn or Ca, and was largely invariant across leaf development (Figures 5A–C). K was more abundant in all vein orders than in the lamina, but its abundance decreased with increasing vein order (Figure 2.5A–B). This pattern was observed in both early developing and fully mature leaves (see Figure 2.5A–B). The difference in K abundance between the lamina and veins was most pronounced in fully mature leaves, and was 10 times lower in the lamina than in the larger veins. We compared
vein thickness to K abundancein veins and found that itdid not fully match
estimates of leaf thickness (compare Figures 5D-E). The internal distribution of K indicated that this element was much more prevalent in the epidermis, mesophyll, and tissues surrounding veins than in either the xylem or
phloem (Figure 2.5C).
Figure 2.5. Elemental µ-XRF map for K for developing leaves of gray poplar. Image intensity corresponds to element abundance (see scales in A and B). A. Early developing leaf at LPI 3. Maximum K = 57290 µg K/g leaf dry mass. B. Fully mature leaf at LPI 10. Maximum K = 55900 µg K/g leaf dry mass. C. Transverse section of fully mature leaf LPI 10 showing accumulation of K in the upper epidermis and mesophyll. D. Detail of K
accumulation in a developing leaf at LPI 4. E. Cellulose distribution as shown in D based on predicted leaf thickness (using µ-XRF data and assuming cellulose as the primary source of dry mass absorption). D.–E. The abundance of K in veins appears high because the veins are denser than lamina tissues.
Developmental changes A B D E C Max 0 0 Max
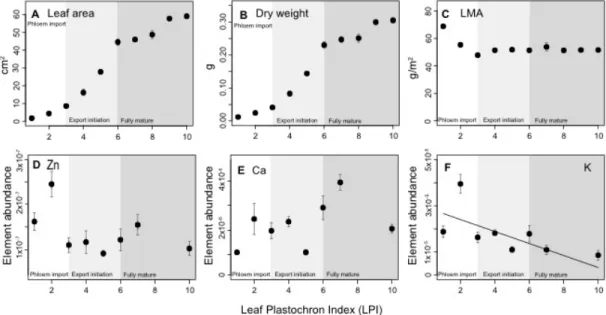
Poplar leaf growth conforms to a sigmoidal curve with an early exponential increase in leaf mass and area that plateaus once leaves reach plastochron 10. Leaf mass per area decreased in early development and reached a relatively constant value by plastochron 3 (Figures 6A–C).
Figure 2.6. Leaf growth parameters and changes in element abundance (i.e., ppm element/ppm dry mass) in relation to leaf development and the transition from phloem importing (a) to phloem exporting (c) (b denoted the LPI during the transition from phloem importing to exporting) (see notation at the bottom of each graph). A. Leaf area B. Leaf dry weight. C. Leaf mass per area (LMA). D. Zn abundance. E. Calcium abundance. F.
Potassium abundance (diagonal line denotes ordinary regression line for abundance vs. LPI).
The abundanceof elements followed different patterns throughout
leaf development. Whereas the total abundanceof Zn, Ca and K increased as
leaves expanded to full maturity, the relative abundanceof these elements
development, but not statistically significantly (Figure 2.6D). Ca abundance remained fairly constant throughout the leaf plastochrons examined in this
study (Figures 6E). In contrast, the average abundanceof K in leaves
decreased significantly with leaf growth (r2 = 0.40, P = 0.05) (see Figure 2.6F).
Discussion
Developing leaves undergo a number of structural and biochemical changes as they reach full maturity. Here, we document the preferential spatiotemporal distribution of Zn, Ca, and K throughout a developmental sequence at the whole organ level, and correlate the compartmentalization of Ca in leaves with phloem maturation. The conversion from sink to source marks a fundamental transition in leaf physiology that involves the
coordinated decline of respiration and leaf growth rates, and an increase of carbon fixation rates needed to create a positive carbon balance and reverse the direction of phloem flow (Dickmann, 1971; Turgeon, 2006). These
metabolic changes require the formation of functional stomata, substomatal chambers, and intercellular spaces that enable gas exchange, as well as the maturation of minor veins that mediate sugar export from the leaf (Turgeon, 1989, 2006), which also provides the driving force for transpiration
delivering water and solutes via the xylem.
Changes in leaf anatomy have been well characterized in species of poplar and have been linked to photosynthetic import and export capacities
using the leaf plastochron index system (Dickmann, 1971; Larson et al., 1972;
Ca, and K in grey poplar changes in a manner that is consistent with major metabolic and developmental transitions in leaf ontogeny.
Calcium in the leaf lamina
Poplar leaf development resembles that of many other eudicots in
that growth is both structural and expansive (Pantin et al., 2012). Before LPI
0, the basic anatomical organization of the leaf lamina is established and leaf growth is determined by cell division and structural growth. Cell expansion begins once the leaf reaches LPI 0, and cell separation is noticeable only in the spongy mesophyll by LPI 1. At LPI 3, intercellular spaces in connection to functional stomata are found only at the leaf tip and spatially coincide with enhanced photosynthetic rates and the onset of sugar export
(Dickmann, 1971; Isebrands and Larson, 1973). The development of
intercellular spaces and sugar export are coordinated spatially and proceed basipetally until leaf maturation is attained at LPI 6 (refer to Figure 2.6).
Calcium accumulation in minor veins at the leaf tip (see Figure 2.1) is spatially and temporally consistent with the onset and progression of sugar export from the leaf. The accumulation of Ca in minor veins corresponds to minor vein maturation and the enhancement of the transpiration stream required for the onset of photosynthate export. It has long been thought that Ca is exclusively transported through the transpiration stream as
transpiration rates are closely associated to leaf Ca content (Fricke et al.,
1995; Storey & Leigh, 2004; Kerton et al., 2009; Gilliham et al., 2011).
However, Ca is required for juvenile organ development and phloem is the primary transport tissue in juvenile organs, such as leaf primordia. As
intercellular spaces develop and become connected to functional stomata during leaf expansion, transpiration and carbon fixation rates increase locally and enhance Ca availability in areas of the leaf transitioning from sink to source. This process also reflects the functional maturation of xylem and phloem in minor veins, even though the formation of minor veins precedes the initiation of cell separation. The vascular strands that form and free-ending veins are continuously connected at the leaf apex by LPI 0 (Isebrands and Larson, 1973). However, the structural and functional development of sieve elements in minor veins is synchronized with sugar export, or briefly predates the initiation of sugar export (Fellows & Geiger, 1974).
Calcium is an essential plant macronutrient, a crucial regulator of plant growth, and is involved in key structural and signaling processes (Hirschi, 2004). In leaves, Ca moves apoplastically and accumulates with leaf age. Free Ca content however is tightly controlled intracellularly because it is involved in numerous signaling processes triggered by changes in its concentration at the nM scale (McAinsh & Pittman, 2008). Because Ca is not redistributed through the phloem (Karley & White, 2009) assimilation into the cell wall and sequestration into trichomes, idioblasts and cell vacoules
for long-term storage is essential for leaf function (Karley et al., 2000; Karley
& White, 2009). The distribution of Ca in mature poplar leaves reported here is consistent with other studies reporting the preferential accumulated of Ca in the mesophyll of eudicots leaves (Figure 2.3; (Storey & Leigh, 2004; Vogel-Mikušet al., 2008; Kerton et al., 2009; Conn et al., 2011; Gilliham et al., 2011).
accumulation of abundant calcium oxalate crystals, which are typically found in bundle sheath cells of poplar leaves.
Leaf teeth apices, and Ca and Zn in early development
Noticeable amounts of Ca and Zn are associated with the hydathodes in major vein terminations of early developing leaves (see Figures 1–3). As leaves grow, the high abundance of these elements decreases within
hydathodes and match those seen in major veins after LPI 4. This pattern is consistent with the increases in gas exchange and carbon fixation rates towards the margin of toothed leaves during early development (Baker-Brosh & Peet, 1997; Royer & Wilf, 2006). Specifically, highly transpiring leaf-margins will experience increased water flux through major veins during early development, which will result in the accumulation of elements. However, this expectation does not fully explain the abundance of elements specifically in hydathodes or the decrease in elemental abundances
attending leaf growth. An alternative scenario is that the accumulation of Ca and Zn is a byproduct of guttation and the exudation of water out of the leaf, which results in the accumulation of elements near the leaf margin. A third possibility may involve an active accumulation of elements in hydathodes that enhances the osmotic potential at secondary vein terminations. Active transport of solutes from the transpiration stream and into phloem
parenchyma and epithem cells of leaf teeth has been shown to occur in other
species of poplar (Vogelmann et al., 1985; Wilson et al., 1988), and is thought
to contribute to maintaining water flow velocities in xylem vessels (Wilson et
into hydathodes have yet to be described. Further work is required to resolve which among these possibilities, if any, is correct.
Potassium abundance and leaf age
Potassium is the second most abundant cation in the cytosol and is functionally related to a broad range of core cellular processes including pH maintenance, enzyme activation, cation/anion balance, and osmoregulation
(Hawkesford et al., 2011). Our data show that K is preferentially located in
the mesophyll of fully mature leaves, and that the average abundance of K decreases with leaf age (see Figure 2.6). Potassium is typically prevalent in high concentrations in dividing tissues, where it is closely involved in the synthesis of structural proteins and in regulating turgor-driven expansion
processes (Szczerba et al., 2009). Long distance movement of K occurs
through xylem and phloem. Since early developing tissues have overall low transpiration rates, it is likely that most of the K present in young leaves passes through the phloem and is distributed throughout the leaf
symplastically. As leaves grow and their sink capacity declines, import rates decrease, which can in part explain decreasing K abundances with leaf growth.
Most elements become more readily available in leaves as they mature and transpiration rates increase. Yet, most are typically remobilized in order to avoid hyper accumulation, in response to metabolic demands in sink tissues, and during organ senescence. Plants growing under K-deprived conditions typically exhibit relocation of K from old to developing tissues.
potential in phloem sap and is directly involved in sugar loading processes
(Komor, 2000; Lalonde et al., 2003). The expression of K+ channels in minor
vein phloem is controlled by photosynthate supply (Deeken et al., 2000) and
may be involved in increasing net export rates for K as leaves grow and contribute to the net decline in abundance observed in grey poplar.
Acknowledgements
This work is based upon research conducted at the Cornell High Energy Synchrotron Source (CHESS), which is supported by the National Science Foundation and the National Institutes of Health/National Institute of General Medical Sciences under NSF award DMR-1332208, using the Macromolecular Diffraction at CHESS (MacCHESS) facility, which is supported by award GM-103485 from the National Institute of General Medical Sciences, National Institutes of Health. We thank Dr. Leon Kochian (Cornell University) and two anonymous reviewers for valuable comments, and the Schlumberger Faculty for the Future Foundation for financial
CHAPTER III
THE SCALING OF THE HYDRAULIC ARCHITECTURE IN POPLAR LEAVES
Mónica R. Carvalho, Robert Turgeon, Tom Owens, Karl J. Niklas
Plant Biology Section,School of Integrative Plant Science, Cornell University,
Ithaca, NY 14853 (USA).
Published: New Phytologist 214 (1): 145–157, 2017
Summary
We report the hydraulic interconnectivity of the phloem and the xylem in
the mature leaves of the model tree species, Populus x canescens, by describing the
scaling relationships across all seven of the hierarchical orders of vasculature. Using a combination of electron and light microscopy, we found that (1) the conductive areas of phloem and xylem increase from minor veins toward the petiole; (2) the sum of all phloem (and xylem) conductive areas for each vein order exponentially increases from the petiole towards minor veins; (3) sieve tube (and vessel) member lengths match vein size, such that the volume of individual sieve tube (and vessel) members increases from minor veins toward the petiole; (4) phloem scaling is indicative of a system in which minor veins (5– 7) serve as photosynthate collectors whereas vein orders 1–3 serve as a rapid export system; (5) an isometric (one-to-one) scaling relationship exists between phloem and xylem conductive areas across all vein orders, and (6) the scaling of
phloem and xylem conductive areas is consistent with branching systems modeled according to da Vinci’s rule (i.e., the conservation of cross sectional areas). These data provide all the information required to mathematically model eudicot leaf hydraulics.
Key words: allometry; anatomy; form-function; leaf; morphology; Münch’s Pressure Flow hypothesis; phloem; scaling; xylem
Introduction
Plant vascular tissues provide for the resource allocation and the signaling processes required for survival and growth. In leaves, these tissues must ensure an effective distribution of water throughout the leaf lamina and an adequate collection-export system for sugar to avoid water deficits and an excessive accumulation of photosynthates. Xylem provides the water required to
compensate for water losses during CO2 uptake. Concurrently, this tissue must
supply the phloem with the water needed for maintaining the osmotic-regulated hydrostatic pressure gradient between source leaves and sinks, which is essential for sugar export (Münch, 1930; Turgeon & Ayre, 2005).
Despite the structural and physiological linkages between the phloem and the xylem, most of the literature dealing with leaf hydraulics focuses on the xylem; because, in addition to providing the lamina with mechanical support (Niklas, 1999), the physics of water flow through hollow conduits is well established. For example, xylem geometry (the radii and numbers of vessels) is
closely related to water transport efficiency (Roth-Nebelsick et al., 2001; Sack &
greater hydraulic conductivity in accordance with Hagen-Poiseuille flow (Sperry
et al., 2005; Sommerville et al., 2012), although they also increase the susceptibility
to embolism (Brodribb et al., 2016) due to the number of inter-conducting pit
membranes present in larger vessels (Hargrave et al., 1994; Wheeler et al., 2005;
Lens et al., 2011). Similarly, the length of veins per leaf area (VLA) is linked to
enhanced hydraulic conductance and broadly correlates with gas exchange rates
(Sack & Frole, 2006; Brodribb et al., 2007; Boyce et al., 2009; McKown et al., 2010).
It is also clear that the architecture of leaf venation networks is related to a large
number of other functionalities (Roth-Nebelsick et al., 2001). For example, the
topology of looped vascular networks as opposed to less interconnected systems confers redundancy in transport pathways and hence resilience to damage
(Wylie, 1951) as well as flexibility in coping with fluctuating loads (Katifori et al.,
2010; Corson et al., 2010). Such interconnectedness in turn provides an advantage
against herbivory (Haberlandt, 1914; Wagner, 1979) as well as higher hydraulic
conductance due to increased vascular connectivity (Roth-Nebelsick et al., 2001).
Although phloem and xylem are physically and developmentally linked in vascular bundles and many structural features that relate xylem to hydraulic performance should also apply to phloem, i.e., conduit dimensions (Russin & Evert, 1984), the form-function relationships affecting phloem flow are far less known compared to those of the xylem in part because phloem is a living tissue that operates under positive pressure. This feature makes direct flow
measurements inherently difficult (see however Knoblauch et al., 2016).
Observations must be made in vivo using non-destructive techniques and taking
1999; Knoblauch et al., 2016). Current methods used to quantify phloem
translocation rates include the injection of fluorescent dyes (Savage et al., 2013),
magnetic resonance imaging (Windt et al., 2006), and radioisotopes (Babst et al.,
2005). Among these techniques, only the first has been used to record flux rates in individual leaf vascular bundles.
As a consequence, much of what is currently known about phloem hydraulics is based on biophysical inferences. For example, assuming that Hagen-Poiseuille flow parameters hold true, phloem conductance should scale with the diameter and length of sieve tube members or sieve elements
(Thompson, 2006; Knoblauch & Oparka, 2012), although flow velocity
measurements do not necessarily match conductance estimates (Mullendore et
al., 2010). Adding to difficulties, recent evidence indicates that phloem anatomy
can change during plant growth to reduce axial resistance by increasing sieve
pore size (Knoblauch et al., 2016), yet highlighting a basic form-function coupling
in phloem structure. Moreover, sieve tube members also impose an upper boundary for sugar transport rates at loading sites. Because sugar loading and increased sugar concentration rapidly elevates phloem sap viscosity, high sugar
content in sieve tubes can reduce phloem translocation (Hölttä et al., 2009),
thereby down-regulating photosynthesis (Nikinmaa et al., 2013). Conversely, at
low sugar concentration, the osmotic potential in sieve tubes would be
insufficient to generate the hydrostatic pressure differential between sources and
sinks required for the bulk flow of phloem sap (Jensen et al., 2013). Therefore, it is
likely that the geometry of conduits follows the interplay between sugar concentration, viscosity, and hydrostatic pressure.