Evaluation of the NEFE
High School Financial Planning Program
®2003-04
Project Director:
Dr. Sharon M. Danes
Professor
University of Minnesota
Family Social Science Department
275f McNeal Hall
St Paul MN 55108
(612) 625-9273
[email protected]
Project Assistant:
Heather Haberman, MS
University of Minnesota
EVALUATION OF THE
NEFE HIGH SCHOOL FINANCIAL PLANNING PROGRAM® Executive Summary
An 18-month evaluation of the National Endowment for Financial Education® (NEFE®) High School Financial Planning Program® (HSFPP®) shows that students who completed the program reported significant improvement in their financial knowledge, behavior, and
confidence immediately after the course. The results are based on responses from 202 teachers and 5,329 high school students across the country. A smaller sampling of students three months later showed that the positive impact of the HSFPP continued and even increased in most
categories over time. Dr. Sharon M. Danes, Professor, University of Minnesota conducted the evaluation study.
The students were asked about eight financial behavior questions, four financial knowledge questions, and two questions about their confidence in managing their finances in the future. These same questions were asked at three points in time: before they studied the curriculum material, immediately after they completed the study of the HSFPP, and, again, three months after completion of the curriculum.
Immediately after studying the curriculum material, there was a statistically significant increase on all financial knowledge, behavior and confidence questions. At the end of their study of the HSFPP, about 60% of the students increased their knowledge about the cost of credit, about key questions related to auto insurance, and about investments. Beyond this increase in knowledge, their behavior patterns changed. About 40% of the students began to write goals for managing their money, to save money for their needs and wants, and to track their expenses. 41% of the students increased their confidence in making financial decisions.
Three months after completing the curriculum, the students had statistical increases on all questions since completing the study of the HSFPP curriculum except one. 59% of the students indicated they had changed their spending patterns and 60% indicated that they had changed their savings patterns. The primary ways the students changed spending habits were that they now only get things they really need and that they spend more wisely. Of those who reported having changed their saving habits, 80% indicated they now save for what they really need or want and 20% indicated that they now save every time they get money.
When queried about what was most useful in their study of the HSFPP, 26% of the students wrote, “All of it was useful.” When specific concepts were reported, 15% wrote, “How
important it is to save money.” 14% specified “How to use credit wisely.” was most important, and 10% wrote that “the idea of investing” was most important. The students not only increased their financial knowledge and behavior through studying the curriculum content, but they
maintained those changes over time by putting them into practice during the three months after completing the curriculum content. By doing so, they also increased their confidence to manage their finances in the future.
When teachers were asked to respond to six satisfaction questions about the HSFPP curriculum, the mean was greater than four on a five-point satisfaction scale for all six questions. When teachers were asked if they would recommend the HSFPP to a colleague, one responded “Yes” and when asked why she would do so, this comment was her response, “It is fabulous! They all enjoy learning about money! These students now have more knowledge about money then their parents! One of my students manages her entire mother’s checking account and household expenses!” (ID 2089)
In an average week, students reported saving approximately $28 while they indicated that they spent $31. 35% of the students said that they received an allowance averaging about $24 per week. 80% of the students indicated that they receive, on average, $17 from their parents on an “as needed” basis in an average week; the median amount was $10. Almost 44% of the students work a part-time job; about 23% work less than 10 hours per week, approximately 43% work 10-20 hours, another 25% work between 10-20-30 hours, another 8% work between 30-40 hrs. The average weekly take-home pay from their part time jobs was $119. 61% of the students receive money from odd jobs such as babysitting, lawn care, snow shoveling, cleaning house or pet care and the average amount they received from these odd jobs per week was a little over $35. 202 teachers obtained through a stratified random sampling procedure completed the teacher evaluation surveys. 5,329 of their students answered the same financial knowledge, behavior, and confidence questions both before studying the HSFPP and at the time of completing the HSFPP curriculum. A smaller sample of students responded to the same questions about their financial knowledge, behavior, and confidence three months later.
The National Endowment for Financial Education, a non-profit foundation dedicated to public financial education, sponsored the evaluation of the NEFE High School Financial Planning Program. The six-unit curriculum, which is designed to integrate with a variety of existing courses, is provided free of charge by NEFE to high schools all across the country. The HSFPP is a collaborative effort between the National Endowment for Financial Education, USDA’s (United States Department of Agriculture) Cooperative State Research, Education, and Extension Service (CSREES) – the federal partner of the Cooperative Extension System, and CUNA
Evaluation Project Description Description of the Curriculum Being Evaluated
This project evaluates one of the curriculums available to teach personal finance in high schools. The NEFE High School Financial Planning Program® (HSFPP) curriculum is a collaborative effort among the National Endowment for Financial Education® (NEFE), the Cooperative State Research, Education, and Extension Service, and CUNA (Credit Union National Association). It includes an extensive instructor’s manual and student guide that are provided free by NEFE. The program can be taught in as few as ten classroom hours or extended over a longer period of time. The curriculum can be presented in classrooms within several potential time frames such as over a two or three week period, over a four to six week period, or over a quarter or semester.
The NEFE HSFPP curriculum acquaints students with basic financial planning concepts and illustrates how these concepts apply to everyday life. The goal of the curriculum is to increase the financial planning literacy of teens. The curriculum is divided into six units each unit building upon each other. The topics of the six units include: (1) Financial Planning: Your Roadmap, (2) Career: Labor You Love, (3) Budget: Don’t Go Broke, (4) Savings and
Investments: Your Money at Work, (5) Credit: Buy Now, Pay Later, (6) Insurance: Your Protection. Each unit provides an overview of the section, a goal statement which identifies the main focus of the unit, and learning objectives which indicate the degree of mastery students are expected to demonstrate.
The purpose of this evaluation is to assess the impact on teens of studying the NEFE HSFPP Curriculum. It measures the financial knowledge, behavior, and confidence gained of a national, stratified random sample of teens that have studied the curriculum. It measures the changes in knowledge, behavior and confidence both after completing the course and three months following the completion of the course study. A secondary purpose is to describe the financial practices of the participating teens and to establish the experience of teachers using the curriculum. This evaluation is the second national evaluation of the HSFPP curriculum; the first one was completed in 1997.
How the Evaluation Was Conducted
There were three phases to this evaluation project. The Iowa State University Center for Survey Statistics and Methodology collected the data for all three phases of the project.
Phase One: A stratified random sample of teachers (1511) who had requested the HSFPP Curriculum from NEFE at the beginning of the 2003-04 school year were sent a one-page teacher participation survey. They were asked if they planned to use the curriculum between September 2003 and January 2004, and if they were willing to participate in a national evaluation of the curriculum. In that same one-page questionnaire, the teachers were asked about the size of their class and the approximate ending date for their use of the curriculum. This stage was deemed necessary to gain commitment to participation in the evaluation project and to determine which of the teachers would be using and completing the curriculum within the time frame of the evaluation study. Nine hundred ninety-nine (999) of the 1511 surveys were returned for a response rate of 66.6%; 30% of the schools indicated that they would be
completing the program outside the time window of the evaluation study. Two percent were ineligiblea for the study and another two percent of the teachers were not going to be teaching the curriculum this year. Thus, teacher and student evaluations were sent out to the remaining 483 schools (classrooms) in Phase Two.
Phase Two: The teacher and student surveys were to be completed at the end of the curriculum use within the classroom setting. The student questionnaires were bundled together with a teacher survey for the teacher to distribute and collect in class at the end of the curriculum study. The objective was to have the respondents receive the evaluation questionnaires as close to the end of this period as possible. In total, 483 teachers and 20,274 students were sent questionnaires in this phase of the study. In the end, 202 (42% return rate) of the teachers returned the evaluation questionnaires and 5,329 students answered the questions.
Phase Three: For the three-month follow-up phase of the study, student questionnaires and parental consent forms were sent to all those students who provided current, deliverable addresses on the evaluation forms at the completion of the curriculum study (2,041). Four follow-up mailings were sent to students to obtain as many returns as possible. 341 questionnaires (17%) were returned, although only 324 were usable due to the fact that 17 parental consent forms did not accompany the returned surveys. Analyses were done to
determine any differences between the students participating in the 3-month follow-up compared to those students who did not participate in the follow-up.
The students were asked the knowledge, confidence, and behavior questions in a way that is described as “post-then-pre” test method (Rockwell & Kohn, 1989) in an attempt to measure behavior change more accurately. This method (post-then-pre test method) has been found to be more reliable in measuring changes after studying specific content than the more traditional pre-test/post-test method (pre-test given before studying subject matter with a post-test given at the end of the presentation of the subject matter) (Howard & Dailey, 1979; Howard, Ralph,
Bulanick, Maxwell, Nance, & Gerber, 1979; Linn & Sinde, 1977). In the post-then-pre method, the students are first asked about what they learned from studying the curriculum content and after that questioning, they are then asked what their level of knowledge, confidence, or behavior was prior to studying the content of the curriculum. The primary reason for the increased
reliability of the answers is that students often do not know what they do or do not know before studying the material; asking them first about what they learned serves as a foundation to indicate what it is they actually did not know or do prior to studying the content.
What Students Were Asked
The students were asked core questions about their financial knowledge (4), financial management behaviors (8), and confidence about managing finances (2). The knowledge
questions and one of the confidence questions were asked on a 5-point Likert scale from strongly disagree (1) to strongly agree (5). The behavior questions and the second confidence question were asked on a 5-point Likert scale from almost never (1) to almost always (5).
More questions assessing the behavioral changes compared to knowledge changes were included because of the emphasis on impact in this evaluation. Behavioral changes indicate a
higher degree of internalizing of subject matter than knowledge changes (Fishbein & Ajzen, 1975; Danes, Huddleston-Casas, & Boyce, 1999); however, that fact does not lessen the importance of documenting changes in knowledge because improvement in knowledge is an earlier stage in the internalization of the information (Ajzen, 1975). Self-efficacy is another aspect that affects longer-term impacts in behavior change; self-efficacy is a feeling of being able to deal effectively with a situation (Bandura, 1977; Danes & Hira, 1990). Two aspects of that concept incorporated in this evaluation were beliefs and confidence because they increase the probability of long-term behavior changes. They do so because believing the way one manages one’s money can affect one’s future and feeling confident about making money decisions create motivation for continuing what has been learned (Ajzen, 1985; Danes & Rettig, 1993). In the remainder of this report self-efficacy is identified as confidence.
Students who begin their study of the HSFPP vary in their level of financial literacy; this variance is important to capture in the evaluation process. Documenting changes in knowledge, confidence, and behavior at two points in time (immediately after completing the study of the curriculum content and 3 months after) and comparing those changes to the baseline knowledge, confidence, and behavior of the students before studying the HSFPP captures the variance in financial literacy of the students as well as the impact of their study of the HSFPP curriculum.
Summary of the Impact Evaluation Findings Units of the Curriculum Taught by the Teachers
Of the six units in the curriculum, over ninety percent of the teachers taught the units on financial planning, budgeting, and credit (Table 1). Just under ninety percent of the teachers taught the units on careers and savings and investments and a little over eighty percent of the teachers taught the unit on insurance. More specifically, ninety-four percent of the teachers taught the financial planning unit. All but 3% of the teachers used the budgeting unit. About 90% of the teachers taught the career unit (89%) and the saving/investments unit (88%). Ninety-two percent of the teachers taught the credit unit. The lowest number of teachers taught the insurance unit (82%).
Table 1. Percent of Teachers Who Taught Each Unit Financial Planning: Your Roadmap 94
Career: Labor You Love 89
Budget: Don’t Go Broke 97
Savings and Investments: Your Money at Work
88
Credit: Buy Now, Pay Later 92
Insurance: Your Protection 82
Aggregate Changes in Student Knowledge, Behaviors and Confidence
Table 2 identifies the knowledge and confidence of the students prior to studying the HSFPP curriculum content. Before studying the HSFPP, the students indicated that they knew the least about auto insurance, investments, and the cost of credit (questions with mean-scores of
less than 3 in Table 2), and the most about the difference between needs and wants. Thirty-three percent of the students “strongly agreed” with the statement that they believed the way they managed their money would affect their future prior to studying the HSFPP curriculum. Table 2. Percent of Student Financial Knowledge and Beliefs Before Studying HSFPP
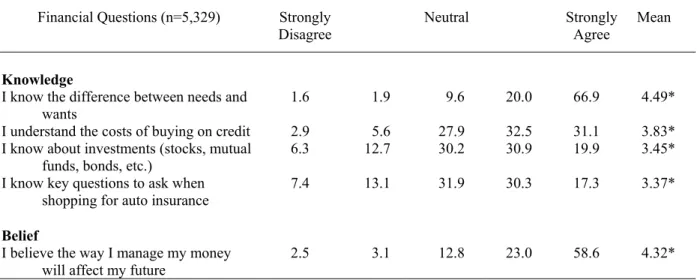
For all of the financial knowledge and confidence questions, there was a statistical increase indicated by the students after studying the HSFPP curriculum compared to their answers prior to their study of the HSFPP (Table 3). The increase in the percent of students answering “strongly agree” to the questions after studying the HSFPP curriculum compared to before is as follows: 25.2% for the difference between needs and wants, 18.9% for the cost of credit, 12.7% for investments, and 11.7% for auto insurance. Twenty-five percent more students provided the response of “strongly agree” regarding their belief that the way they managed their money would affect their future compared to those who answered that way prior to the study of the HSFPP.
Table 3. Percent of Student Financial Knowledge and Confidence After Studying the HSFPP
Financial Questions (n=5,329) Strongly Disagree
Neutral Strongly Agree
Mean
Knowledge
I know the difference between needs and
wants 1.6 1.9 9.6 20.0 66.9 4.49*
I understand the costs of buying on credit 2.9 5.6 27.9 32.5 31.1 3.83* I know about investments (stocks, mutual
funds, bonds, etc.) 6.3 12.7 30.2 30.9 19.9 3.45*
I know key questions to ask when
shopping for auto insurance 7.4 13.1 31.9 30.3 17.3 3.37*
Belief
I believe the way I manage my money
will affect my future 2.5 3.1 12.8 23.0 58.6 4.32*
*Indicates statistically higher mean after studying the HSFPP at p< .001.
Financial Questions (n=5,329) Strongly
Disagree Neutral Strongly Agree Mean
Knowledge
I knew the difference between needs and
wants 4.7 8.4 21.9 23.3 41.7 3.89
I knew the cost of buying on credit 15.8 24.1 33.1 14.8 12.2 2.83 I knew about investments (stocks, mutual
funds, bonds, etc.) 25.3 27.0 27.6 12.9 7.2 2.50
I knew key questions to ask when shopping for auto insurance
26.6 27.1 29.2 11.5 5.6 2.42
Confidence
I believed the way I managed my money
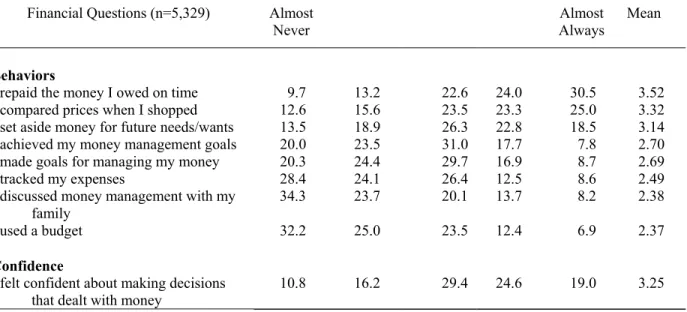
Tables 4 and 5 provide the answers of students regarding financial behaviors and confidence prior to and after studying the HSFPP curriculum content. Of the eight financial behaviors to which the students responded, the three behaviors that they did the least before studying the HSFPP curriculum (Table 4) were using a budget (mean=2.37), discussing money management with their family (mean=2.38), and tracking their expenses (mean=2.49). The two behaviors performed the most were repaying debts on time (mean=3.52), and comparing prices when shopping (mean=3.32). A fifth of the students indicated that they almost never made financial goals or achieved the goals they did set prior to studying the HSFPP. Twenty-eight percent almost never tracked their expenses prior to the study of the HSFPP. Although about a fifth of the students indicated they “almost always” felt confident about making decisions that dealt with money prior to studying the HSFPP, another, 27% of the students had very little to no confidence about making financial decisions prior to studying the HSFPP.
Table 4. Percent of Student Financial Behaviors and Confidence Before Studying HSFPP Financial Questions (n=5,329) Almost
Never Always Almost Mean
Behaviors
I repaid the money I owed on time 9.7 13.2 22.6 24.0 30.5 3.52 I compared prices when I shopped 12.6 15.6 23.5 23.3 25.0 3.32 I set aside money for future needs/wants 13.5 18.9 26.3 22.8 18.5 3.14 I achieved my money management goals 20.0 23.5 31.0 17.7 7.8 2.70 I made goals for managing my money 20.3 24.4 29.7 16.9 8.7 2.69
I tracked my expenses 28.4 24.1 26.4 12.5 8.6 2.49
I discussed money management with my
family 34.3 23.7 20.1 13.7 8.2 2.38
I used a budget 32.2 25.0 23.5 12.4 6.9 2.37
Confidence
I felt confident about making decisions
that dealt with money 10.8 16.2 29.4 24.6 19.0 3.25
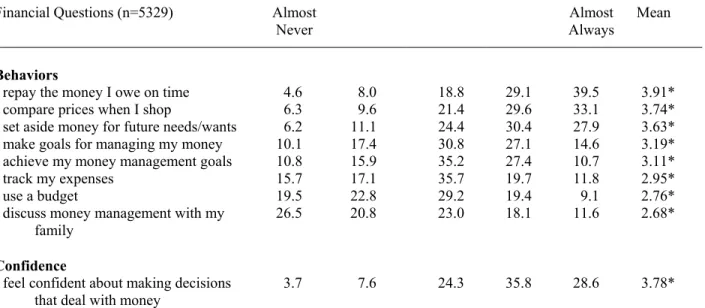
Table 5 indicates that there was a statistical increase in behavior for all eight types of financial behaviors when comparing before and after the study of the HSFPP curriculum. In fact, two behaviors increased in the ranking of how often they performed those behaviors after studying the HSFPP compared to before studying the curriculum content. Making financial goals and using a budget moved up in their rankings within the financial behaviors after studying the HSFPP curriculum content.
An increase of 9% of the students indicated they “almost always” repay the money they owe on time in comparing before and after studying the HSFPP. The increase was 8.1% for comparing prices when they shop and was a 9.4% increase for setting aside money for future needs/wants. The confidence level for making financial decisions also increased at a statistically significant level after studying the HSFPP curriculum. For those students responding only to the “almost always” category of the confidence question, 9.6% more students responded in that manner after studying the HSFPP curriculum compared to before studying it.
Table 5. Percent of Student Financial Behaviors and Confidence After Studying HSFPP Financial Questions (n=5329) Almost
Never Always Almost Mean
Behaviors
I repay the money I owe on time 4.6 8.0 18.8 29.1 39.5 3.91* I compare prices when I shop 6.3 9.6 21.4 29.6 33.1 3.74* I set aside money for future needs/wants 6.2 11.1 24.4 30.4 27.9 3.63* I make goals for managing my money 10.1 17.4 30.8 27.1 14.6 3.19* I achieve my money management goals 10.8 15.9 35.2 27.4 10.7 3.11*
I track my expenses 15.7 17.1 35.7 19.7 11.8 2.95*
I use a budget 19.5 22.8 29.2 19.4 9.1 2.76*
I discuss money management with my
family 26.5 20.8 23.0 18.1 11.6 2.68*
Confidence
I feel confident about making decisions
that deal with money 3.7 7.6 24.3 35.8 28.6 3.78*
*Indicates a statistically higher mean after completing the study of the HSFPP; p<.001. Individual Gains in Knowledge, Beliefs, Behavior, and Confidence
The previous tables provided the aggregate changes for all the students. Tables 6 and 7 are the report of individual student differences for each question indicating their unique gains resulting from the study of the HSFPP curriculum; these tables take into consideration where the students began and where they ended as a result of their study of the curriculum. Knowledge gains (Table 6) were obtained by approximately 60% of the students for the cost of credit, auto insurance, and investments. There was a forty percent gain in the case of the difference between needs and wants, which was the item that students indicated they knew the most about prior to studying the curriculum material. Over 40% of the students increased their belief that the way they manage their money will affect their future after studying the HSFPP.
Table 6. Percent Gain in Knowledge and Confidence Immediately After Completing the HSFPP
Financial Questions (n = 5329) Loss Maintai n
Gain Knowledge
I know the cost of buying on credit 4.7 34.4 60.9
I know key questions to ask when shopping for auto insurance 5.8 36.0 58.2 I know about investments (stocks, mutual funds, bonds, etc.) 5.8 36.0 58.2 I know the difference between needs and wants 4.8 54.8 40.4 Confidence
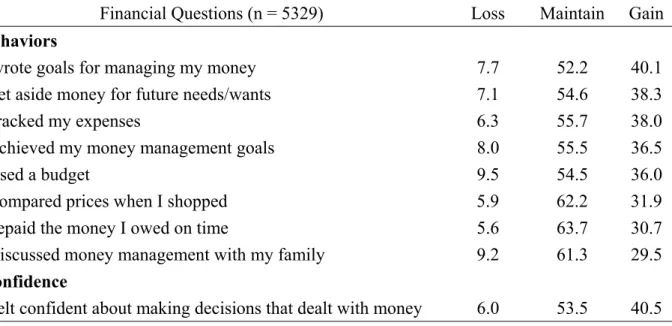
Changing behaviors is a sign of a deeper integration of the subject matter. For five of the eight behaviors, between 36 and 40% of the students increased their behavior after studying the HSFPP: writing goals for managing money, setting aside money for future needs/wants, tracking expenses, achieving their money management goals, and using a budget. For the remaining three behaviors, about 30% increased their behavior: comparing prices when they shop, repaying money they owe on time, and discussing money management with their family. Slightly over 40% felt more confident about making money decisions after studying the HSFPP curriculum compared to before studying it.
Table 7. Percent Gain in Behaviors and Confidence Immediately After Completing the HSFPP
Financial Questions (n = 5329) Loss Maintain Gain Behaviors
I wrote goals for managing my money 7.7 52.2 40.1
I set aside money for future needs/wants 7.1 54.6 38.3
I tracked my expenses 6.3 55.7 38.0
I achieved my money management goals 8.0 55.5 36.5
I used a budget 9.5 54.5 36.0
I compared prices when I shopped 5.9 62.2 31.9
I repaid the money I owed on time 5.6 63.7 30.7
I discussed money management with my family 9.2 61.3 29.5 Confidence
I felt confident about making decisions that dealt with money 6.0 53.5 40.5 Students Financial Description
Students were asked questions about how they save, invest, and spend their money. In an average week, students indicated that they saved approximately $28 while they indicated that they spend $31. Thirty-five percent of the students indicated that they receive an allowance averaging about $24 per week. Eighty percent of the students indicated that they receive, on average, $17 from their parents on an “as needed” basis in an average week; the median amount was $10.
Almost 44% of the students work a part time job; about 23% work less than 10 hours per week, approximately 43% work 10-20 hours, another 25% work between 20-30 hours, another 8% work between 30-40 hrs. The average weekly take-home pay from their part time jobs is $119. Sixty-one percent of the students indicated that they receive money from odd jobs such as babysitting, lawn care, snow shoveling, cleaning house or pet care and the average amount they receive from these odd jobs per week is a little over $35.
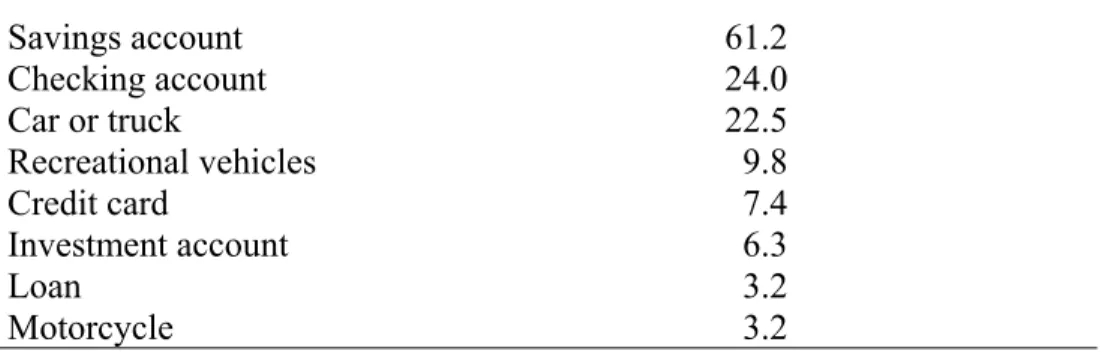
Table 8 shows the financial items that students indicated they own in their own names. Slightly over 61% of the students have a savings account in their own name, while 24% have
their own checking account. A small percent of the students (6.3%) have an investment account and 7.4% own a credit card in their own name. Just over 22% of the students own a car or truck in their own name, while 9.8% own recreational vehicles (such as an ATV, snowmobile, or ski-doo), and 3.2% own a motorcycle.
Table 8. Percent of Items owned by students in their own name
Savings account 61.2 Checking account 24.0 Car or truck 22.5 Recreational vehicles 9.8 Credit card 7.4 Investment account 6.3 Loan 3.2 Motorcycle 3.2 Twenty-five percent of the students indicated that they owed debts, and the average debt
for those students was $733. The students who indicated that they owned a car, truck, recreation vehicle, or motorcycle, of course, had much higher debt loads. They were selected out of the total group of students to determine their average debt load; those who owned a car or truck had a debt load of $1,440, those who owned a motorcycle had a debt load of $1,563, and those who owned a recreational vehicle (e.g. ATV, snowmobile, ski-doo) had the highest debt load with an average debt of $1,588.
When students were asked immediately after studying the curriculum how they planned to use the financial management skills in the next 6 months, 23% indicated that they would save their money. Additionally, another 31% indicated that they would save for a specific purpose such as a car, a trip, college, birth of a child, or auto insurance. About 32% mentioned some aspect of budgeting or credit, examples of what they said were:
• Getting and managing a credit card.
• Managing my money to get things I need rather than what I want. • Make sure I don’t spend all my money at college.
• Create a plan to track my expenses.
• Make wise decisions about what I really ant to purchase on credit.
Three percent of the students indicated that they would pay their debts and 6% indicated they would get a job.
Three-Month Student Follow-up
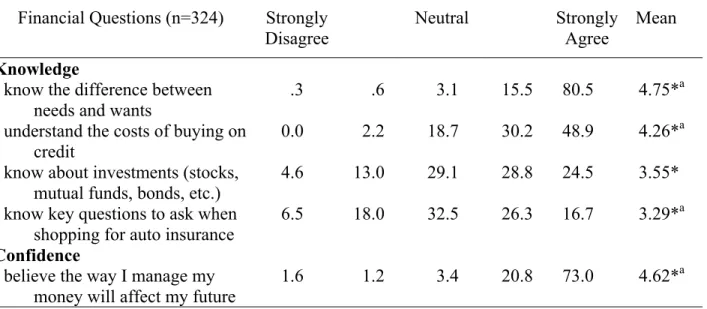
The students were asked similar knowledge, behavior, and confidence questions three months after they completed the HSFPP. These answers were compared to those asked before they started studying the curriculum content and after they completed the classroom study of the curriculum. Knowing the difference between needs and wants was the knowledge question with the highest mean three-months after studying the HSFPP curriculum, which was followed by the
question-believing the way they manage their money will affect their future (Table 9). About 80% of students “strongly agreed” that they knew the difference between needs and wants when queried three months after studying the HSFPP; 73% of students “strongly agreed” with the statement that the way they manage their money will affect their future.
Table 9. Percent of Financial Knowledge and Confidence Reported 3 Months After Studying the HSFPP
Financial Questions (n=324) Strongly Disagree
Neutral Strongly Agree
Mean Knowledge
I know the difference between needs and wants
.3 .6 3.1 15.5 80.5 4.75*a
I understand the costs of buying on credit
0.0 2.2 18.7 30.2 48.9 4.26*a
I know about investments (stocks,
mutual funds, bonds, etc.) 4.6 13.0 29.1 28.8 24.5 3.55* I know key questions to ask when
shopping for auto insurance
6.5 18.0 32.5 26.3 16.7 3.29*a Confidence
I believe the way I manage my money will affect my future
1.6 1.2 3.4 20.8 73.0 4.62*a
*Indicates a statistically significant higher mean before studying the HSFPP; p< .01. a Indicates a statistically significant higher mean after studying the HSFPP; p< .0001.
Knowing about key questions to ask when shopping for auto insurance was the
knowledge question with the lowest mean three months after studying the HSFPP. That finding is not surprising because only 22.5% of the students responding to the follow-up survey owned a vehicle and teens tend to pay attention to information only when it becomes relevant to them (Danes & Tahira, 1990).
There was a statistically significant increase between the responses of the students three months after studying the HSFPP compared to before studying the HSFPP and compared to their responses right after completing the HSFPP for all questions except knowing about investments. Student answers indicated that their knowledge regarding knowing about investments differed significantly from before studying the HSFPP to immediately after studying. However, there was not a significant difference between the 3-month follow-up and their responses immediately after studying the HSFPP.
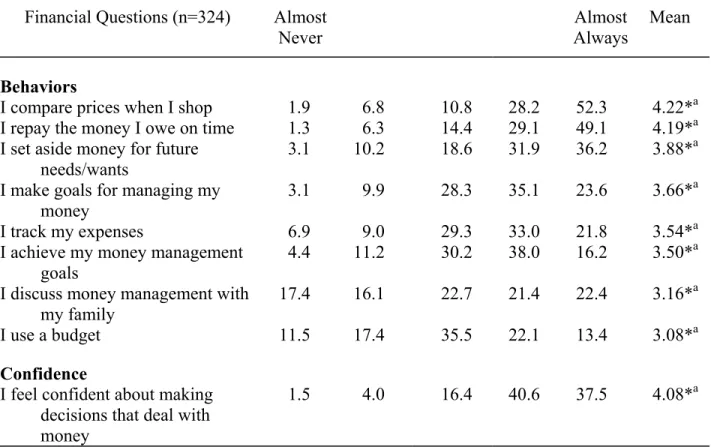
The questions in Table 10 are listed in order of highest mean to lowest mean within the behavior and confidence categories. The four questions with the highest means in order are: comparing prices when I shop, repaying the money I owe on time, setting aside money for future needs/wants, and making goals for managing my money. About 78% of students who responded to the 3-month follow-up reported a 4 or 5 on a scale of 1 to 5 in the level of confidence they feel in making decisions that deal with money.
Table 10. Percent of Financial Behaviors and Confidence Reported 3 Months After Studying the HSFPP
Financial Questions (n=324) Almost
Never Always Almost Mean
Behaviors
I compare prices when I shop 1.9 6.8 10.8 28.2 52.3 4.22*a I repay the money I owe on time 1.3 6.3 14.4 29.1 49.1 4.19*a I set aside money for future
needs/wants
3.1 10.2 18.6 31.9 36.2 3.88*a
I make goals for managing my
money 3.1 9.9 28.3 35.1 23.6 3.66*
a
I track my expenses 6.9 9.0 29.3 33.0 21.8 3.54*a
I achieve my money management goals
4.4 11.2 30.2 38.0 16.2 3.50*a
I discuss money management with my family
17.4 16.1 22.7 21.4 22.4 3.16*a
I use a budget 11.5 17.4 35.5 22.1 13.4 3.08*a
Confidence
I feel confident about making decisions that deal with money
1.5 4.0 16.4 40.6 37.5 4.08*a
*Indicates a statistically significant higher mean before studying the HSFPP; p< .01. a Indicates a statistically significant higher mean after studying the HSFPP; p< .0001.
For all questions, there was a statistical increase in the mean score between the responses 3-months after studying the HSFPP compared to before studying the HSFPP, but also between immediately after the classroom experience compared to 3 months later. This finding is
evidence to indicate that the students continued to gain from what they learned from the HSFPP curriculum content by translating what they learned into what they actually did.
The students were asked three unique question about their spending behavior in the 3-month follow-up survey: whether they make decisions on what they believe they can afford and whether they are willing to wait for something they want or need rather than charge it (Table 11). Before studying the HSFPP, about 25% indicated they almost always made decisions based on what they believed they could afford. Students were more willing to wait for something they wanted (22.9%-almost always) then something they needed (18%-almost always) rather then charge it.
Table 11. Percent of Financial Decisions About Spending Money Before Studying the HSFPP
Financial Decisions (n=324) Almost
Never Always Almost Mean Made decisions on what I believed I could
afford 5.6 9.6 29.6 30.2 25.0 3.60
Willing to wait for something I wanted rather than charge
12.4 17.6 24.1 22.9 22.9 3.26
Willing to wait for something I needed
rather than charge 13.3 14.9 32.5 21.4 18.0 3.16
Table 12 indicates that there was a statistical increase in the behaviors identified in the table related to the students’ spending patterns. Three months after studying the HSFPP, 46% of the students said they almost always made decisions on what they believed they could afford versus 25% before their study of the HSFPP content. About 57% of students indicated they were willing to almost always wait for something they wanted rather than charge it and approximately 31% said they were willing to wait for something they needed rather than charge it.
Table 12. Percent of Financial Decisions About Spending Money After Studying the HSFPP
Financial Decisions (n=324) Almost Never
Almost
Always
Mean Make decisions on what I believe I can
afford 0.6 1.2 11.7 40.4 46.0 4.30*
Willing to wait for something I want rather than charge
1.9 2.8 8.4 29.7 57.3 4.38*
Willing to wait for something I need rather than charge
6.2 7.7 25.7 29.7 30.7 3.71*
*Indicates a statistically significant mean after studying the HSFPP; p < .0001.
Teachers from the Advisory Board for the evaluation project had indicated while developing the questions for the survey that distinguishing between needs and wants is a vital part of the HSFPP. The questions in Tables 11 and 12 indicate that what students learned in the classroom study of the HSFPP had an effect three months later relative to the application of the concept of needs and wants.
Changes in Spending and Savings Patterns
Three months after studying the HSFPP, 59% of students reported they changed their spending patterns and 60% had changed their saving patterns. The primary ways the students indicated that they changed their spending habits was that they now only get things they really need and they spend more wisely. Of those who reported having changed their saving habits, 80% indicated they now save for what they really need or want and 20% indicated that they now save every time they get money.
Table 13. Percent of Students who Changed Spending and Saving Patterns 3 Months after Completion of HSFPP (N = 324)
Change in spendingpatterns 59%
Change in saving Patterns 60%
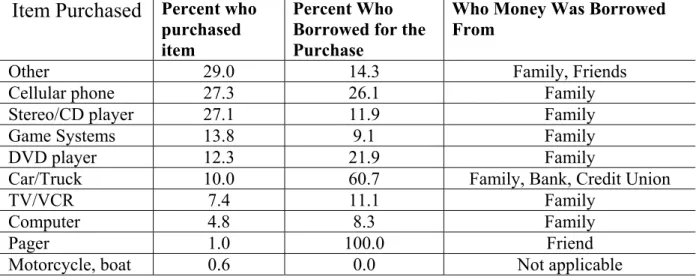
Description of Purchases and Borrowing Practices for those Purchases
The students were asked what they had purchased since studying the HSFPP, if they borrowed money for the purchase, and from whom they borrowed the money when they
completed the 3-month follow-up survey. Tables 14 and 15 outline the students’ answers. The two most prominent specific purchases were cell phones (27.3%) and stereos/CD players (27.1%) (Table 14). When the students purchased items, only small percentages borrowed money and that money was borrowed primarily from family, except for big-ticket items like vehicles where money was borrowed from banks and credit unions in addition to family
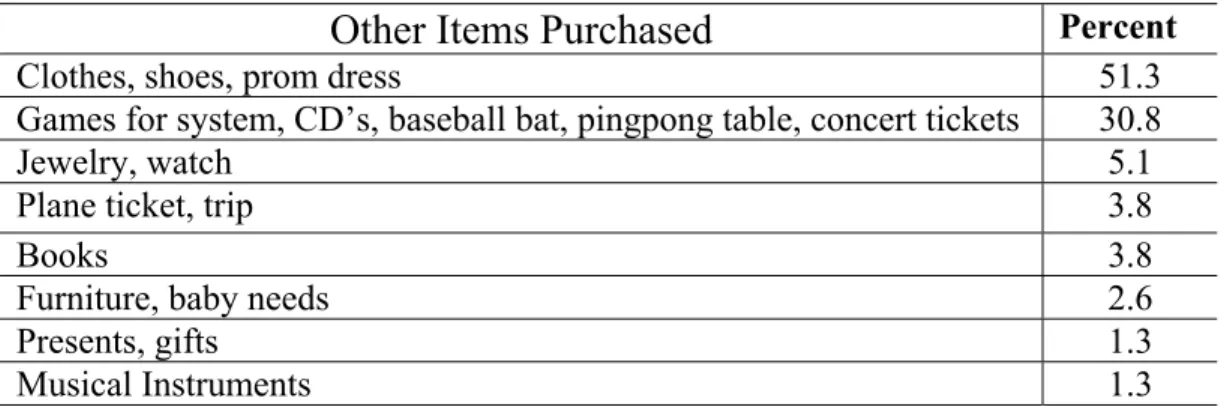
members. Table 15 outlines the types of purchases that were included in the “other” category of Table 14. Clothes and entertainment items were the primary things identified in this “Other” category. Clothes and shoes including the prom dress were the most prominent items identified in this “Other” category.
Table 14 Items Purchased After Studying the HSFPP
Item Purchased
Percent who purchased itemPercent Who Borrowed for the Purchase
Who Money Was Borrowed From
Other 29.0 14.3 Family, Friends
Cellular phone 27.3 26.1 Family
Stereo/CD player 27.1 11.9 Family
Game Systems 13.8 9.1 Family
DVD player 12.3 21.9 Family
Car/Truck 10.0 60.7 Family, Bank, Credit Union
TV/VCR 7.4 11.1 Family
Computer 4.8 8.3 Family
Pager 1.0 100.0 Friend
Table 15 Other Items Purchased During 3 Months Following Completion of HSFPP
Other Items Purchased
PercentClothes, shoes, prom dress 51.3
Games for system, CD’s, baseball bat, pingpong table, concert tickets 30.8
Jewelry, watch 5.1
Plane ticket, trip 3.8
Books 3.8
Furniture, baby needs 2.6
Presents, gifts 1.3
Musical Instruments 1.3
What Was Most Important to Students and What Did They Share With Others? When students were asked about the most important thing they have done with their money as a result of studying the HSFPP, three primary answers surfaced. The one mentioned by 46.5% of the students was that they opened a savings or checking account. The other two prominent answers were “saved for a specific item” (24.8%) and “being more careful about buying”(11.9%). When asked if they have shared concepts from their HSFPP study with family and/or friends, 68% of the students indicated they had. The three concepts shared most often were “needs versus wants” (19%), “investing and saving” (13%), and “pay yourself first” (11%). What Was Most and Least Useful to Students?
Twenty-six percent of the students wrote “All of it was useful.” when queried about what was most useful in their study of the HSFPP. When specific concepts were written, 15%
indicated “how important it is to save money”, 14% wrote that “how to use credit wisely” was most important, and 10% wrote that “the idea of investing” was most important. When the students were quizzed about what was least useful to them, the only concept that was identified by greater than 10% of the students was “needs versus wants” (11.7%).
Comparing Follow-up Students to Those Who Did Not Participate in the Follow-Up Analyses were conducted to discern whether the students who completed the follow-up survey were different from the students who did not. The one primary difference was the amount of money available to them. Those students who participated in the follow-up survey statistically differed from those who did not do the follow-up in that fewer received an allowance and fewer had a part-time job. Based on these differences, then, it makes sense that those students who participated in the follow-up spend less on average per week ($24 vs. $32) and saved less on average per week ($23 vs. $28). It would also follow that the students participating in the 3-month follow-up reported that they compared prices and made goals for managing their money more often than did the students not participating in the follow-up survey.
Teacher Evaluation Findings Teacher Satisfaction with the HSFPP Curriculum
Teachers were asked about their satisfaction with six aspects of the HSFPP curriculum. They were most satisfied with their confidence in teaching the content and relevance of the curriculum for students (Table 16). Three others questions closely followed those two aspects in satisfaction: quality of the content, ease of use, and relevance to state curriculum standards. Teacher’s satisfaction with the interest of the students in the content was the only item whose mean was less than four on a 5-point Likert scale from very satisfied (5) to very dissatisfied (1). Table 16. Teacher’s Satisfaction (in percents) with Aspects of the HSFPP Curriculum
Financial Questions (n=202) Very
Dissatisfied Mixed Very Satisfied Mean Your confidence in teaching the content 2.0 1.5 7.5 36.7 52.3 4.36 Relevance of the curriculum for your
students 2.5 1.0 11.4 29.4 55.7 4.35
Quality of content of the curriculum 3.0 1.5 8.5 37.2 49.8 4.29 Ease of use of the curriculum 3.0 0.5 9.5 39.5 47.5 4.28 Relevance of program to state curriculum
standards 3.1 2.1 8.6 36.5 49.7 4.28
Interest of the students in content 1.5 3.0 39.8 36.8 18.9 3.69 Teacher Evaluation of Student’s Knowledge and Abilities
Teachers were asked to assess the financial knowledge and abilities of their students prior to and after studying the HSFPP curriculum to determine their assessment of student changes. Before studying the HSFPP, teachers indicated that 40% of students had “poor” knowledge of the time value of money (Table 17), 37% had “poor” knowledge of credit, 24% had “poor” knowledge of car insurance, and 19% had “poor” knowledge about career/income relationship. Teachers ranked 40% of their students as “poor” in their abilities to set realistic goals prior to studying the HSFPP and 30% of the students as “poor” in their abilities to track expenses. Table 17. Teacher Evaluation of Student’s Knowledge and Abilities (in percents) before
Studying HSFPP
Financial Questions (n=202) Poor Average Excellent Mean
Knowledge
Understanding of career/income relationship
18.6 39.7 34.2 6.0 1.5 2.32 Knowledge about car insurance 23.7 41.4 27.8 6.6 0.5 2.19 Knowledge about consumer credit 37.2 46.2 15.1 1.5 0.0 1.81 Knowledge about the time value of
money
44.2 38.7 16.1 1.0 0.0 1.74
Abilities
Ability to do comparison shopping 13.6 36.2 39.2 9.5 1.5 2.49 Ability to track expenses 30.0 44.0 25.5 0.5 0.0 1.97 Setting realistic financial goals 40.2 40.2 19.1 0.5 0.0 1.80
There was a statistical increase in all four knowledge questions and the three ability questions in the teacher’s assessments of their student’s knowledge and abilities (Table 18). After studying the HSFPP curriculum, teachers indicated over a 20% increase in the number of students who they assessed had “excellent” knowledge of the career/income relationships and who have an “excellent” capacity to do comparison shopping. There was also a 17% increase in the students who were assessed by teachers to have excellent knowledge in credit, 15% for car insurance, and 14% for the time value of money. An increase of about 14% of students were considered by their teachers to have excellent command over tracking expenses and a 7% increase in students who now could set realistic goals after studying the HSFPP program. Car insurance knowledge increased enough so that it moved up in rank from third to second among the knowledge items compared to before studying the curriculum.
Table 18. Teacher Evaluation of Student’s Knowledge and Abilities (in percents) After Studying HSFPP
Financial Questions (n=202) Poor Average Excellent Mean Knowledge
Understanding of career/income
relationship 0.0 4.1 25.1 47.2 23.6 3.90*
Knowledge about consumer credit 0.0 3.1 33.3 46.7 16.9 3.77* Knowledge about car insurance 1.6 5.7 29.7 47.9 15.1 3.69* Knowledge about the time value of money 1.0 8.8 28.4 47.9 13.9 3.65* Abilities
Ability to do comparison shopping 0.0 4.1 29.9 45.4 20.6 3.82* Ability to track expenses 0.0 3.0 37.6 45.2 14.2 3.71* Setting realistic financial goals 0.0 5.6 42.1 45.2 7.1 3.54*
*Indicates a statistically significant higher mean after studying the HSFPP; p < .001. Future Use and Quotes by Teachers about the Use of the HSFPP
The teachers were asked in their evaluation if they planned to order additional student materials for use with a future class. They were also queried about if they would recommend the HSFPP to a colleague. Ninety-six percent said they would order student materials for a future class. A few more (97.5) indicated that they would recommend the HSFPP to a colleague.
Here are some quotes from teachers about the program:
It is fabulous! They all enjoy learning about money! These students now have more knowledge about money then their parents! One of my students manages her entire mother’s checking account and household expenses! (ID 2089)
The NEFE material prepared for teens is relevant to their current lives and situations. My students could really relate to the material, which supplied
the basic essentials and covers the topics in an easy to read format. The students wanted to keep their books which I’ve never experienced before. We loved it. The instructor activities were also very good. (ID 2314) The information covered in student books and activities give students a different perspective of the topics. Students start thinking about how important it is to plan for their future. They will start off from High School with a good base of knowledge to become successful completing their goals! (ID 2202)
Community Resources Used in Teaching the Units of the Curriculum
Thirty-four percent of the teachers utilized a community resource while teaching the financial planning unit (Table 19). Seventeen percent of the teachers utilized a community resource while teaching the budgeting unit. Only one-fifth of the teachers utilized a community resource for the career unit whereas 53% of the teachers utilized a community resource for the saving/investing unit. About a third (32%) utilized a community resource when teaching the unit on credit. For the insurance unit, 37% of those teachers utilized a community resource.
Thirty-four percent of the teachers utilized a banker to assist them in the classroom; this resource was the community resource used most frequently in the HSFPP program;. A close second to bankers as the most used type of community resource used to assist in teaching the HSFPP were insurance agents (27%). Nineteen percent of the teachers utilized a credit union contact and 17% utilized a stockbroker. Six percent of the teachers utilized an Extension Educator in the classroom to assist in teaching the HSFPP.
Table 19. Percent of Teachers Using a Community Resource to Assist in Teaching the HSFPP Units
Unit Community Resource Used
Financial Planning: Your Roadmap 34
Career: Labor You Love 20
Budget: Don’t Go Broke 17
Savings and Investments: Your Money at Work 53
Credit: Buy Now, Pay Later 32
Insurance: Your Protection 37
Strengths of HSFPP Curriculum as Identified by the Teachers
Table 20 identifies the ranking of teachers relative to the strengths of the HSFPP
curriculum. As identified by the teachers, the greatest strengths of the HSFPP are its availability at no charge (95%), and its flexibility in the time required to teach it (80%). About two thirds of the teachers identify its adaptability to a wide range of students (69%) and its comprehensive coverage of topics (65%) as strengths.
Table 20. Strengths of the HSFPP as Identified by the Teachers
Greatest Strength Percent
Available at no charge 95
Flexibility of time required 80
Adaptable to a wide range of students 69
Comprehensive coverage of topics 65
Adaptability to a wide range of students 48 Related to national curriculum standards 45 Experiential Instructor’s manual lessons 43
Appealing student guide design 39
Appealing student guide writing style 32
Approximately half of the teachers (48%) indicated its adoptability to a wide range of students as a strength of the curriculum. Forty-five percent of the teachers indicated that another strength of the HSFPP curriculum was its relationship to the national curriculum standards. Only forty-three percent of the teachers indicated the experiential instructor’s manual lesson as a strength. Less than forty percent indicated that the HSFPP had an appealing student guide design writing style (32%).
Description of the Students and Teachers Student Description
Almost all of the students who participated in the program were high school students (95%) with 59% being high school juniors and seniors. The sample was comprised of 48% males and 52% females. About 21% of the students originated from urban areas with population over 100,000, while 26% were from communities with populations between 25,000 and 100,000. Approximately 29% were from towns less than 25,000 population. Twenty-four percent (24%) lived in the rural area or on farms.
Teacher Description
Sixty-two percent of the teachers were repeat users of the curriculum with having used it for at least three classes. On average, these repeat users had taught the curriculum four times. Approximately 36% were family and consumer sciences teachers, 18% were business and
marketing teachers, 10% economics teachers, 11% personal finance teachers, 10% junior ROTC, and the remaining 15% were teachers from other subject areas.
Ninety-four percent of the teachers used the instructor’s manual and 97% used the student guides. Only 14% of the teachers used the NEFE Teen Resource Bureau and 7% used the web-based training course. Ninety-six percent of the teachers indicate that they plan to order additional student guides in the future. The average number of hours the teachers used to teach the HSFPP was 27 hours; the median number of hours was 20 which is the number where half of the sample is above that number and half is below.Thirty-one percent of the teachers indicated that they attended a training that showcased the NEFE HSFPP. Of those teachers who attended a
training session, 55% received that training through the Cooperative Extension Service. 10% received their training through a credit union.
a Ineligible cases consisted of agencies/organizations such as housing authorities, non-profit organizations, hospitals, detention centers, and others that would not be likely to involve high school level instruction in a classroom setting.
References
Ajzen, I. (1985). From intentions to actions: A theory of planned behavior. In Action Control:
From Cognition to Behavior, J. Kuhl & J. Beckman (Eds.) (pp. 11-39), Springer-Verlag;
New York.
Bandura, A. (1977). Self-efficacy: Toward a unifying theory of behavioral change.
Psychological Review, 84, 191-215.
Danes, S.M., Huddleston-Casas, C., & Boyce, L. (1999). Financial planning curriculum for teens: Impact evalutaion. Financial Counseling and Planning, 10 (1), 25-37.
Danes, S.M., & Rettig, K.D. (1993). The role of perception in the intention to change the family financial situation. Journal of Family and Economic Issues, 14(4), 365-389.
Danes, S.M., & Hira, T.K. (1990). Knowledge, attitudes, and practices in the use of credit cards. Home Economics Research Journal, 18(3), 223-235.
Fishbein, M., & Ajzen, I. (1975). Belief, attitude, intention and behavior: An introduction to
theory and research. Addison-Wesley: Reading, MA.
Howard, G.S., & Dailey, P.R. (1979). Response-shift bias: A source of contamination of self-report measures. Journal of Applied Psychology, 64 (2), 144-150.
Howard, G.S., Ralph, K.M., Bulanick, N.A., Maxwell, S.E., Nance, D.W., & Gerber, S.K.
(1979). Internal invalidity in pretest-posttest self-report evaluations and a re-evaluation of retrospective pretests. Applied Psychological Measurement, 3 (1), 1-23.
Linn, R.L., & Slinde, J.A. (1977). The determination of the significance of change between pre-and posttesting periods. Review of Educational Research, 47 (1), 121-150
NOTE:
The project director would like to thank the Evaluation Advisory Board for their input into the both the development of the survey questions and review of the report of the project. Members of the advisory board and the organizations they represent were: Elizabeth Schiever and Rebecca Nackos from the National Endowment for Financial Education, Donna Rice from Army ROTC, Mark Quintana from Boward County Public Schools, Steven Markbreiter from the National Academy Foundation, Philip Heckman from CUNA, Kelly Hatler and Susan Young from CP Federal Credit Union, Erica Tobe from Michigan State University Extension, and Sara Croymans, University of Extension Regional Extension Educator.