Diplomarbeit
A Novel Compression Approach for Mapped
High-Throughput Sequencing Data Sets
Verfasser
Niko Popitsch
angestrebter akademischer Grad
Magister der Naturwissenschaften (Mag.rer.nat.)
Wien, im September 2012
Studienkennzahl lt. Studienblatt: A 490
Studienrichtung lt. Studienblatt: Molekulare Biologie
Abstract
A major challenge of current high-throughput sequencing (HTS) experiments is not only the generation of the sequencing data itself but also their processing, storage and transmission. The enormous size of these data motivates the development of data compression algorithms usable for the implementation of the various storage policies that are applied to the produced intermediate and final result files.
This thesis gives a brief introduction into the field of high-throughput nucleic acid sequencing and into current approaches for the compression of the data resulting from such experiments. In the main part of
the thesis, NGC, a tool for the compression of mapped readdata stored in the SAM format (one kind of
HTS data), is presented. NGC enables lossless and lossy compression and introduces two novel ideas: First, it contains a way to reduce the number of required code words by exploiting common features of the
se-quencedreadsmapped to the same genomic positions; second, it contains a highly configurable way for the
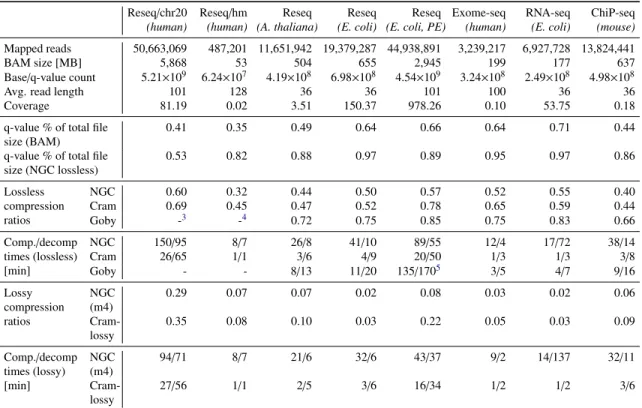
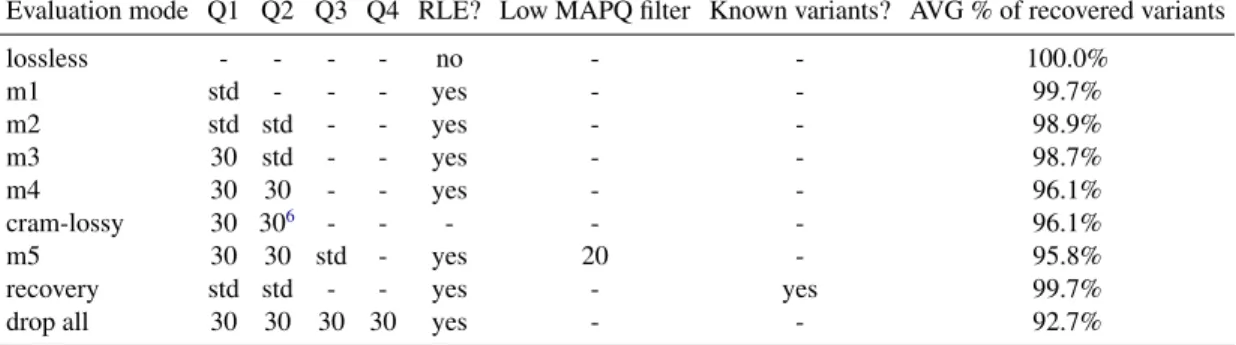
quantization of per-base quality values which takes their influence on downstream analyses into account. NGC, evaluated with several real-world data sets, saves 33-66% of disc space using lossless and up to 98% disc space using lossy compression. By applying two popular variant and genotype prediction tools to the decompressed data, we show that the lossy compression modes preserve over 99% of all called variants while outperforming comparable methods in some configurations.
Zusammenfassung
Eine der größten aktuellen Herausforderungen im Zusammenhang mit Hochdurchsatz-Sequenzierungsexpe-rimenten (High-Throughput Sequencing, HTS) liegt nicht im Erzeugen der Daten selbst, sondern in deren Prozessierung, Speicherung und Übertragung. Die enorme Größe dieser Daten motiviert die Entwicklung von Datenkompressionsalgorithmen für die Realisierung der verschiedenen Datenspeicherkonzepte die auf die produzierten (Zwischen-)Ergebnisse von HTS Experimenten angewandt werden.
Die vorliegende Arbeit gibt einen Überblick über das Feld der Hochdurchsatz-Nukleinsäure-Sequenz-ierung und in aktuelle Ansätze für die Kompression solcher Daten. Im Hauptteil der Arbeit wird NGC
vorgestellt, ein Werkzeug für die Kompression von gemapptenreadsdie im weitverbreiteten SAM Format
gespeichert sind (eine Art von HTS Daten). NGC ermöglicht sowohl verlustfreie als auch verlustbehaftete Kompression und beinhaltet zwei neuartige Ideen: Erstens enthält es eine Methode zur Reduktion der
er-forderlichen Code-Wörter, welche gemeinsame Merkmale derreadsdie an dieselbe genomische Position
gemappt wurden ausnützt. Zweitens beinhaltet NGC eine konfigurierbare Methode für die Quantisierung der Qualitätswerte welche deren Einfluss auf nach-gelagerte Anwendungen berücksichtigt.
NGC, mit mehreren echten Datensätzen evaluiert, spart 33-66% des benötigten Speicherplatzes bei ver-lustfreier und bis zu 98% des benötigten Speicherplatzes bei verlustbehafteter Kompression ein. Durch die Anwendung zweier gängiger Varianten- und Genotyp-Vorhersagewerkzeuge auf die dekomprimierten Daten wird gezeigt, dass die verlustbehaftete Kompression, besser als vergleichbare Werkzeuge in manchen Kon-figurationen, über 99% der gefundenen Varianten präserviert.
Table of Contents
1 Introduction 1
2 Nucleic Acid Sequencing 3
2.1 Nucleic Acid Preparations . . . 3
2.2 Sanger Sequencing . . . 6
2.3 High-throughput Sequencing . . . 8
2.4 Error Sources in Current Sequencing Methods . . . 13
2.5 Summary . . . 15
3 High-throughput Sequencing Data 17 3.1 Representation of Raw Reads: FASTQ . . . 17
3.2 Mapping and Alignment . . . 17
3.3 Representation of Mapped Reads: SAM/BAM . . . 18
3.4 Compression of HTS Data . . . 19
4 NGC: Lossless and Lossy Compression of Aligned High-throughput Sequencing Data 21 4.1 Introduction . . . 21
4.2 Materials and Methods . . . 22
4.3 Results . . . 29 4.4 Discussion . . . 33 5 Conclusions 35 5.1 Future Work . . . 35
I
Addenda
37
A Supplementary Data 39 A.1 Supplementary Description of Variant Calling Pipelines . . . 39A.2 Computing Environment . . . 39
A.3 GATK Pipeline . . . 40
A.4 SAMTOOLS Pipeline . . . 40
A.5 Definitions . . . 41
A.6 Counting Horizontal and Vertical Run-lengths . . . 41
A.7 Compression Parameters . . . 42
A.8 Supplementary Data Tables . . . 42
Bibliography 49
Chapter 1
Introduction
High-throughput sequencing (HTS) refers to a set of novel technologies that enable the accurate, fast and
affordable sequencing of long stretches of nucleic acids (DNA, RNA). The last decade brought an amazing
boom of these technologies which changed the biology research landscape considerably. Even small biology laboratories can today (and increasingly in the near future) resort to such sequencing data which adds genome scientific approaches, such as RNA-sequencing (RNA-seq) or whole genome sequencing (WGS) to the set of standard laboratory methods. By this, much expensive (in terms of time and money) work in the wet-lab can be saved or planned more accurately and it is expected that many future life science advances will be founded
in the availability of accurate sequencing data [Col10,HHR10,KK10,LMD+12].
The ongoing advent of HTS technologies will lead to a several-fold increase of the produced sequencing data in the near future. The enormous size of the produced data, however, introduces new challenges. Today, a major challenge of HTS experiments is not only the generation of the sequencing data itself but also their
processing, storage and transmission [Kah11,WRB+12,LBB12]. Many sequencing data sets have to be
stored for a long time (e.g., experimental data for reasons of scientific reproducibility, medical records for legal reasons, etc.). Further, such data sets have to be transferred over networks (e.g., for reasons of data exchange, in cloud computing environments, etc.) which introduces additional costs and project delays due to networking bandwidth limits. This consequently motivates the development of data compression algorithms usable for the implementation of the various storage policies that are applied to the produced intermediate and final result files.
This thesis is concerned with the compression of one important type of such data files: mapped read data. Current HTS technologies produce files containing millions of short (100-400bp) reads. An early step of most HTS data analysis pipelines is to map these reads against a reference genome. Such mapped read files, often several Gigabytes in size, are then usually subject to various filtering and analysis steps that produce many intermediate and final result files that need to be analyzed, transferred and archived. The main part
(Chapter4) of this thesis presents a novel approach for the lossless and lossy compression of such mapped
read data.
This thesis is organized as follows: In Chapter2we give a brief introduction in the field of nucleic acid
sequencing in general and into current high-throughput methods in particular. Chapter3describes prevalent
data formats for the representation of HTS data and highlights current trends in the compression of these.
Chapter4presents NGC, a tool for the lossless and lossy compression of mapped read data and AppendixA
contains associated supplementary data. Finally, Chapter5concludes with an outlook on the development of
HTS technologies and possible future work.
Chapter 2
Nucleic Acid Sequencing
Nucleic acid sequences (e.g., RNA, DNA) are unbranched polymers of nucleotides joined together by phos-phodiester linkages. They are considered as the primary carriers of genetic information and play central roles in all living organisms. The primary structure of nucleic acid sequences can be represented by a string of
base characters (A,C,T/U,G) derived by reading the sequence in 5’ to 3’ direction [AJL+02].
The determination of the digital representation of nucleic acid sequences is valuable for numerous theo-retical and applied fields of biology. A generalized pathway for their determination with today’s HTS
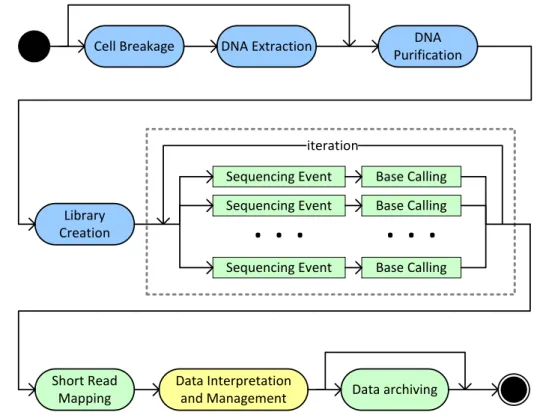
tech-nologies is depicted in Figure2.1. After some general preparations, so-called sequencing libraries are created.
These are then sequenced in a massively parallel, iterative fashion as described in Section2.3. Sequencing
re-sults in large numbers of short sequence fragments (“reads”) that are assembled by special software. Finally, researchers can analyze, annotate, exchange and archive the resulting sequence data sets. In the following, we exemplary describe the main steps of DNA extraction from cells that were subject to some biological
experiment (cf. [DD87,MDP88,LZL+91,SR01]).
2.1
Nucleic Acid Preparations
Before DNA can be sequenced, it has to be extracted and purified. DNA extraction from tissues, cells or cell compartments are standard laboratory routines and researchers may resort to a large number of protocols for this purpose. Here, we exemplary describe the main steps of DNA extraction from cells that were subject to some biological experiment.
Cell breakage and extraction. First, cells and tissues have to be disrupted in a controlled fashion to expose the contained DNA. Methods for cell breakage include mechanical (e.g., sonication, bead milling, mechanical
homogenization, etc.) and/or enzymatic methods (e.g., lysozyme or zymolyase digestion).
Next, the DNA has to be separated as good as possible from bound proteins, salts and cell debris as these would interfere with the sequencing reactions. Bound proteins may be degraded using protease or pepti-dase enzymes, subsequent protein precipitation can be done for example by salting out with ammonium or sodium acetate. DNA is then usually separated from this mixture by phenol-chloroform extraction: the cell
debris/DNA solution is mixed with a water-saturated 1:1 mixture of phenol and chloroform. After
centrifuga-tion, the DNA can be found in the interphase between the lower organic (chloroform) phase and the aqueous phase. The DNA is then precipitated from the solution using ice-cold ethanol or isopropanol as it is insoluble in these alcohols. The alcohol further removes the salts added in the protein precipitation stage.
Cell Breakage DNA Extraction DNA Purification
Library Creation
Sequencing Event Base Calling
Short Read Mapping Data Interpretation and Management Sequencing Event Sequencing Event
. . .
Base Calling Base Calling. . .
iteration Data archivingFigure 2.1: Generalized pathway of nucleic acid sequencing experiments. Blue activities take place in the wet-lab, green ones on special-purpose hardware (e.g., sequencing machinery, GPUs, Hardware RAIDs). Data interpretation and management needs, in many cases, to take place on regular lab PCs. The boxed center region of the figure shows the massively parallel sequencing steps of todays high-throughput sequencing technologies.
Purification. DNA samples for HTS sequencing have to be very pure to avoid background noise in the sequencing reactions. Therefore, samples are usually purified (sometimes also in intermediate steps of the above-mentioned extraction procedure) using column or gel purification or membrane filtration before se-quencing libraries are created. PCR products are usually prepared for DNA sese-quencing by ultrafiltration or by cutting the product out of an electrophoresis gel in order to get rid of the PCR by-products (primers, nu-cleotides, etc.). The required amounts of purified DNA depend on the sequencing method and the length of
the fragment of interest. Usual ranges are between severalngup to a fewµg.
2.1.1
Sequencing Library Creation
Purified DNA is a precondition for the creation of so-calledsequencing libraries. In general, these preparation
steps include DNA fragmentation and end-modifications (e.g., creation of blunt or overhanging fragment ends). Usually, the DNA fragments are ligated to some platform-specific adapter sequences that are in turn required for DNA immobilization. The exact protocols for library creation are available from the respective vendor Web-sites and are not reproduced here. All current technologies are, however, based on the principle of “shotgun sequencing” which requires respective library preparation steps.
2.1. Nucleic Acid Preparations 5
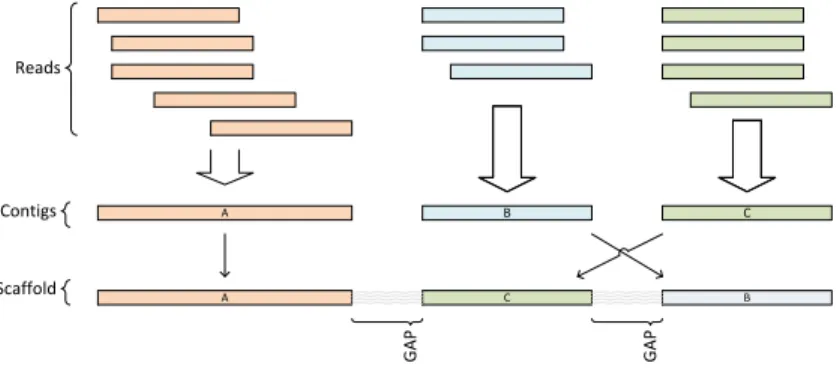
Shotgun sequencing. In general terms, the idea of shotgun sequencing is to (i) break the sample DNA into random fragments, (ii) amplify and sequence these fragments and (iii) concatenate and merge them based on overlapping sequence regions. By this, the original DNA sequence can be assembled from a large number
of short sequence fragments. These fragments are calledreadsand overlapping reads are assembled into
so-called sequencecontigs(contiguous regions). Adjacent contigs are then concatenated into so-calledscaffolds
(akasupercontigs), see Figure2.2[GWL+05].
A Reads Contigs B C A C B Scaffold GAP GAP
Figure 2.2: Overlapping reads are merged to contigs. Gaps between contigs can be bridged by paired-end
reads from different contigs to determine the contig sequence on a scaffold. The figure is a modified reprint
from [GWL+05], p. 396.
Modern sequencing technologies use the same principle for the reconstruction of DNA sequences: First, the DNA is split up randomly into smaller subsequences that act as templates for the sequencing process. Historically, this was done by treating the DNA either with restriction enzymes or by using physical methods
(e.g., sonication or shearing). Today, enzymatic methods, such asin vitrotransposition, are emerging. Here, a
transposase enzyme catalyzes the fragmentation (and at the same time also the insertion of adaptor sequences) of the DNA template in a single step while older methods require many steps (such as end-modifications,
A-tailing and adaptor ligation) to achieve the same results [CGS09,AMA+10].
In the original shotgun approach, these DNA fragments are then cloned into an expression vector (e.g., a high-copy-number plasmid) and these vectors are transferred into some host cells (viruses, bacteria). There, they are copied (cloned) by making use of the cell’s replication machinery which results in a large number of short DNA fragments that are subsequently sequenced. Modern sequencing technologies are, however, usually based on PCR amplification and clones are thus created by selecting appropriate primer sequences. The templates are then “read” (sequenced) by the used sequencing technology which results in a (usually
very large) number of shortreads.
Sequence assembly. Finally, the actual DNA sequence is reconstructed from these reads using special
sequence assembly software. There are two different ways to do this: mapping andde-novoassembly.
Mapping means that the reads are mapped against some known reference sequence. This mapping pro-cess aims at finding the position in the reference sequence where a read fits “best”, which does not mean that there has to be a 100% accordance. The original sequence can then be determined by considering the (overlapping) mapped reads. Such a reconstructed sequence may then, for example, be compared with the
reference sequence which reveals genetic differences between them, e.g., single nucleotide polymorphisms
(SNPs) or larger structural variations (SVs).
When no reference sequence is available, however, reads have to be assembled in the way described
above for shotgun sequencing: de-novoassembly software first exploits overlaps of the read sequences to
exploiting knowledge about the distance of paired ends (mate pairs). Multiple such assemblies may then, for example, be used to build a reference sequence for a certain species.
Paired ends. Paired ends refer to the two ends of one DNA fragment. They are separated by usually short (100-500bp) sequences of unknown DNA. Using sequence information from both ends of a DNA fragment of which the length is known greatly helps to reason upon structural rearrangements like insertions or deletions between these reads or to map them across repetitive regions. For example, when two paired ends are known to be separated by 500bp of DNA, but are mapped to positions that are 1000bp apart, it is likely that an insertion took place between them. Paired end information is usually an output of sequencer technology, i.e.,
this information is available in the resulting raw data sets. Mate pairsare paired ends that are separated by
longer DNA sequences (due to different creation methods). As they “cover” longer distances when compared
with paired reads, they may help in detecting more structural rearrangements (cf. [SPR+05]).
Coverage. One important parameter of sequence assembly iscoverage. The coverage of a particular nu-cleotide of the reconstructed sequence is the average number of reads that were actually mapped to overlap with this nucleotide’s position. The coverage of an assembly can thus be calculated with the simple formula
cov = n× gl wherenis the number of reads,l is the average length of these reads andg is the length of
the reference sequence. Obviously, high coverage is desirable as it may be used to compensate for errors in individual read sequences. Modern sequencing approaches allow high coverages which, however, comes at the cost of larger data sets resulting in high computational and storage demands.
After discussing how sequencing libraries are prepared and how sequenced reads are used for sequence assembly, we now continue by describing how these reads are actually created by the various sequencing technologies.
2.2
Sanger Sequencing
The first modern approach to DNA sequencing was published by Frederick Sanger et al. in 1977 [SNC77] and
“Sanger sequencing” is still the biochemical foundation of the majority of today’s HTS approaches [SJ08]. It
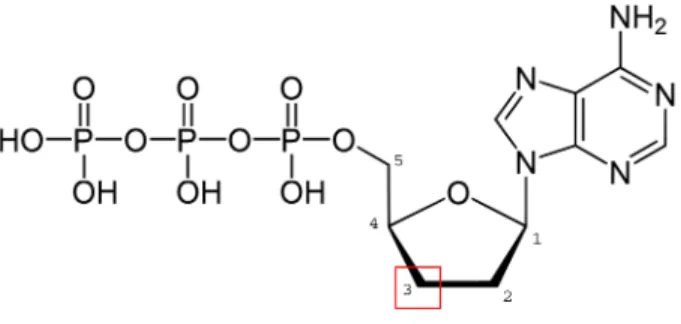
is based on the inhibitory activity of dideoxynucleotide triphosphates (ddNTPs) on DNA polymerase I. ddNTPs lack a 3’-OH group on their deoxyribose sugar which is where the polymerase would attach a
subsequent nucleotide in a replication process (Figure2.3). Usually a phosphodiester bond would be created
in a condensation reaction of the 5’ phosphate of an dNTP and the 3’-OH of the previous nucleotide. However, the lack of this 3’-OH group in ddNTPs inhibits this chain elongation event which is the basis of this so-called dideoxy chain-termination DNA sequencing method. In the following, we describe the main steps of this method in more detail.
Double-strand separation and primer annealing. In a first step, the strands of purified double-stranded DNA (dsDNA) are separated by heating them. This heating process leads to the breakage of hydrogen bonds and Van-der-Waal (VdW) interactions between the two complementary strands which results in their separation.
Primer attachment. In the following, short oligonucleotide primers (about 20nt long) are added to this heated mixture of single-stranded DNA (ssDNA). The mixture is cooled and complimentary DNA strands reattach. As the short primer sequences are more agile when compared with the two complimentary DNA strands, it is much more frequent that primers rather than complimentary DNA strands anneal with a DNA template strand. Thus, this step results in a large number of DNA strands with an attached, short DNA primer.
2.2. Sanger Sequencing 7
Figure 2.3: 2’,3’-dideoxyadenosine triphosphate (ddATP). The red box shows the position of the missing
-OH group. The figure is a modified reprint ofhttp://upload.wikimedia.org/wikipedia/commons/
b/b2/Desoxyadenosintriphosphat_protoniert.svg, in Wikipedia. Retrieved June 24, 2012.
Strand elongation by DNA polymerase. After this, DNA polymerase I as well as dNTPs (dATP, dGTP, dCTP, dTTP) are added to this mixture. The polymerase sequentially elongates the primed DNA fragments by incorporating the dNTPs that are complimentary to the respective nucleotide on the template strand as done during cell replication.
Termination by dideoxynucleotide triphosphates. Now, however, dye-labeled ddNTPs (ddATP, ddGTP,
ddCTP, ddTTP, see Figure2.3) that lack the above-mentioned 3’-OH groups are added in small
concentra-tions to this mixture. These ddNTP are randomly incorporated into the elongated DNA sequences by the polymerase enzyme. As explained above, this ultimately stops the elongation of the respective growing DNA strand. As the concentration of the ddNTPs is low, this incorporation event is rather rare. However, all possible lengths of the replicated DNA fragments will occur in this reaction mixture for statistical
rea-sons, although in possibly differing concentrations. To increase the yield of this reaction one may repeat the
above-listed phases multiple times in a thermal cycler as known from regular PCR experiments. Note that an increased reaction yield means also to be able to successfully apply this method with less original DNA template.
Size separation. Actual sequence determination is then done by sorting the replicated fragments by size (length) and then “reading” them sequentially. For this, the complimentary strands are again separated by heating. Size sorting of the replicated strands is done by capillary electrophoresis. In this process, a thin capillary is filled with gel and the reaction mixture from the previous step is loaded at one end. An electric field is applied and as DNA molecules are negatively charged due to their phosphate backbone, the DNA fragments are pulled through the gel. The speed at which the fragments travel through the gel is, however, determined by their length: the shorter a sequence, the faster it travels as there is less steric hindrance with the molecules in the gel.
Measurement. When the size-sorted DNA fragments finally leave the capillary, a laser excites the dye of the terminating ddNTP on each sequence. The excited dye then emits photons of a specific wavelength due
to fluorescence that are recorded by a special sensor (a photocell). Each ddNTP is labeled with a different
dye that results in different wavelength of the actually emitted radiation1.
1λ
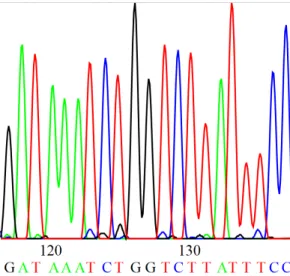
Digital electropherogram. The sensor data is then transmitted to a computer that stores this data in the
form of an electropherogram (Figure2.4). This electropherogram is the basis of the subsequent base-calling
process that assigns an actual sequence of base characters (A,C,T,G) to the peaks of the measured radiation.
Figure 2.4: Electropherogram. The figure is a modified reprint ofhttp://commons.wikimedia.org/
wiki/File:DNA_sequence.svg, inWikipedia.Retrieved August 17, 2012.
2.3
High-throughput Sequencing
Current Sanger sequencing techniques were reported to sequence about 6 Mb of DNA per day at costs of
about $500 per Mb [KK10]. However, in the recent past several alternative techniques have been developed
that reach much higher throughput at lower costs. These so-callednext generation sequencingtechniques
produce much shorter reads (currently approximately 100-500 nt) when compared with the original Sanger
technique which makes the assembly process more difficult. However, they produce a much larger number of
these reads (hundreds of millions) in much shorter time (in less than a day). The higher coverage of these data sets is then exploited to reconstruct the DNA with appropriate accuracy. Such high-throughput techniques are generally cheaper and faster than the traditional shotgun sequencing approach. Several methods based on
different biochemical reactions have been developed in the recent past and will be discussed in the following.
All of these methods, however, are based on a spatial separation (compartmentalization) of DNA templates which enables massive parallelization of the sequencing reactions.
2.3.1
Compartmentalized DNA Amplification
One factor for the high throughput rates of modern sequencing approaches is massive parallelization. This is basically achieved by compartmentalization of DNA templates into micro compartments (wells, droplets in
a water/oil emulsion, etc.). The sequencing reactions as well as the read-out take place in all these separated
compartments in parallel. The basis for most parallelization approaches is the possibility to create small
polymerase colonies (polonies).
Polonies. Polony-based sequencing technologies perform massive, parallel DNA amplification while
keeping identical fragments spatially separated [SPR+05]. Various polony techniques including bridge PCR
2.3. High-throughput Sequencing 9
In bridge PCR, small DNA fragments are amplified using primers that are covalently linked to a solid substrate (e.g., beads). The name is derived from the fact that the DNA elongation products actually form bridges between the bound primers. The primers are covalently bound to a solid substrate and thus immobi-lized. Consequently, the location of the corresponding amplified DNA templates is determined by the spatial
arrangement of the bound primers [FRW+06,SJ08].
Inemulsion PCR (ePCR), the amplified DNA templates are compartmentalized in aqueous droplets in a
water-in-oil emulsion. This compartmentalization has the nice side-effect that it reduces unwanted
recom-bination events that lead to chimeric DNA [WPM+06]2. The copied templates can be bound to magnetic
beads in processes similar to the BEAMing method described by Dressman et al. [DYT+03]. In BEAMing,
magnetic beads that are covalently coated with streptavidin are bound to biotinylated PCR primers. Beads and PCR reagents are mixed in a water-in-oil emulsion in such a proportion that an aqueous compartment contains at most one bead and DNA template on average. This microemulsion is then temperature-cycled like in any normal PCR resulting in a huge number of DNA copies that are bound to the respective beads. The beads can then be separated easily from the emulsion by using a magnet. Other polony techniques not
discussed in detail here includein situpolonies and picotiter PCR.
2.3.2
Reversible Terminator Technologies
Reversible terminator technologies work very similar to the original Sanger method as they also rely on interrupted polymerase activity due to terminator nucleotide analogs. However, in this method, the nucleotide
derivates are equipped with acleavablechemical group. This group terminates the chain elongation process
and contains the fluorescent label used for detecting the respective base incorporation. This group is removed
chemically in a subsequent step and chain elongation by DNA polymerase continues [BKJ06,TRFT08] which
is not possible in the Sanger method.
Illumina/Solexa Sequencing
The popular Illumina sequencing technologies3 makes use of this reversible terminator technology. The
sequence amplification is done by bridge PCR and the resulting amplified DNA is arranged immobilized in an array. During the sequencing step, fluorescently labeled reversible terminators for all four possible bases are used in parallel. These terminators compete for binding to the template. After the proper terminators are bound, their fluorescent labels are read out and the terminator groups are removed chemically. Then, the
process begins again with a now elongated template [FRW+06,MBG+10]. This is the iterative step depicted
in Figure2.1.
2.3.3
Pyrosequencing
Another alternative to the classical Sanger method is pyrosequencing. Pyrosequencing differs from the Sanger
method as it does not rely on a chain termination step but rather on the detection of pyrophosphate release events that occur when nucleotides are incorporated in the growing DNA fragment by polymerase. In this
technique, the template DNA is effectively immobilized and the dNTPs (dATPαS, dGTP, dCTP, dTTP) are
added and removed (washed out) sequentially. The incorporation of a nucleotide into the growing DNA
chain (effectively a condensation reaction) releases pyrophosphate (PPi). This pyrophosphate reacts with a
bioluminescent enzyme (e.g., luciferase) which emits a detectable electromagnetic radiation (light) [Ron01,
KK10].
2Recombinant DNA created from multiple species is called “chimeric DNA”. 3http://www.illumina.com/
Luciferase reaction. The light emitted at nucleotide incorporation time is produced by a simple biochem-ical pathway involving the released pyrophosphate (PPi), adenosine 5’ phosphosulfate (APS), Oxygen and
Luciferin as well as the enzymes ATP sulfurylase and luciferase (see pathway2.3.1).
Pathway 2.3.1 (Pyrosequencing principle, slightly adapted reprint from [Ron01])
(DNA)n+dNT P
DNApolymerase
−−−−−−−−−−−→ (DNA)n+1+PPi (2.1)
PPi+APS −−−−−−−−−−−→AT Psul f urylase AT P+S O24− (2.2)
AT P+Luci f erin+O2
Luci f erase
−−−−−−−−→
Mg2+ AMP+PPi+Oxyluci f erin+CO2+Light (2.3)
The oxidation of luciferin effectively leads to the emission of detectable amounts of light. After each step
the respective dNTPs have to be removed (washed) from the reaction compartments (e.g., microtiter wells). As incomplete removal of the nucleotides leads to false sequencing signals (in particular to phasing problems as described below), strategies for improving this step were developed. An enzymatic method is the addition of apyrase, a nucleotide-degrading enzyme from potato. Apyrase quickly degrades unincorporated dNTPs to the respective dNDPs. However, there is still enough time for the above described luciferase reaction to take place. Thus, shortly after a nucleotide incorporation event all unincorporated dNTPs are degraded and the next type of dNTP can be added.
Deoxy-adenosine-5’-(α-thio)-triphosphate (dATPαS) is used instead of the usual dATP as the latter is
a substrate of luciferase and therefore leads to false signals. A further improvement of the method was
introduced by the addition of single strand binding proteins (SSB) to the reaction system that effectively
cover and stabilize the template DNA [Ron01].
454 Sequencing
The pyrosequencing technique was used by 454 Life Sciences4for parallelized sequence determination [KK10].
In 454 sequencing5, a large plate containing millions of wells (reaction compartments) is used for sequencing.
Each well contains exactly one single bead (due to size constraints) and each bead is associated with single stranded template DNA. This is done by fusing the template with a short sequence that is complementary to a short oligonucleotide that is bound to the bead. The DNA is covered by single strand binding proteins and the beads are then incubated with a mixture of DNA polymerase, ATP sulfurylase and luciferase. dNTPs
are added in each sequencing iteration and are washed out/degraded by apyrase shortly after. Before this,
however, matching dNTPs are incorporated in the growing nucleotide chain resulting in light production by luciferin. The light produced by each well is then recorded by a charge-coupled device (CCD) detector.
2.3.4
Sequencing by Ligation
The sequencing approaches discussed so far are all based on the extension of a DNA template and the accurate detection of nucleotide incorporation events, i.e., on the function of the DNA polymerase enzyme. Such
sequencing approaches are therefore referred to assequencing by synthesis[TRFT08]. In contrast to this,
sequencing by ligationrefers to sequencing approaches that are based on DNA ligase events. DNA ligase is an enzyme capable of building a covalent phosphodiester bridge between a free 5’ phosphoryl group and a free 3’ hydroxyl group of two nucleotides in an ATP dependent manner.
4454 Life Sciences was later bought by Roche Diagnostics. 5http://my454.com/
2.3. High-throughput Sequencing 11
SOLiD
The SOLiD sequencing platform6 is asequencing by ligationapproach that makes use of ePCR for DNA
compartmentalization and parallelization. First, a sequencing library is constructed and immobilized using
rolling circle amplification7. Then, a sequencing primer is ligated to the DNA molecules from this library
and a mixture of 8-mer8probes that carry four distinct fluorescent labels is added. These labels code for the
two 3’-most nucleotides of a 8-mer and the various 8-mers then compete for ligation with the primer. The
one that binds with the greatest affinity is ligated by DNA ligase and all others are washed out. Then the
bound fluorescent label is read out and the bound octamer is enzymatically cleaved by a restriction enzyme, removing the trailing three bases and the label itself (i.e., a five-nucleotide long fragment remains attached to the template). This process determines what nucleotides are bound to the positions 1 and 2 of the DNA
template9. Note, that the SOLiD method actually uses only four distinct labels for encoding the two 3’-most
nucleotides. These labels may distinguish only between four different sets of dinucleotides. This means
that the dinucleotides AA and TT, for example, would be encoded by the same label. This is, however, not a problem as later in the procedure the surrounding pairs are also read, as explained below, and a unique function for transforming the sequence of label signals into an actual DNA sequence exists. After this first step another round is started and the positions 6 and 7 are read (the prior positions are “blocked” by the mentioned 5-mer), etc. After several rounds, the strands are separated again and a new round with a new
primer is started. This new primer is shifted by one nucleotide and thus allows different positions (2 and 3, 7
and 8, etc.) to be read by the method. This procedure is repeated until finally all positions are read out.
2.3.5
Single Molecule Sequencing
All above-mentioned HTS technologies are based on DNA polonies and thus on PCR-replicated ensembles of DNA templates. The large number of copied templates has benefits: the loss of single molecules or the wrong incorporation of a nucleotide in one of these copies is compensated by the others. However, on the downside, the template copying process itself introduces errors too that can be avoided when sequencing is done using a single DNA molecule as a template.
HeliScope
Helicos’ Heliscope technology10 is such a single molecule sequencing approach. It is based on iterative
detection of the fluorescence signals emitted from single DNA templates that are elongated in asequencing by
synthesisapproach. The difference is that by using a highly sensitive detection system, no clonal amplification of the sequence template is required. By this, errors introduced in library building or amplification are avoided. However, current error rates of this technique are still higher than for PCR-based systems, mainly
due to weak fluorescence signals. Currently, HeliScope reads are only around 35 nucleotides long [MBG+10].
6http://www.appliedbiosystems.com/
7Rolling circle amplification (RCA) is a replication system found in bacteriophages, e.g., in the phageφ29. A polymerase (e.g.,φ29 DNA polymerase) replicates a circular DNA template molecule with a short attached primer. This primer is displaced by the polymerase after the first replication “round” and replication continues. Finally, RCA results in a long concatemer of template copies. RCA is a simple and robust way to amplify DNA sequences without thermal cycling as required, e.g., for PCR [FX95,HSMS99,DNGL01].
8The original sequence by ligation approach was published in [SPR+05] using 9-mers instead of 8-mers.
9Note, that different designs of the 8-mers would report a different position in this first step, cf. [RK08] where the method is described with positions 4 and 5.
2.3.6
Other Emerging Approaches
Ion torrent
Ion torrent’s11sequencing approach (akapH sequencing) is quite different from the previously discussed ones.
It is in principle based on the release of a hydrogen ion (H+) that occurs when DNA polymerase includes a
nucleotide into the growing DNA sequence (cf. Pathway2.3.2). In Ion torrent’s technology, DNA templates
are first compartmentalized into a large number of microtiter wells. A proper ratio between DNA molecules, polymerases and wells ensures that each well contains one or zero DNA templates and DNA polymerases on
average. These wells are backed by a ion-sensitive layer and a proprietary H+sensor which is basically a
very small pH-meter. Whenever a nucleotide is included into the growing sequence, the pH in the respective
wells decreases which is recognized by the H+sensor. Now the four different bases are added one after the
other in an iterative fashion and the respective base character is added to the called DNA sequences of the
individual wells if their H+sensor detected a base incorporation. Note that the pH-meter converts chemical
into digital information and is thus the actual base-caller of this technology [Rus11].
Pathway 2.3.2 (Nucleotide incorporation)
(DNA)n+dNT P
polymerase
−−−−−−−−→ (DNA)n+1+P2O47−+H+ (2.4)
SMRT
Pacific Bioscience12 developed a single molecule real-time sequencing approach (SMRT) that is based on
a chip with thousands of nanoscale pores that contain an immobilized DNA polymerase at their bottom.
Labeled nucleotides are added that diffuse in and out of the pore very fast. A laser is used to excite the
labels of the nucleotides when they are at the bottom of the pore (near the polymerase). Eventually, the proper nucleotide is incorporated into the growing sequence by the polymerase which retains this nucleotide
for milliseconds in this particular position. The difference in how long the particular nucleotides reside in a
particular region of the nanopore results in different signal intensities for the various nucleotides and in high
signal-to-noise ratios. This technique uses special, proprietary nucleotides that are labeled at the phosphate chain rather than at the base to avoid polymerase stalling. The labels are actually removed by polymerase at
incorporation time when the phosphodiester bond is created [EFG+09]. One particular interesting application
of SMRT is that the raw fluorescence signals created by this technique allow it to reason upon the methylation
states of the nucleotides in the used DNA template (as these result in different polymerase kinetics) which
opens new possibilities in epigenome research [FWL+10,DHH10,ZJ10]
Nanopore Sequencing
The Oxford nanopore technology13 is based on protein nanopores inserted into an artificial lipid bilayer.
Molecules passing through a pore result in characteristic, detectable changes of an electric current that flows through these pores. These current fluctuations are detected by a patch-clamp amplifier.
Two currently developed sequencing approaches are based on this effect. Inexonuclease sequencing, a
DNA exonuclease is attached to the pore. This enzyme cleaves nucleotides from a given DNA sequence one at a time. The cleaved nucleotides then pass through the pore and their sequence can be detected from
the changes in the current. Instrand sequencing, DNA polymerase is attached to the pore. The template
strand is pulled base-by-base through the nanopore by the polymerase and thus produces the sequence signal.
Nanopore sequencing can also be used to identify epigenetic DNA modifications [CWJ+09,WSH+10].
11http://www.iontorrent.com/ 12http://pacificbiosciences.com/ 13http://www.nanoporetech.com/
2.4. Error Sources in Current Sequencing Methods 13
Graphene-based Approaches
Recently, graphene based DNA sequencing techniques were proposed: In principle, DNA is sequentially
passed through a voltage-biased tunnel gap inside a solid-state nanopore and the differing electronic properties
of the nucleotides would affect an electric current flowing through that pore (quite similar to the Oxford
nanopore technique). It was proposed to use graphene, a single-atom thick carbon material, for building electrodes and membranes for such a technology due to the special characteristics of this material (conducting
properties, thickness, robustness, etc.) [Pos10].
2.4
Error Sources in Current Sequencing Methods
None of the described sequencing approaches is error-free, i.e., the resulting read sequences do not always correspond perfectly with the chemical reality. As the discussed HTS techniques show higher error rates than the classical Sanger method, this latter method still acts as a “gold standard” for sequencing experiments. The rate of errors is an important issue if the detection of rare variations between an analyzed genome and
some reference is the goal of a sequencing experiment [DHH10].
One measure for errors done in sequencing is the average error rate, that is usually further split up into the error rate for substitutions and the rate for insertion or deletion (InDel) events. The various sequencing platforms vary not only in their error probabilities but also in the percentages of what kind of errors (sub-stitution, insertion, deletion) occur. 454 sequencing shows, e.g., mostly InDel error while substitutions are
rather rare. Vice versadoes the Illumnia technology show more substitution errors than InDels errors in the
produced reads [MBG+10].
In general, however, the error probability for a particular base in a read increases with its position in this read. In other words, the first bases of a read are more reliable than the later ones. Reasons for this are
manifold (e.g., decreasing enzyme efficiency, phasing, etc.) and vary for the particular technologies [KK10].
In the following we discuss some general error sources resulting in imperfect reads.
2.4.1
Long Homopolymer Subsequences
One “hotspot” of errors in allsequencing by synthesistechniques are long homopolymer regions, i.e., genomic
stretches of the same nucleotide. The main problem for methods based on DNA polymerase is the known polymerase slippage at such regions. This problem occurs also on short VNTR (variable number tandem
repeat) regions [KK10]. A problem of the 454 technology, for example, is that multiple incorporations of the
same nucleotide may occur per “round”, resulting in artificially elongated homopolymer regions [DHH10,
LMD+12].
2.4.2
Phasing – Loss of Synchronization
Phasing describes the problem that some individuals of a particular template ensemble get ahead or fall behind the other ones during the sequencing reactions and are thus “out of phase” with the others (“loss of synchronization”).
This may happen, for example, when nucleotides are not completely washed out between two pyrose-quencing iterations (cycles). When this occurs, some templates may already bind one of the “old” nucleotides before the next cycle begins and would thus be one base “ahead” of the others. It may, however, also occur that some templates do not incorporate a particular base and thus fall one base “behind” the others. In re-versible terminator technologies, there is also the problem that bases with non-functional terminators are incorporated in some templates which results in the incorporation of another base in the same cycle for these
The major problem of unsynchronized, out-of-phase strands is that phasing is a cumulative effect. This means that such out-of-sync polonies contribute increasing levels of noise to the overall signal over time. Phasing therefore contributes to the decreasing reliability of bases occurring “later” in a read. The errors stemming from loss of synchronization can be partially compensated computationally when the introduced
error rates are known and reproducible. In [MEA+05], the authors report that they derived error rates by
sequencing synthetically created test sequences and used these data to automatically correct the raw signals.
2.4.3
Base Calling
Base calling is the actual process that converts the raw signals of a sequencing instrument into strings of base characters (digital reads). Usually, this is done by special algorithms that analyze the raw read-outs (e.g., images taken with a CCD camera). In other terms, the central base calling step is the act of mapping a sequence of signals (e.g., fluorescence intensities in an electropherogram derived from an image) to a sequence of base characters. This mapping is imperfect and introduces further errors. A base-calling process usually calculates two values per sequenced base:
1. A IUPAC14base character (which may include the N character which stands for “any base”).
2. A quality value that expresses how confident the algorithm is about the called base.
The most wide-spread base-calling algorithm is the Phred algorithm [EHWG98] that was employed
ex-tensively in the Human Genome Project. Phred reads an electropherogram (Figure2.4) and calls the bases
by analyzing its peaks. Additionally, it assigns a quality score (the “Phred-score”) to each base which is
logarithmically related to the probabilitypof a wrong base-call:q=−10×log10p. This means, for example,
that a Phred score of 20 corresponds to a base-calling accuracy of 99% respectively to the probability that 1
out of 100 base calls at this position would be wrong15. In real data sets, Phred scores range up to a value of
about 60 which stands for nearly 100% accurate base call. A wide-spread measure for a read sequence called
with Phred, however, is itsPhred20(akaQ20) score, which corresponds to the number of base calls with a
Phred-score≥20 [G+04].
Phred scores are calculated based on various signal features, such as peak shape and resolution. The extracted feature values are then used to retrieve corresponding error probabilities from technology-dependent lookup tables. These tables were created by analyzing traces of known DNA sequences and counting the
base-calling errors. Although Phred is quite accurate at predicting error rates (see [Ric98]), other approaches
for base-calling were developed over time. The base-calling problem was for example tackled using Hidden
Markov Models (HMMs) and results were comparable with Phred [BEDE04]. In [LWA07], the authors report
a significant performance improvement when compared with this and to the Phred algorithms. Yet another approach, ABI’s KB base-caller, reports longer Q20 stable reads (i.e., reads where each base was called with
a Phred-score≥20) when compared with Phred [G+04]. A general problem for all base calling approaches
is obviously the above mentioned SNR decrease. Consequently, all modern sequencing technologies include specialized software algorithms to increase the SNR based on technology-specific characteristics (e.g., to
compensate for the estimated “crosstalk” between wells that incorporate/do not incorporate the currently
deployed nucleotide in the 454 method).
2.4.4
Decreasing Signal to Noise Ratios
Several other technology dependent reasons lead to decay of the read-out signal. A loss insignal fluorescence
intensity, for example, results in increased base-calling errors in the respective technologies. This is, e.g., the
main source of errors in the Helios single molecule sequencing approach16. Further, as explained above, the
14http://www.iupac.org/ 15q=−10×log
10(0.01)=20.
2.5. Summary 15
increasing loss of synchronization in polony-based sequencing methods leads to increasingly polluted read-out signals which makes the base-calling process more error prone. Signal decay and phasing problems are the main reasons for decreasing signal to noise ratios (SNR) in the created sequencing signals over time.
2.5
Summary
Although differing in their biochemistry, all described HTS approaches are similar in their workflows. Here,
we briefly repeat the general steps as already reported analogously by Shendure and Ji in [SJ08]:
1. Sequencing library preparation by random fragmentation followed byin vitroligation with common
adaptor sequences.
2. Parallel fragment cloning viain situpolonies, ePCR or bridge PCR which results in a spatial separation
of “amplicons”.
3. Sequencing by altering cycles of enzyme-driven (polymerase, ligase) biochemistry.
4. Read-out (e.g., by imaging technologies or ion-sensitive layers) that acquires signals from a whole array of amplicons in parallel.
Current HTS technologies, however, still suffer from higher error rates when compared with Sanger
sequencing. This means that the generated (short) reads contain certain amounts of bases that differ from the
chemical reality which leads to subsequent issues, e.g., when reconstructing the whole nucleic acid sequence from them or when determining genomic variants. Quality values, associated with each read base by base-calling software, provide some measure for how “reliable” a base might be. These quality values can be used for the computational compensation of certain errors (e.g., phasing problems) while others (such as polymerase slippage) cannot be easily detected. It is one goal of bioinformatics research to compensate for such errors by exploiting, e.g., the large number of available reads produced by HTS technologies.
In a summary, HTS technologies have the great advantage of massive parallelism at reduced reaction vol-umes when compared with the classical Sanger technique. This results in faster sequencing at reduced costs
but comes currently at the costs of shorter read length and less accurate base calls [SJ08,KK10,LMD+12].
It is thus common for HTS data that the determined reads differ from the actual nucleic acid sequence they
originate from (due to sequencing errors) and from some reference sequence (such as the human genome)
they are compared with (due to natural variation occurring in any individual17).
Chapter 3
High-throughput Sequencing Data
3.1
Representation of Raw Reads: FASTQ
There are several data formats that store read data (and its associated meta data) created by HTS technologies.
The currently most wide-spread data format for such “raw” reads is arguably FASTQ [CFG+10], an extension
of the well-known FASTA format (see Figure3.1)1. FASTQ files are often huge files (tens of Gigabytes in
size) storing sets of short digital reads and their associated per-base quality values.
@HWI-SN815_0060:5:1101:10000:102873/1 CCTTGTTAAAAACCAGATCACAAATCTGGGGCTCTTGGTCCCATTGGAGAAGGAAGGAAGAGCCTCAAAATAAGTGTGCACCCATGCACATATTCAGGAA + CCCFFFFFHHHHHJJJJJJJJJJJJJJJJJJJJJJJJJHHJJIJGIJJGJJJJHGIJIJJJJJJJHHHHHFFFFCBDEEEEEDDDDDDDDDDEEFEDDDD @HWI-SN815_0060:5:1101:10000:114680/1 TCCTGTCACCGACGCTTCCTCAGGGCCCACACGTCACGCCACCCGTCGGCCTGTCACCGACGCTTCCTCAGTCCCCACAGGCCATGCCACCCCTCTTCCG + >;=;AA7@C<+00)27<?BB=B?#############################################################################
Figure 3.1: A FASTQ file storing two reads (one drawn in black color, the other one in blue color). Each read is represented by four lines: (i) a sequence identifier, (ii) the raw sequence characters, (iii) a plus character (and an optional sequence name), (iv) a string encoding the quality scores of each base character. Quality
values are represented by ASCII characters whose character code was calculated by adding a certain offset to
the respective quality value Phred score (cf. Section2.4.3). This is done to map the quality values to the set
of visible ASCII characters (which start at character code 32). Note that there exist multiple different FASTQ
variants using different offsets (e.g., 33 or 64) [CFG+10,Ill11].
3.2
Mapping and Alignment
Assembly of raw reads in order to reconstruct the original nucleotide sequences is done by special software
algorithms as briefly described in Section2.1.1. In the following, we assume that a reference sequence for
mapping the reads against is always available and do not discussde-novoassembly any further.
Mapping algorithms try to find the position(s) on the reference sequence where a particular read “origi-nated” from. Usually, such algorithms start by determining a number of candidate regions (e.g., by performing
1An alternative data format is, for example, Illumina’s QSEQ format [Ill11]. Today, however, unmapped reads are increasingly stored also in SAM/BAM files as described below.
ak-mer search) and then align the reads to the respective subsequence of the reference sequence which leads to some alignment score. Here, some algorithms support gaps in these alignments (i.e., they support InDels in
the reads) while others do not [SMZ+12]. The genomic position(s) of the highest scoring alignment(s) is/are
then usually reported as a read’s mapping position(s). The output of a mapping process is thus basically a set of genomic positions along with some additional meta data, such as a measure about how confident an algorithm is about a mapping position (a mapping quality value).
Mapping reads against a reference sequence constitutes another possible source of errors. The main reason for this is that alignments are usually not unambiguous, i.e., there are often multiple positions on the reference a particular read can be mapped to. For example, reads stemming from a homopolymer or from a repeated or copied subsequence may be mapped to several positions in the resulting sequence. Knowledge about what reads constitute paired ends (and should thus be mapped at a particular, known distance) helps in the disambiguation of possible mapping sites. Some mapping algorithms additionally exploit knowledge about certain characteristics of a respective sequencing technology the read data originates from. Particularly helpful in this regard are known average error rates and error types (substitutions vs. InDels) for each read position.
Mapping a very large number of short reads is a complex and time-consuming task and several specialized
algorithms/platforms were and are constantly developed to solve this problem efficiently an accurately. Refer
to [SMZ+12,LH10,MBG+10] for recent surveys of current algorithmic approaches and tools for sequence
alignment.
3.3
Representation of Mapped Reads: SAM
/
BAM
The result of a mapping process is a set of mapped reads (i.e., sequences and quality values, their mapping
positions and additional meta data) that is stored in a particular file format for further analysis. The current
de-factostandard for storing mapped read alignments is the Sequence Alignment/Map format (SAM) [LHW+09]2.
SAM is a text file format where each entry (a SAMrecord) stores eleven mandatory fields (storing, e.g., a
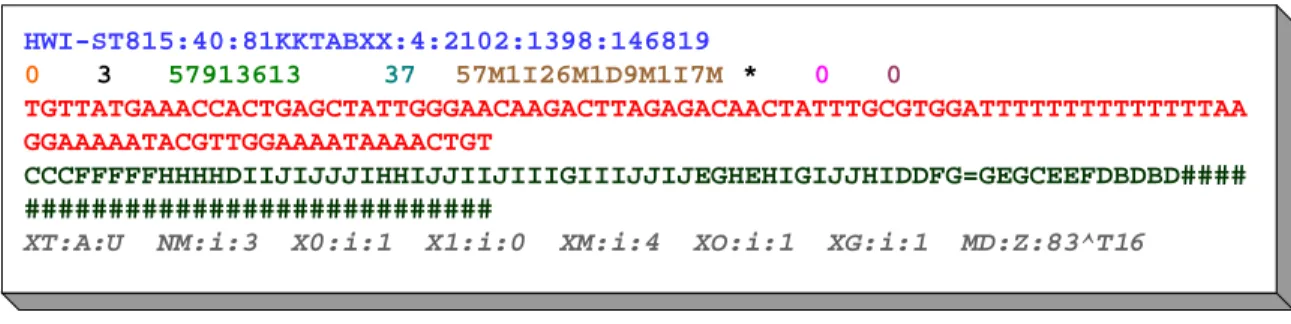
read’s names, its quality-values, its mapping quality, etc.), see Figure3.2.
HWI-ST815:40:81KKTABXX:4:2102:1398:146819 0 3 57913613 37 57M1I26M1D9M1I7M * 0 0 TGTTATGAAACCACTGAGCTATTGGGAACAAGACTTAGAGACAACTATTTGCGTGGATTTTTTTTTTTTTTAA GGAAAAATACGTTGGAAAATAAAACTGT CCCFFFFFHHHHDIIJIJJJIHHIJJIIJIIIGIIIJJIJEGHEHIGIJJHIDDFG=GEGCEEFDBDBD#### ############################
XT:A:U NM:i:3 X0:i:1 X1:i:0 XM:i:4 XO:i:1 XG:i:1 MD:Z:83^T16
Figure 3.2: A SAM record representing a read that maps to position 57913613 on chromosome 3 of the
re-spective reference sequence. The 11 mandatory SAM fields are drawn in different colors to increase the
read-ability of the figure. The optional tags are drawn in grey color with italic letters, for details refer to [The11].
Each SAM record contains a CIGAR string (Compact Idiosyncratic Gapped Alignment Report, as known
from pairwise sequence alignment) that describes its differences from the respective subsequence on the
mapping reference sequence. The CIGAR operations supported by SAM includematch/mismatch,insertand
2It has to be noted that several alternative formats, such as CALF [Gre08] or the Illumina Export format, were proposed for the representation of mapped read data. However, most bioinformatics tools concerned with mapped or unmapped reads nowadays support the SAM/BAM format.
3.4. Compression of HTS Data 19
deleteoperations. In Figure3.2, the CIGAR string “57M1I26M1D9M1I7M” represents that the respective read mapped against the reference genome with two non-consecutive 1bp insertions and one 1bp deletion
between them3.
SAM CIGAR strings furthermore support two kinds of so-called clippingoperations: soft- and
hard-clipping. Clipping means that bases at the beginning or at the end of a read are removed, usually due to their
low quality-values (which is, e.g., common for bases at the ends of reads as discussed in Chapter2). This
also excludes them from the actual alignment process where such “unreliable” stretches of base characters
could introduce major errors. The actual base characters ofsoft-clippedbases are not really removed from
the read sequences but are still contained in the SAM file and can thus be used by subsequent algorithms. A respective CIGAR entry describes which part of the read was used in the alignment and which parts were
“clipped off”.Hard-clippedbases, however, are neither included in the alignment process nor in the SAM file
itself. The respective CIGAR entry tells subsequent algorithms basically that there were some bases in the
raw read data that were clipped-off(e.g., before or during the alignment process). Their sequence, however,
is not reproducible.
SAM additionally supports optional tags (see the lowermost line in Figure 3.2) that may store custom
read-specific meta data. Such tags frequently store meta data calculated during the mapping process (such as the number of perfect hits of a read) or by other downstream operations (such as the per-base qualities before some recalibration process). Refer to the SAM specification for more details and CIGAR examples that also
include padded and clipped bases [The11]. SAM is easily parsable and software libraries in various
program-ming languages exist for reading/writing this format. One problem of this text-based format is, however, that
the resulting file sizes are usually very large (tens of GBytes). For this reason, a binary, compressed version of SAM was developed. The binary SAM (BAM) format consists basically of concatenated BGZF (Blocked GNU Zip Format) blocks of SAM records. These blocks, each one basically a standard gzip archive, are limited to 64 kBytes and are indexed by a hierarchical index structure that allows faster random access to
individual reads/sections in the alignment.
BAM files are, however, still quite large as discussed in the following because the used compression approach does not pay respect to special characteristics of the data but merely applies a general-purpose compression method (gzip) to them. This motivated the development of specialized compression algorithms
for these data as discussed in the following and in the main Chapter4of this thesis.
3.4
Compression of HTS Data
The enormous size of the data associated with HTS experiments motivates the development of specialized compression algorithms for these data. These algorithms can broadly be classified into three groups:
1. Algorithms that compress any biological sequence data (e.g., standalone DNA sequences), such as
Gen-Compress [CKL00], DNACompress [CLMT02], DNAPack [BLF05] or XM [CDAM07], see [GSU09]
for a comprehensive review.
2. Algorithms specialized for compressing unmapped HTS data (mainly stored in FASTQ format), such
as SOLiDzipper [JPAH11], G-SQZ [TLS10], DSRC [DG11] or the algorithms proposed in [BBN+11,
WAA11].
3. Algorithms for compressing whole sets of mapped HTS sequence data as described in [DRC+10,
HYFLCB11,KSK+11,STZH11].
This thesis is concerned with the latter group and in the following we briefly highlight two current trends in mapped HTS data compression: reference-based compression of the actual sequence data and value trans-formation for the compression of per-base quality values.
357Mmeans that there were 57 bases that matched or mismatched the reference,1Imeans a 1bp insertion,26Mmeans again 26 matches/mismatches,1Dmeans a 1bp deletion, etc.
3.4.1
Reference-based Compression
The idea of reference-based compression is to exploit that reads usually differ only slightly from the respective
subsequence on the reference sequence they were mapped to. In such a case it is more efficient to store
the (few) differences between read and reference than to store the actual read sequence itself and several
tools have exploited this [BWB09,CLLX09,DRC+10,WZ11,HYFLCB11]. Drawbacks of reference-based
compression are that the reference sequence has to be available at decompression time (however, this is
usually the case) and that it is not applicable to unmapped reads (cf. [BBN+11]).
3.4.2
Quality-value Transformations
While the actual read sequences can be effectively compressed with the mentioned approaches, this is much
harder for the per-base quality values (q-values) that accompany them. A main reason for this is that q-values have a much wider range of possible values when compared with sequence data. There are, e.g., 94 possible
q-values in Sanger format (0-93, see [CFG+10]) while sequence data is usually composed from only five
IUPAC characters (A,C,T,G,N). Another problem is that q-values show quasi-random distributions in real-world data and the resulting high entropies of these data makes them hard to compress. The most popular strategy to overcome these issues is to transform q-values (either losslessly or lossy) in order to improve
subsequent compression with a general-purpose compression algorithm, such as gzip4, lzma5or bzip26.
Lossless transformations. A lossless q-value transformation strategy is, for example, to store not the actual
q-values themselves but rather their difference to the respective preceding q-value [KSK+11]. While this does
not reduce the range of possible values (in fact, it even increases it by one), it often leads to longer consec-utive stretches of close or even equal values which is subsequently exploited by the mentioned compression
algorithms. Several alternative transformation methods were proposed, e.g., in [WAA11].
Lossy transformations. A lossy value transformation strategy is to really reduce the range of possible q-values by quantization. Quantization reduces the number of possible q-values by mapping subsets of
val-ues to one single value. Again, this is exploited by subsequent data compression algorithms [HYFLCB11,
KSK+11]. Quantization is an irreversible step which makes this strategy lossy.
In the following main part of this thesis, we present a novel compression approach for mapped HTS data sets that makes use of both of these general strategies.
4http://www.gzip.org/
5http://www.7-zip.org/sdk.html 6http://bzip.org/
Chapter 4
NGC: Lossless and Lossy Compression
of Aligned High-throughput Sequencing
Data
In this chapter we present NGC, a tool for the compression of mapped short read data stored in the
wide-spread SAM/BAM format. NGC enables lossless and lossy compression and introduces two novel ideas:
First, we present a way to reduce the number of required code words by exploiting common features of reads mapped to the same genomic positions; second, we present a highly configurable way for the quantization of per-base quality values which takes their influence on downstream analyses into account. NGC, evaluated with several real-world data sets, saves 33-66% of disc space using lossless and up to 98% disc space using lossy compression. By applying two popular variant and genotype prediction tools to the decompressed data, we could show that the lossy compression modes preserve over 99% of all called variants while outperforming comparable methods.
Note that this chapter is a slightly extended version of [PvH12].
4.1
Introduction
Current high-throughput sequencing (HTS) technologies enable the fast, accurate and affordable sequencing
of long stretches of DNA, which adds genome scientific approaches, such as RNA-sequencing (RNA-seq) or whole genome sequencing (WGS) to the set of standard laboratory methods. These technologies result in huge amounts of digital data that have to be processed, transferred, stored and archived, which includes “raw” sequencing data and an even larger number of intermediate and final result files that are produced by
pipelines of data analysis and manipulation tools. Such files store HTS data in different (pre-) processing
states and associated metadata describing these data, such as read names or mapping quality values, using
various file formats, e.g., unmapped reads stored in FASTQ format, mapped reads stored in SAM/BAM or
called variations stored in the VCF format.
In general, all such files are subject to differing data handling and storage policies that define, e.g., where
and how long these files are stored, how fast they have to be accessible or how secure this access has to be. The emerging field of personal genomic sequencing, for example, will result in large amounts of data with high security demands, but not necessarily fast access times. Note that such policies are influenced not only by practical considerations (such as available storage space) but also, e.g., by legal constraints and privacy issues. It is the costs associated with processing, storage and transmission of these data, rather than the generation of sequencing data itself, that constitute a major challenge to HTS experiments today (cf.
[PPG11,Kah11,KSLI12]). This motivates the development of data compression algorithms specialized for the discussed file formats, and recent research in this field may be divided into three major, but overlap-ping, categories: (i) compression of genomic sequences as generally produced by re-sequencing experiments [CDAM07,WZ11,PPG11], (ii) compression of unmapped short reads [TLS10,DG11,BBN+11] and (iii)
compression of aligned read data [DRC+10,HYFLCB11,KSK+11,STZH11]. This work falls in the latter
category, namely by compression of aligned short reads stored in the popular SAM text file format [LHW+09].
This data format stores not only short sequences of DNA characters (read bases) but also a lot of associated metadata such as per-base quality values (q-values), read names or mapping positions. Along with this easily processable text format goes a compressed binary variant (BAM) that basically comprises a blocked, gzipped
version of SAM. Our tool, NGC, allows a more efficient compression of the data stored in SAM/BAM files by
handling each contained data stream individually, using value transformations and compression algorithms
that pay attention to the respective value distributions. An overview of our solution is depicted in Figure4.1.
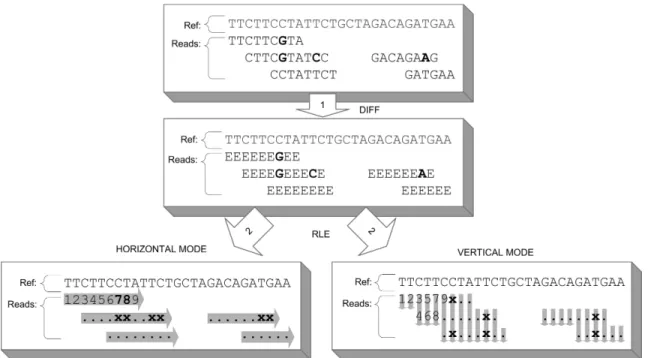
In this chapter, we mainly discuss the used compression approaches for two of these data streams, namely read bases and q-values and briefly sketch our strategies for encoding read names and alignment positions. Our proposed method for the (lossless) compression of read bases builds on the wide-spread idea to store
such data relative to some reference sequence [BWB09,CLLX09,DRC+10,WZ11,HYFLCB11]. However,
we propose to traverse the bases in an alignment of reads in a per-column way that exploits common features of multiple mapped reads rather than handling each read individually as done in previous research. This leads
ultimately to a reduction of required code words and, in consequence, to a more efficient data compression.
We measured the achieved compression rates (the required bits per sample) and overall compression ratios (the ratio between compressed and uncompressed size. The smaller this ratio, the better) and compared them with related tools. Regarding the compression of q-values, we contribute a detailed discussion of several pos-sibilities for their lossy compression and analyse the impact of the associated information-loss on subsequent data analysis pipelines. We propose a novel way for lossy q-value compression that distinguishes between
different categories of q-values and is able to preserve the original qualities of bases in selected columns,
that are the main targets of variant-calling and genotype prediction algorithms. We have evaluated our lossy per-base quality value compression using variant calling pipelines composed of state-of-the-art analysis tools and found that our proposed methods may preserve 99-100% of all called variants on average while
outper-forming comparable methods. Our evaluation includedHomo sapiens,Mus musculus,Escherichia coliand
Arabidopsis thalianadata from exome, whole genome, ChIP and RNA sequencing experiments.
4.2
Materials and Methods
4.2.1
Datasets and software availability
The used evaluation datasets are deposited in the Sequence Read Archive [KSLI12] under study
number-s/run accession numbers: ChIP-Seq (mouse): SRX014899/SRR032209, Reseq/hm (human): SRX000376
/SRR001471, RNA-Seq (E. coli): ERX007969/ERR019653, Reseq (E. coli, paired end): ERX008638/
ERR022075, Reseq (E. coli): SRX118029/SRR402891, Reseq (A. thaliana): SRX011868/SRR029316.
The human exome-sequencing data set was kindly given to us by B. Streubel. The Reseq/chr20 (human)
dataset is a resequencing data set of human chromosome 20, available from the GATK resource bundle (see
AppendixA). The data sets were mapped using BWA v0.6.1 [LD10] with standard parameters for single
re-spectively paired end data. Unmapped reads were pruned from the data sets; variants were called with GATK
v1.4 [MHB+10] and SAMTOOLS v0.1.18 [LHW+09] using the parameter settings given in AppendixA.
NGC was implemented in Java 1.7 and is available for non-commercial use at
4.2. Materials and Methods 23
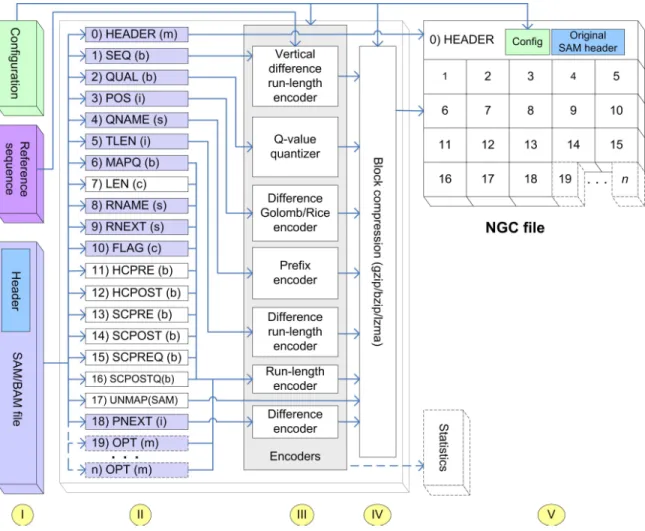
Figure 4.1: Schematic overview of the NGC compression approach. NGC takes a SAM/BAM file, a reference
sequence and a set of configuration parameters as input (step I) and generates an NGC file and an optional statistics file (optional components drawn with dashed lines). First, NGC de-multiplexes the various data streams and adds some additional streams (step II). These streams are then passed to our various encoders that transform their values and prepare them for the subsequent block-compression (step III). In this step IV, the data is compressed using a general-purpose compression algorithm (gzip, bzip2 or lzma). Finally, the compressed data blocks, the original SAM file header and the required configuration information are combined to one single output file (step V). Hatched streams (step II) encode the information described in [The11] although with very different encoding schemas. Unhatched streams encode: 7: read lengths, 11-16:
data required for reconstructing clipped bases/q-values, 17: unmapped reads. The basic data types of the