U.S./Mexico Border Health Issues:
The Texas Rio Grande Valley
Prepared by
David C. Warner, Ph.D.
Lauren R. Jahnke, M.P.Aff.
Regional Center for Health Workforce Studies
Center for Health Economics and Policy
The University of Texas Health Science Center
at San Antonio
About the Authors
David C. Warner, Ph.D., is Wilbur Cohen Professor of the LBJ School of Public Affairs at The University of Texas at Austin, a visiting professor at The
University of Texas School of Public Health, and Associate Scientist with the Regional Center for Health Workforce Studies at The University of Texas Health Science Center at San Antonio.
Lauren R. Jahnke, M.P.Aff., is a freelance consultant in the health policy field and performs research, report-writing, editing, grant-writing, evaluation, and other consulting services for local and state government agencies, non-profit organizations, and companies working with public-sector clients. She owns LRJ Research & Consulting in Austin, Texas.
© Copyright 2003, Regional Center for Health Workforce Studies at The University of Texas Health Science Center at San Antonio
7703 Floyd Curl Drive, MSC 7907, San Antonio, TX 78229 (210) 567-3169 office / (210) 567-6804 fax
All Rights Reserved
No part of this document may be reproduced in any form or by any means, electronic or mechanical, including photocopying, recording or by any information storage and retrieval system, without permission in writing from the publisher.
Table of Contents
List of Tables ... iii
List of Figures ... v
Preface and Acknowledgments ... vii
Chapter 1. Introduction ... 1
Medicaid and the State Children’s Health Insurance Program ... 1
The Uninsured ... 3
Chapter 2. Profile of the Study Area ... 6
Chapter 3. Health Indicators ... 11
Communicable Diseases in the Study Area, Texas, and U.S. ... 11
Communicable Diseases in Mexico ... 18
Maternal and Child Health ... 19
Oral Health ... 21
Chronic Disease ... 22
Chapter 4. Health Resources ... 27
Border Public Health Systems ... 27
Border Health Programs ... 30
HRSA’s Role in the Border Health Care System ... 36
Health Professions ... 41
Projections of Required Health Resources through 2010 ... 49
Chapter 5. NAFTA and Trade in Health Services ... 57
Provisions of NAFTA Related to Health Services ... 57
Cross-Border Practice and Training ... 59
Chapter 6. The Impact of NAFTA on Border Development and Health Status ... 63
Provisions of NAFTA Related to Health Services ... 63
NAFTA’s Impact on Border Housing and Communities ... 64
Appendix A. Population Projections if Net Migration = 0 ... 68
Appendix B. Population Projections if Net Migration = 1 ... 75
List of Tables
Table 1.1 Number and Percents of SCHIP Enrollees for the Study Area
and Texas, 2002 ... 2
Table 1.2 Number and Percents of Medicaid Enrollees for the Study Area
and Texas, 1998 and 2002 ... 3
Table 1.3 Number and Percent of Uninsured People in the Study Area,
Texas, and U.S., 2000 ... 4
Table 3.1 Tuberculosis Case Rates in the Study Area, Texas, and U.S., 2001 ... 12
Table 3.2 Gastrointestinal Disease Case Rates in the Study Area,
Texas, and U.S., 1999 ... 14
Table 3.3 Sexually Transmitted Diseases in the Study Area, Texas, and U.S., 1999 … 15
Table 3.4 Cumulative Cases of HIV/AIDS through end of 2001
in the Study Area,Texas, and U.S. ... 18
Table 3.5 Estimates of the Number and Percent of People with
Diagnosed Diabetes in the Study Area and Texas, 2001 ... 22
Table 4.1 Local Public Health Services in the Study Area, 2000 ... 28
Table 4.2 Mexican Border Health Care Services ... 29
Table 4.3 A Comparison of Early Childhood Intervention Programs with Total Births and Indicators of Learning Disabilities in the Study Area and Texas, 2000 .. 33
Table 4.4 HRSA Funding in the Study Area, FY 2002 ... 37
Table 4.5 Profile of Community/Migrant Health Centers in the Study Area, 2001 ... 38
Table 4.6 HRSA Grants to UTHSCSA for Health Professions Students ... 40
Table 4.7 Health Professional Shortage Areas and Medically Underserved Areas
by County, 2002 ... 42
Table 4.8 Total Practicing Physicians in the Study Area, Texas, and U.S., 2002 ... 43
Table 4.9 Primary Care Physicians by Specialty in the Study Area and Texas, 2002 .. 44
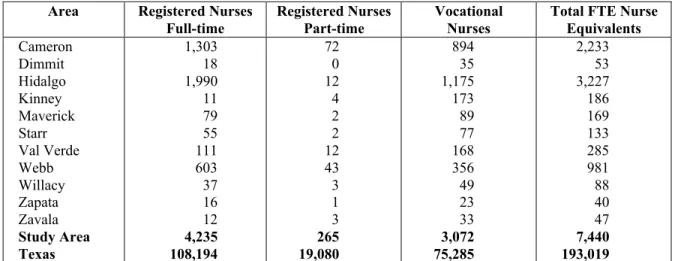
Table 4.10 Licensed Nurses in the Study Area and Texas, 2002 ... 45
Table 4.12 Nurse Practitioners and Physician Assistants in the Study Area
and Texas, 2001... 49
Table 4.13 Population Distribution in the Study Area ... 50
Table 4.14 Number of Physicians and Nurses per 100,000 Population
in the Study Area, Texas, and U.S. ... 51
Table 4.15 Additional Physicians and Nurses Needed to Reach National
Ratios per 100,000 Population in the Study Area in 2002 ... 51
Table 4.16 Additional Physicians and Nurses Needed to Reach National
Ratios per 100,000 Population in the Study Area in 2010 ... 52
Table 4.17 Summary of Additional Medical Personnel Needed in the Study Area ... 52
List of Figures
Figure 2.1 Map of Texas Counties in the Study Area ... 7
Figure 3.1 Tuberculosis Case Rates in Texas and the Study Area, 1995-2001 ... 12
Figure 3.2 Syphilis and Gonorrhea Case Rates in the Study Area
and Texas, 1995-1999 ... 16
Figure 3.3 Crude Birth Rates in the Study Area, Texas, and U.S., 2000 ... 19
Figure 3.4 Percentage of Low Birth-Weight Babies Compared to Percentage
of Women Receiving Prenatal Care in First Trimester, 2000 ... 20
Figure 3.5 Percent of Women in the Study Area and Texas Receiving
Adequate Prenatal Care Based on the Kessner Index, 2000 ... 21
Figure 4.1 Population per Primary Care Physician in the Study Area,
Texas, and U.S., 2002 ... 44
Figure 4.2 Population per Nurse FTE in the Study Area and Texas, 2002 ... 46
Preface and Acknowledgments
This report is part of a series of publications on health workforce issues and solutions for the United States/Mexico border region, a major area of research at the Regional Center for Health Workforce Studies. It provides a good introduction to the series since the Texas region and its Mexican counterpart make up the largest component of the U.S./Mexico Border, and, most of the unresolved health challenges affecting the lives of Border residents can be found in the Texas Rio Grande Valley.
The study updates a pilot project sponsored by the Health Resources and Services
Administration of the U.S. Department of Health and Human Services, begun in 1996 under the direction of the first author and completed in 1999. It revisits the strains that rapid industrialization and the population growth stimulated by NAFTA have placed upon already-limited health services. The access-to-care problems such as poverty, lack of insurance, limited infrastructures, lack of providers and of a culturally sensitive health care delivery system have not substantially changed in spite of many good programs, greater attention to Border issues and many hopes. Tracking the changes that did occur is a necessary first step for guiding the renewed resolve of the border communities, needed targeted interventions and further research.
In spite of the constrains imposed by a limited budget, Professor David Warner, and Ms. Lauren Jahnke succeeded in assembling a well-structured profile of needs and issues that is both informative and thought provoking. They deliberately maintained the basic format of the previous report to increase the comparability and usefulness of the information. With the authors, we gratefully acknowledge the valuable assistance of the National Center for Health Workforce Analysis of the Health Resources and Services Administration, the Texas Department of Health, the Texas Association of Community Health Centers and all the individuals and organizations listed throughout the report that provided data and technical support.
Antonio Furino Director
Regional Center for Health Workforce Studies Center for Health Economics and Policy
Chapter 1. Introduction
This report highlights health issues and resources and details current and future challenges in the Texas/Mexico border region. This area is one of the poorest and most underserved areas in the United States, although many agencies and organizations are now addressing the problems and progress is being made in many areas. The area on both sides of the border is constantly in a state of flux, and large population increases in the area as well as socioeconomic changes have been brought about by the passage of the North American Free Trade Agreement (NAFTA) in 1993, as well as various political and fiscal changes since then. Several of the most important changes and developments affecting access to health care services, including Medicaid, the State Children’s Health Insurance Program, and the growing number people without health insurance, are described below.
Medicaid and the State Children’s Health Insurance Program
In the last four years there have been expansions and simplifications of publicly funded health insurance for children and adolescents that have significantly expanded coverage in the study area. These include the two-part implementation of the State Children’s Health Insurance Program in 1998 and 2000, and the Medicaid simplification initiatives passed by the 77th Texas Legislature in 2001.
The State Children’s Health Insurance Program (SCHIP) was developed as part of the federal Balanced Budget Act of 1997. As part of this act, Congress appropriated a fixed amount of funds that individual states could draw down in a program which allowed them to design a health insurance plan for residents below the age of 19 who fell below two times the poverty level. The coverage provided had to either be similar to Medicaid, the state employee’s health insurance plan, or the plan provided by the largest HMO in the state. Enrollees could not be eligible for Medicaid or have recently been enrolled in health insurance provided by their parents’
employers, and those at higher incomes were expected to meet a higher level of cost-sharing. States were given incentives to develop SCHIP programs since the required state match was only 70 percent of that state’s Medicaid match. Texas implemented a minor step of the SCHIP
program in 1998 when it extended coverage under Medicaid to all eligible 15-18-year-olds whose family income fell between the AFDC eligibility level (around 24 percent of poverty) and 100 percent of poverty. In the second phase, the 76th Texas Legislature (1999) extended SCHIP to all children and adolescents under 200 percent of poverty who were legal residents of Texas and who met the other SCHIP criteria. This phase began in the spring of 2000. Community-based groups were employed to help inform the public and to promote enrollment, and by 2002 more than 500,000 children were enrolled state wide (see Table 1.1).
Table 1.1
Number and Percents of SCHIP Enrollees
for the Study Area and Texas, 2002
Area Number of SCHIP Enrollees
Percent of Total 2002 Population
Percent of 2002 Population 18 and under Cameron Dimmit Hidalgo Kinney Maverick Starr Val Verde Webb Willacy Zapata Zavala Study Area Texas 13,932 523 31,282 67 2,506 3,202 1,178 9,776 968 545 574 64,553 517,241 4.0 5.0 5.2 2.0 5.1 5.7 2.6 4.8 4.7 4.4 4.9 4.7 2.4 11.3 14.8 14.1 7.6 13.4 14.6 7.61 12.7 14.4 12.6 13.9 13.0 8.2
Sources: Texas Health and Human Services Commission, CHIP Enrollment Activity by County, August 1, 2002, online at http://www.hhsc.state.tx.us/chip/chip_statewide_web_rpt.pdf, accessed September 17, 2002; and Texas Department of Health, Office of Health Information and Analysis, Texas Population Projections for 2002, online at http://www.tdh.state.tx.us/dpa/popdata/pg02.htm, accessed September 16, 2002.
Medicaid has traditionally been difficult to enroll in, has had a welfare stigma attached to it, and if one’s economic situation improved, enrollees had to report within a month and were subject to being disenrolled. In June 2001, Governor Perry signed into law Senate Bill 43, the Children’s Medicaid Eligibility Simplification Bill. The main elements of the bill included a mail-in application and re-certification for Children’s Medicaid; a simplified, self-declared assets screen similar to the one used by SCHIP; a single consolidated application and parallel procedures for Medicaid and SCHIP; and phased in continuous eligibility for children through age 19. This included six months continuous eligibility implemented by February 2002 and 12 months
continuous eligibility to be implemented by June 2003.1 These simplification measures removed many of the barriers to Medicaid access and are expected to result in an increase in the number of children on Medicaid. Medicaid enrollments in Texas dipped in the late 1990s to lower levels because of a sturdy economy and the implementation of welfare and immigration reform.
Enrollment levels are now increasing again due to the economy worsening since the late 1990s (see Table 1.2).
As indicated in Tables 1.1 and 1.2, the percentage of people enrolled in Medicaid in the study area as well as the percentage of people enrolled in SCHIP are over twice that of the state as a whole.
Table 1.2
Number and Percents of Medicaid Enrollees for
the Study Area and Texas, 1998 and 2002
Area Number of 1998 Medicaid Enrollees Percent of 1998 Population Number of 2002 Medicaid Enrollees Percent of 2002 Population Cameron Dimmit Hidalgo Kinney Maverick Starr Val Verde Webb Willacy Zapata Zavala Study Area Texas 69,554 2,841 115,466 349 11,304 15,005 7,796 37,692 5,505 2,317 3,368 271,197 1,709,094 21.9 26.7 22.1 10.1 24.4 29.0 18.0 19.5 28.7 21.7 28.3 22.0 8.6 84,630 2,938 149,252 441 12,609 16,725 8,970 44,751 5,896 2,870 3,546 332,628 2,204,907 24.1 28.3 24.8 13.1 25.8 29.9 19.4 21.8 28.7 22.9 30.0 24.3 10.3 Sources: Texas Health and Human Services Commission (HHSC), Texas Medicaid Enrollment as of August 2002, online at http://www.hhsc.state.tx.us/research/dssi/db_search/cntysearch.asp, accessed September 17, 2002; HHSC,
Texas Medicaid Enrollment by Program Categories for August 2002, online at http://www.hhsc.state.tx.us/research/ dssi/LatestEnrollmentbyCategory.html, accessed September 17, 2002; HHSC, “Texas Medicaid Enrollment by County for August 1998,” in Excel file Spreadsheet with Texas Historical Enrollment County Information, downloaded from http://www.hhsc.state.tx.us/research/dssi.htm, October 2, 2002; Texas Department of Health, Office of Health Information and Analysis, Texas Population Projections for 2002, online at
http://www.tdh.state.tx.us/dpa/popdata/pg02.htm, accessed September 16, 2002; and Texas State Data Center, Texas Population Estimates Program, County Estimates, 1994-1999, online at http://txsdc.tamu.edu/tpepp/ txpopest.php, accessed August17, 2002.
The Uninsured
In spite of the increase in availability of free or low cost health care coverage to children in South Texas, the problems of the uninsured remain more persistent and intense in the study area than nearly anywhere else in the nation. In Texas, eligibility of aged, pregnant, non-disabled adults for Medicaid is limited to parents who have been citizens or legal immigrants since at least 1996 and whose “countable income” is less than 34 percent of the federal poverty level.2 For those who have no affordable private insurance or access to Medicaid or Medicare there is the possibility of a public hospital or county indigent care program serving as a safety net. But, except for Maverick County there are no public hospitals in the study area, and the counties are only responsible for covering adults who are below 21 percent of the federal poverty level.
After a county has paid more than 8 percent of its general fund revenues for indigent health care, like Hidalgo County did, the state has a pool to pay for additional costs. However, Hidalgo has represented a high proportion of total state payments from this pool and in April 2001 the state pool ran out of funds, and at that point Hidalgo terminated its indigent care program for the balance of the fiscal year. This is not to say that many poor residents of the study area do not go
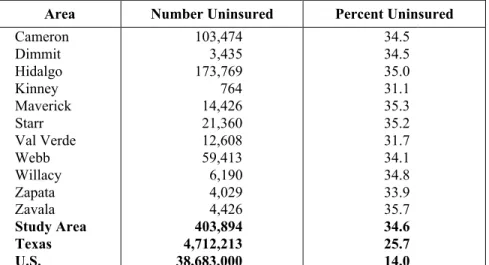
to government and charity-supported clinics—often Community Health Centers—but means that for many, the availability of funding for necessary inpatient services is simply not available. Table 1.3 illustrates the percentages of uninsured persons in the study area counties.
Table 1.3
Number and Percent of Uninsured People in the Study Area,
Texas, and U.S., 2000
Area Number Uninsured Percent Uninsured Cameron Dimmit Hidalgo Kinney Maverick Starr Val Verde Webb Willacy Zapata Zavala Study Area Texas U.S. 103,474 3,435 173,769 764 14,426 21,360 12,608 59,413 6,190 4,029 4,426 403,894 4,712,213 38,683,000 34.5 34.5 35.0 31.1 35.3 35.2 31.7 34.1 34.8 33.9 35.7 34.6 25.7 14.0
Notes: County and Texas estimates are calculated for people under 65 only, while U.S. estimate may include a small number of people over 65 who do not have Medicare. Many children have been enrolled in Medicaid and SCHIP in Texas since 2000, so these numbers may have decreased slightly; HHSC plans to have updated estimates available in November 2002.
Sources: Texas Health and Human Services Commission, Estimated Texas Uninsured Population Under Age 65 by County in Year 2000, Excel spreadsheet; and U.S. Census Bureau, Current Population Survey March 2001, Table HI06. Health Insurance Coverage Status by State for All People: 2000, online at http://ferret.bls.census.gov/ macro/032001/health/h06_000.htm, accessed September 17, 2002.
Notes
1 Center for Public Policy Priorities, Children's Medicaid Eligibility Simplification Bill, SB 43, Sent to Governor
(Policy Page No. 131, May 31, 2001), online at http://www.cppp.org/products/policypages/131-150/131-150html/PP131.html, accessed November 14, 2002.
2 Families USA, Uninsured Parents and Medicaid Information, State by State (Washington, D.C.: Families USA
Chapter 2. Profile of the Study Area
The study area includes 11 Texas counties: Cameron, Hidalgo, Starr, and Willacy in the Lower Rio Grande Valley, and Dimmit, Kinney, Maverick, Val Verde, Webb, Zapata, and Zavala in the Mid-Rio Grande Valley (see Figure 2.1). These counties border a number of municipios in the neighboring Mexican states of Tamaulipas and Coahuila, and Nuevo Leon. This area was chosen for the study because it has most of the health challenges and opportunities of the entire border region while being sufficiently small for meaningful data collection and analysis. Some of the main cities in the study area are Brownsville, Del Rio, Eagle Pass, Edinburg,
Harlingen, McAllen, and Laredo. Population projections by the Texas State Data Center indicate that without net migration into the area, the population of the 11-county region will reach
1,787,732 by the year 2020. If migration continues at the current rate, the population is estimated to grow to 2,316,322 (the 2000 population was estimated to be 1,301,048). In 2000, 88.2 percent of the population was Hispanic. By 2020, assuming current migration rates, the Hispanic population is projected to be 93.3 percent of the total. (See Appendices A and B for population projections by migration scenario, county, year, and age group.)
Figure 2.1
Map of Texas Counties in the Study Area
Val Verde Kinney Maverick Zavala Dimmit Webb Zapata Starr Hidalgo Willacy Cameron
In February 2000, the population of the Mexican state of Tamaulipas was estimated to be
2,753,222 and the state of Coahuila was 2,298,070.1 The population of the municipios across the border from the study area in these two states (plus the one municipio in Nuevo Leon that is on the border between these two states) was estimated to be 1,675,605in 2000 (See Table 4.2 in Chapter 4 for list.)
In 2000, 35.4 percent of the residents in the study area lived below the poverty level compared with an average of 15.4 percent for Texas and 12.4 percent for the United States. Zavala County at 41.8 percent poverty, Starr County at 50.9 percent, and Brooks County (which touches Starr and Hidalgo Counties) at 40.2 percent, are not just the highest county poverty rates in Texas, but in the whole United States.2 The average per capita income in 2000 in the region was $13,622, compared with an average of $27,752 for Texas and an average of $29,469 for the U.S.3 More people cross the U.S./Mexico border than any other border in the world. There are over 250 million legal border crossings from Mexico into the United States each year, and over 140 million into Texas.4 In addition to legal immigrants, it was estimated that 1.2 million
undocumented immigrants are living in Texas in 2002.5 In fiscal year 2001, 1,235,717 people were apprehended along the U.S./Mexico border trying to enter the U.S. illegally (25 percent lower than the previous year).6 In 1999, about 4.4 million trucks crossed the Texas/Mexico border, 2.3 million from Mexico to Texas and 2.1 million from Texas to Mexico. These were through the nine main ports through which data is available. (There are 23 international crossing points for trade between Texas and Mexico, 16 of which are in the study area.) The busiest border crossing port in Texas, the international bridges connecting Laredo to Nuevo Laredo, had 2.8 million commercial vehicle crossings. The commercial vehicle crossings from Mexico through the nine main Texas ports have increased 216 percent from 1990 to 1999 (726,000 to 2.3 million).7
From a health standpoint, the high level of migration between the two countries suggests that infectious diseases may be easily carried from one country into the other. The impact of this health risk is heaviest on the border region, but diseases are also carried to the interior of both countries. Also, because of the high rate of migration and other factors, people from each side of the border often utilize health care services on the other side of the border.
Binational mobility in itself is not a problem, but when public health has a binational dimension, the issues to be addressed become more challenging. Diseases in a mobile population are more difficult to treat and in a border area can be carried across from one country to another. The communicable diseases of most concern are tuberculosis, HIV/AIDS, and rarer diseases such as cholera and dengue fever. Additionally, the common health problems are made more difficult to address by the presence of two separate public health systems whose different priorities and protocols complicate treatment and prevention. For instance, an outbreak of food-borne illness found on one side of the border may have originated on the other side, but detecting its source may require unusual amounts of time and effort because of inadequate binational cooperation. There were estimated to be 66,846 migrant and seasonal farm workers in the study area in 2000, and when their families are added to the total, 115,794 people traveled away from home for extended periods for agricultural labor.8 The migrant and seasonal farm workers in the study area represent 5.19 percent of the total population (8.99 percent including families), while the
number of migrant and seasonal farm workers in Texas (197,393) represents slightly less than 1 percent of the state population, and slightly under 2 percent including their families (362,724).9 The outmigration of 9 percent of the population of the study area for three to nine months of each year presents unique challenges for delivering adequate health care to the region, as does the inmigration of an estimated 143,000 “winter Texans” (retirees from colder states) who spend about four months each winter in south Texas, especially in the Lower Rio Grande Valley.10 The 2000 Census reported that 32.5 percent of the population 25 years or older in the 11-county study area had less than a ninth grade education. In the state as a whole, only 11.5 percent of the adult population had not completed ninth grade.11
In addition to these adverse socioeconomic conditions, the region has to contend with the health challenges that are unique to the colonias. Colonias are substandard housing communities in unincorporated areas often lacking potable water, sewage and electrical infrastructure, and telephone service. There are estimated to be 1,450 colonias in Texas in 2002, with an estimated population of 350,000 (compared to 280,000 in 1992).12 Most of this population lives in
Cameron, Hidalgo, Maverick, Starr, Webb, and El Paso Counties. While progress has been made by many organizations attempting to address the infrastructure needs of the colonias, there are still large problems due to the underlying problems of poverty and unavailability of other housing options in those areas. Because of inadequate water and sewage facilities, many colonia residents face significant health hazards. These are usually combined with significant barriers to accessing health services.
Notes
1 Instituto Nacional de Estadística, Geografía e Informática (INEGI), Mexico’s Population by State, 1895-2000,
online at http://www.inegi.gob.mx/difusion/ingles/fiesoc.html, accessed September 9, 2002.
2 U.S. Census Bureau, Population by Poverty Status in 1999 for Counties: 2000, online at
http://www.census.gov/hhes/poverty/2000census/poppvstat00.html, accessed August 15, 2002.
3 Texas Health and Human Services Commission, Estimates of Per Capita Personal Income in Texas for Selected
Years, online at http://www.hhsc.state.tx.us/research/dssi/PerCapInc.html, accessed August 14, 2002.
4 U.S. Department of Transportation, Bureau of Transportation Statistics, U.S.-Mexico Border Crossing Data, online
at http://www.bts.gov/programs/itt/cross/mex.html, accessed September 9, 2002.
5 Federation for American Immigration Reform (FAIR), Texas: Illegal Immigration, online at
http://www.fairus.org/html/042txill.htm, accessed September 9, 2002.
6 Immigration and Naturalization Service, “Southwest Border Apprehensions,” in Monthly Statistical Report and
September FY 2001 Year End Report, online at http://www.ins.usdoj.gov/graphics/aboutins/statistics/ msrsep01/SWBORD.HTM, accessed September 17, 2002.
7 Texas Comptroller of Public Accounts, Special Report: State Functions at the Texas-Mexico Border and
Cross-Border Transportation, Section I. Economic Factors Affecting Cross-border Transportation (January 2001), online at http://www.window.state.tx.us/specialrpt/border/index.html, accessed September 9, 2002.
8 Alice C. Larson, Migrant and Seasonal Farmworker Enumeration Profiles Study, Texas (Report for Migrant
Health Program, Health Resources and Services Administration, 2000), online at http://bphc.hrsa.gov/migrant/ Enumeration/final-tx.pdf, accessed September 13, 2002.
9 Alice C. Larson, Migrant and Seasonal Farmworker Enumeration Profiles Study, Texas (Report for Migrant
Health Program, Health Resources and Services Administration, 2000), online at http://bphc.hrsa.gov/migrant/ Enumeration/final-tx.pdf, accessed September 13, 2002.
10 The University of Texas-Pan American, Center for Tourism Research, Winter Visitor Study, online at
http://www.coba.panam.edu/centers/tourism.html, accessed September 24, 2002.
11 U.S. Census Bureau, Table DP-2, Profile of Selected Social Characteristics: 2000, online at
http://quickfacts.census.gov/qfd/states/48000.html, accessed August 15, 2002.
12 Texas A&M University, Colonias Program, Colonias in Texas, online at http://chud.tamu.edu, accessed August
Chapter 3. Health Indicators
Communicable Diseases in the Study Area, Texas, and U.S.
Many border communities are so closely linked to their counterparts across the border that the two neighboring areas must be considered as one zone in terms of containing the spread of infectious diseases. Being under the jurisdiction of independent public health systems, however, greatly complicates a unified approach to disease control.
The problems are bilateral. The United States is concerned about diseases such as tuberculosis, cholera, and malaria often imported from Mexico, and Mexico is concerned about diseases such as HIV/AIDS often imported from the United States. In Mexico there is further concern about return migrants bringing diseases back to their families in Mexico. Concerns over infectious diseases are not limited to the border because the diseases are likely to move to the interior of either country via migration. For this reason, the public health departments in Los Angeles, Houston, Dallas, and Chicago have been warning for some time that they should be considered “border impact zones.”
The incidence of the more common and hazardous infectious diseases on the U.S. side of the border and some of the issues involved in combating them are discussed in the following sections.
Tuberculosis
Table 3.1 shows that in 2001 tuberculosis rates in the study area were 192 percent higher than in Texas as a whole and 271 percent higher than the nation as a whole. The treatment of
tuberculosis in the region is difficult because it usually requires a minimum of six months of drug therapy. Patients from this highly mobile population often interrupt or discontinue
treatments as they move around, and travel and the large number of trans-border families reduce the effectiveness of community infection control initiatives.
A major concern in recent years has been the emergence of multi-drug-resistant tuberculosis. From 1995-2001, the number of cases of multi-drug-resistant TB in Texas peaked in 1996 at 141, and has varied since then, with 95 cases reported in 2001. Of these 95 cases, 16 (16.8 percent) occurred in the study area.1 The presence of drug resistance creates a significant challenge for public health officials because as treatment difficulties increase with population growth and mobility (such as in the border region), so does the possibility of increased drug resistance. This is because early discontinuation of medication contributes to drug resistance, and because tuberculosis has a much longer treatment period than most infections, it is more likely that people will not complete the drug regimen.
Figure 3.1 shows that tuberculosis case rates (per 100,000 population) have been consistently higher in the study area than in Texas as a whole, though rates have tended to decrease most years since 1995.
Table 3.1
Tuberculosis Case Rates in the Study Area,
Texas, and U.S., 2001
Cameron Dimmit Hidalgo Kinney Maverick Starr Val Verde 16.0 0 13.1 0 23.9 28.1 19.9 Webb Willacy Zapata Zavala Study Area Texas United States 16.0 0 14.4 14.2 15.2 7.9 5.6 Note: Rates are per 100,000 population.
Sources: Texas Department of Health (TDH), Bureau of Communicable Disease, Tuberculosis Incidence Rates per 100,000 Population by County, Texas 1995-2001, online at http://www.tdh.state.tx.us/tb/RatesbyCountyTBL.htm, accessed August 16, 2002; TDH, Bureau of Communicable Disease, Tuberculosis Elimination Division Statistics (Cases by County and Rates by County), online at http://www.tdh.state.tx.us/tb/Stat.htm, accessed August 16, 2002; Texas State Data Center (TSDC), Texas Population Estimates Program, County Estimates, 1994-1999, online at http://txsdc.tamu.edu/tpepp/txpopest.php, accessed August17, 2002; TSDC, Texas Population Projections Program,
2001 Population Projections (Table 2) by County, online at http://txsdc.tamu.edu/tpepp/table2/csv_county.php, accessed August12, 2002; TDH, The Health of Texans, Austin, Texas, 2002, p. 64.
Figure 3.1
Tuberculosis Case Rates in Texas and the Study Area, 1995-2001
Sources: TDH, Bureau of Communicable Disease, Tuberculosis Elimination Division Statistics(Cases by County and Rates by County), online at http://www.tdh.state.tx.us/tb/Stat.htm, accessed August 16, 2002; TSDC, Texas Population Estimates Program, County Estimates, 1994-1999, online at http://txsdc.tamu.edu/tpepp/txpopest.php, accessed August17, 2002; TSDC, Texas Population Projections Program, 2001 Population Projections (Table 2) by County, online at http://txsdc.tamu.edu/tpepp/table2/csv_county.php, accessed August12, 2002.
0.0 5.0 10.0 15.0 20.0 25.0 30.0 1995 1996 1997 1998 1999 2000 2001
Rate (Cases per 100,000)
Border Study Area Texas
Gastrointestinal Diseases
Gastrointestinal diseases, particularly those that are water-borne, are another significant regional health hazard. As seen in Table 3.2, rates of shigellosis (a bacterial infection) and hepatitis A (a viral infection affecting the liver that is often spread by fecally contaminated food or water) are higher in the study area than in Texas as a whole and in the U.S. This was also true in 1994, when shigellosis in the study area was 18.1 and the state was 13.2, and hepatitis A rates were 45 and 15.7 respectively. Hepatitis A rates, often considered a proxy for poor sanitation, were 347 percent higher in the study area as in Texas as a whole in 1999, and 694 percent higher than the U.S.
Rates of salmonellosis, a food-borne infection, were lower in the study area than in Texas and the U.S. in 1994, but in 1999, the rate in the study area was higher. The study area had a rate of 19.9 (per 100,000 population), which was 181 percent higher than Texas, and 134 percent higher than the U.S. rate. Only one case of amebiasis was reported in the study area in 1999 (in Val Verde County), and 37 cases in Texas;2 this disease is not reportable on a national basis so a comparison cannot be made.
In recent years, cholera has been of great concern to officials in the United States and Mexico because of the outbreaks that occurred in Peru in 1991 and then spread to a number of other Latin American countries. The number of cases of cholera has greatly decreased in Mexico since 1995. From a decade-high of 16,430 reported cases in Mexico in 1995, there were 1,088 in 1996, 2,356 in 1997, 71 in 1998, 9 in 1999 and only 5 reported in 2000.3 There were no reported cases of cholera in Texas in 1999, and only six in the entire U.S.4 In 2001, Mexico was taken off of the World Health Organization’s list of cholera epidemic countries.5
The fear was that if cholera were to reach the border regions, the poor sanitary conditions of the colonias would facilitate the spread of the disease. However, even if this were to occur, the colonias are relatively isolated and most Texas and U.S. residents outside the colonias have adequate water and sewage systems, so the spreading of cholera in the U.S. would be unlikely.
Table 3.2
Gastrointestinal Disease Case Rates in the Study Area, Texas, and U.S., 1999
Area Hepatitis A Salmonellosis Shigellosis Cameron Dimmit Hidalgo Kinney Maverick Starr Val Verde Webb Willacy Zapata Zavala Study Area Texas U.S. 56.1 124.4 38 29.9 2.3 16.2 22.6 56.5 15.1 31.1 116.4 43.7 12.6 6.3 14.6 0 20.6 29.9 4.5 17.8 40.7 20.9 80.3 38.9 7.3 19.9 11.0 14.9 23.5 17.8 19.3 59.9 15.8 11.3 20.4 10.4 15.1 0 14.6 18.4 11.4 6.4 Note: Rates are per 100,000 population.
Sources: Texas Department of Health, 1999 Epidemiology Annual Report, Regional Statistical Summaries, online at http://www.tdh.state.tx.us/epidemiology/99annual/frames/frames.htm, accessed August 19, 2002; Centers for Disease Control and Prevention, Summary of Notifiable Diseases, United States, 1999, Table 7, online at http://www.cdc.gov/mmwr/preview/mmwrhtml/mm4853a1.htm, accessed August 19, 2002.
Sexually Transmitted Diseases
In 1999, two cases of syphilis (primary and secondary stages), 309 cases of gonorrhea, and 3,453 cases of Chlamydia were reported in the study area.6 Table 3.3 shows a comparison of case rates (per 100,000 population) for the study area, Texas, and the United States. The study area has lower rates than Texas as a whole for all three of these STDs, and lower rates than the U.S. for gonorrhea and syphilis. The rate of Chlamydia for the study area is higher than the U.S., and Cameron and Willacy Counties are also higher than the state average. Compared to the rates five years earlier, in 1994, gonorrhea rates were very similar (23.8 in the study area and 162.7 in the state), syphilis rates have significantly improved (was 2.6 and 10.5 respectively), and Chlamydia rates have worsened in the study area and state (was 187.3 and 251.8 respectively).7
One possible explanation for the generally lower rates in the study area is that antibiotics are available without a prescription in Mexico, and a number of people may self-treat for STDs. Another explanation could be limited access to laboratory testing. A third is that there is significant underreporting of STDs in the area. However, lower case rates should be looked upon as an opportunity for effective prevention programs to ensure that rates remain low.
Table 3.3
Sexually Transmitted Diseases in the Study Area, Texas, and U.S., 1999
Area Gonorrhea P & S Syphilis Chlamydia Cameron Dimmit Hidalgo Kinney Maverick Starr Val Verde Webb Willacy Zapata Zavala Study Area Texas U.S. 35.7 26.7 21.8 29.9 6.8 8.1 45.3 17.0 50.2 7.8 21.8 24.7 163.4 133.2 0.6 0 0 0 0 0 0 0 0 0 0 0.2 2.3 2.5 334.0 133.3 277.3 149.7 262.0 139.3 271.6 230.5 391.7 303.1 94.6 276.2 312.7 254.1 Note: Rates are per 100,000 population.
Sources: Texas Department of Health, 1999 Epidemiology Annual Report, Regional Statistical Summaries, online at http://www.tdh.state.tx.us/epidemiology/99annual/frames/frames.htm, accessed August 19, 2002; Centers for Disease Control and Prevention, Summary of Notifiable Diseases, United States, 1999, Table 7, online at http://www.cdc.gov/mmwr/preview/mmwrhtml/mm4853a1.htm, accessed August 19, 2002.
Figure 3.2 shows case rates (per 100,000 population) for primary and secondary syphilis and gonorrhea in Texas and in the study area from 1995-1999.
Figure 3.2
Syphilis and Gonorrhea Case Rates in the Study Area and Texas, 1995-1999
Sources: Texas Department of Health, 1997, 1998, and 1999 Epidemiology Annual Reports, online at
http://www.tdh.state.tx.us/epidemiology/annrepts.htm, accessed August 19, 2002; Texas Department of Health,
1995 Epidemiology Annual Report (Austin, Texas, 1997), pp. 151, 165; Texas Department of Health, 1996 Epidemiology Annual Report (Austin, Texas, 1998), pp. 133, 147.
Vaccine-Preventable Diseases
The study area reported no cases of measles in 1999. Of the seven reported measles cases in Texas in 1999, none were along the Texas/Mexico border, and only one was somewhat near, in Medina County in South Texas. (In 1994, there were 17 cases in Texas and none in the study area.) There were four cases of mumps in the study area in 1999, compared to 35 cases statewide, which is about the same rate for the study area vs. the state.8 These rates have significantly improved in the last five years; in 1994, there were 28 mumps cases in the study area and 234 statewide.9
The case rates for pertussis or “whooping cough,” a highly contagious upper-respiratory illness, were higher in two study area counties than in the state as a whole in 1999. (Texas had 152 cases, for a rate of 0.8.) There were six cases reported in the study area in 1999: Val Verde had one (2.3 rate), Cameron had three (0.9 rate), and Hidalgo had two (0.4 rate). Even though the rates were higher than the state for Val Verde and Cameron, these two counties only had four cases total.10 These numbers were similar in 1994, when Texas reported 160 cases and 12 were
-20 40 60 80 100 120 140 160 180 1995 1996 1997 1998 1999 Rate (Cases/100,000)
Syphilis- Study Area Syphilis- Texas
Gonorrhea- Study Area Gonorrhea- Texas
reported in the study area.11 In 1999, Texas had nine reported cases of rubella; two of these occurred in the study area, both in Cameron County.12 Nine cases of rubella were also reported in 1994, with three in the study area (in Cameron and Hidalgo Counties).13
The low numbers reported make it difficult to report reliable statistical comparisons of vaccine-preventable diseases between the region and the state. However, one must keep in mind that since many border residents have no regular source of medical care, their illnesses are more likely to go unreported.
Dengue Fever
Dengue fever is a mosquito-transmitted viral disease producing high fever, joint and muscle pain, severe headaches, nausea, vomiting, and a rash. (This is the “classic” form of the disease; there is also a rare and fatal form called dengue hemorrhagic fever.) Dengue is found primarily in tropical and subtropical areas of the world, and there is no vaccine for prevention. Virtually nonexistent throughout the United States, dengue has been occurring along the Texas/Mexico border, with periodic outbreaks of classic dengue and few cases in between. A large outbreak occurred in Texas in 1999, with 66 total cases reported (62 associated with the outbreak),
compared to only six total cases in 1998. In this outbreak, 32 of the cases were in Webb County, and 20 more were in other counties in the study area (Cameron, Hidalgo, Starr, and Willacy). A majority of dengue fever cases are a result of travel to other countries, though it has become established along the border as well, since 27 percent of the people with dengue in Texas in 1999 acquired it from living in or traveling through one of these five border counties and had not traveled abroad.14 There were only five cases reported in Texas in 1996.15
There are many more cases of dengue fever on the Mexican side of the Texas/Mexico border. Through week 35 of 1999, the Tamaulipas State Department of Health in Mexico reported 31 confirmed cases and 424 unconfirmed cases of dengue fever in three cities bordering Texas: Reynosa, Matamoros, and Nuevo Laredo. In 1998, there were 1,108 cases reported in these three border communities.16
HIV/AIDS
Texas ranked fourth in the U.S. after California, Florida, and New York for the number of new AIDS cases reported in 1999 (3,181).17 Compared to the state and relative to other diseases such as tuberculosis, the study area does not have a disproportionately high number of AIDS cases. However, the transient nature of the border population combined with the social stigma of the disease may cause significant underreporting.
Table 3.4 shows the cumulative cases of HIV (that have not progressed to AIDS) and AIDS through December 2001 in the study area, Texas, and U.S.; this is total cases, including people who have since died. (For comparison, the combined figures through June 1996 for these three areas were 614, 37,969, and 461,386 respectively.)18 The study area accounts for only 2.2 percent of the HIV/AIDS cases in the state (while having about 6.3 percent of the population). However, certain trends within the state are sources of concern for the border population. State figures show that reported cases are decreasing in the white male population while they are increasing among minority populations, especially in women. In 1994, 15.7 percent of reported
new AIDS cases were among Hispanic men and 2.3 percent were Hispanic women. In 2001, these percentages rose to 30 percent for Hispanic men and 20 percent for Hispanic women. The total number of new cases of full-blown AIDS reported in 2001 in Texas was 2,981 (2,334 males and 647 females).19
Table 3.4
Cumulative Cases of HIV/AIDS through end of 2001 in
the Study Area, Texas, and U.S.
Cameron Dimmit Hidalgo Kinney Maverick Starr Val Verde 462 6 594 3 46 27 22 Webb Willacy Zapata Zavala Study Area Texas United States 300 23 5 6 1,494 68,327 774,467 (through end of 2000) Sources: Texas Department of Health, HIV/STD Epidemiology Division, Texas HIV/STD Surveillance Report, Annual Report 2001, online at http://www.tdh.state.tx.us/hivstd/stats/pdf/surv01_4.pdf, accessed August 21, 2002; Centers for Disease Control and Prevention, HIV/AIDS Surveillance: General Epidemiology, L178 slide series (through 2000), online at http://www.cdc.gov/hiv/graphics/surveill.htm, accessed August 21, 2002.
Communicable Diseases in Mexico
The data available from the study area show that Mexico is dealing with many of the same communicable diseases as the U.S. side of the border. Unspecified intestinal disease is a major concern, with a total of 97,313 cases reported in Tamaulipas in 2001.20 Tuberculosis and hepatitis are also significant concerns on the Mexican side. The rate per 100,000 for TB was 38.0 in Tamaulipas and 16.6 in Coahuila in 2000.21 In 1995, the Mexican government adopted the DOTS strategy (Directly Observed Treatment, Short-term) for TB treatment, which has been shown to be the most effective treatment in other countries, and use of this method is spreading each year.22 It is expected that surveillance for drug-resistant TB in Mexico will be completed by the end of 2002; studies in three Mexican states in 1997 showed primary resistance to all TB drugs at 14.1 percent.23 Coordination, reporting, and laboratory networks for TB have all been enhanced in Mexico in the last few years, though there is still room for improvement.
Very high vaccination rates in Mexico (due to the Universal Vaccination Program established in 1990) help combat vaccine-preventable diseases such as measles, a disease which is also
declining in Texas. There were no new cases of measles reported in Mexico in 2001.24 (Only seven cases were reported in Texas in 1999, with none reported in 1998, down from 49 reported in 1996 due to an outbreak in Harris County.25)
Other diseases such as typhoid fever, which is virtually nonexistent in the U.S., continue to be a problem in Mexico. In 2001, Tamaulipas reported 916 cases of typhoid and Coahuila reported 686 cases,26 compared with 23 cases in Texas in 1999.27
Maternal and Child Health
As shown in Figure 3.3, the crude birth rate of 26.3 per 1,000 population in the study area in 2000 is significantly higher than the Texas or U.S. rates. A high crude birth rate indicates a heavier than average demand for health care services. Each of these birth rates has been decreasing for several years: the rate for the study area in 2000 was 26.3, compared to 31.7 in 1994; the rate for Texas was 17.9 in 2000, compared to 18.9 in 1994; and the rate for the U.S. was 14.7 in 2000, compared to 15.6 in 1993. The crude birth rate in Mexico has also been decreasing: it was estimated to be 20.5 for Mexico as a whole in 2002 (19.4 in Coahuila and 18.4 in Tamaulipas),28 compared to 33.1 for Mexico in 1995.29
Figure 3.3
Crude Birth Rates in the Study Area, Texas, and U.S., 2000
Sources: Texas Department of Health, Bureau of Vital Statistics, Texas Vital Statistics 2000 Annual Report, Tables 9 and 45, online at http://www.tdh.state.tx.us/bvs/stats00/contents.htm, accessed August 21, 2002; Centers for Disease Control and Prevention, “Births: Final Data for 2000,” National Vital Statistics Report, online at http://www.cdc.gov/nchs/data/nvsr/nvsr50/nvsr50_05.pdf, accessed August 21, 2002.
Figure 3.4 compares the percentage of women who receive prenatal care in their first trimester with the percentages of low birth-weight babies (less than 2,500 grams). Interestingly, there is not always an inverse correlation between the two in this data. In fact, certain counties such as Kinney and Zavala that have higher percentages of low birth-weight babies also have relatively higher rates of first-trimester care. As a whole, the study area has a slightly lower percentage of low-weight babies (6.5) and a lower rate of first-trimester care (65 percent) than Texas (7.4 and 78.8 percent) and the United States (7.6 and 83.2). Note that incidence of prenatal care is often- 5.0 10.0 15.0 20.0 25.0 30.0
Study Area
Texas
U.S.
reported by women when they give birth instead of their doctors, so some of this care could have occurred on the Mexican side of the border.
Figure 3.4
Percentage of Low Birth-Weight Babies Compared to Percentage of Women
Receiving Prenatal Care in First Trimester, 2000
Sources: Texas Department of Health, Bureau of Vital Statistics, Texas Vital Statistics 2000 Annual Report, Tables 10, 12, and 45, online at http://www.tdh.state.tx.us/bvs/stats00/contents.htm, accessed August 21, 2002; Centers for Disease Control and Prevention, “Births: Final Data for 2000,” National Vital Statistics Report, online at
http://www.cdc.gov/nchs/data/nvsr/nvsr50/nvsr50_05.pdf, accessed August 21, 2002.
Adequate prenatal care continues to be a problem in the study area. Figure 3.5 shows the percent of women receiving adequate prenatal care according to the Kessner Index rating in each of the counties of the study area and in the state (the U.S. government uses a different system for measuring adequacy of prenatal care). The Kessner Index rates adequacy on the basis of when the trimester began, how many visits were made, and the length of gestation. Most of the rates for the counties of the study area are lower than the state rate of 70.7 (horizontal line on the graph), though much improvement has been made in the last five years—Dimmit, Kinney, and Zavala are actually higher than the state rate, and four other counties are in the 60 to 70 percent range.
In examining maternal and child health, it is important to observe the health conditions of very young children after the immediate post-partum period. Revealing indicators are the proportions
0 2 4 6 8 10 12 14
Cameron DimmitHidalgoKinneyMaverick Starr
Val Verde WebbWillacy Zapata ZavalaStudy Area
Texas U.S. 0 10 20 30 40 50 60 70 80 90 100
Percent Low Birth-Weight Babies (<2,500 grams) Percent Mothers Receiving Prenatal Care in 1st Trimester
of infants failing to thrive, of those diagnosed with vitamin deficiencies, and of those experiencing developmental delays due to malnutrition and other health and socioeconomic factors. Little hard data is available, but officials believe that the health of young children is a serious challenge for the region. Major problems are low rates of breastfeeding and poor quality diets.
Figure 3.5
Percent of Women in the Study Area and Texas Receiving Adequate
Prenatal Care Based on the Kessner Index, 2000
Source: Texas Department of Health, Bureau of Vital Statistics, Texas Vital Statistics 2000 Annual Report, Tables 9 and 13, online at http://www.tdh.state.tx.us/bvs/stats00/contents.htm, accessed August 22, 2002.
Oral Health
Routine and preventive dental care is important for maintaining not just oral health, but health in general. Early intervention prevents dental problems from becoming chronic and irreversible, and affecting overall health. Most experts recommend a routine teeth cleaning every six months and a more thorough oral exam annually. In 1999, 61.4 percent of Texans had seen a dentist in the past year, while the nationwide average was 68.1 percent. This percentage was lower for the Hispanic population in Texas, at 50 percent.30 Many people without dental insurance in Texas take advantage of the fact that dental care is cheaper on the Mexican side of the border and cross to receive services, but it appears that many more are not receiving any dental services on a routine basis. 53.2 84.0 58.1 81.1 70.4 59.4 69.5 47.9 72.8 58.8 70.7 65.4 64.1 0 10 20 30 40 50 60 70 80 90 100
Cameron Dimmit Hidalgo Kinney Maverick
Starr
Val Verde
Webb Willacy Zapata Zavala
Study Area
Preventive dental care is especially important for children, and Texas Health Steps administers a dental screening program for Medicaid-eligible children ages 1-20 in the state. In state fiscal year 2000, 258,173 children in the study area were eligible for the program, but only 52 percent of these were actually served (received at least one dental health service from Texas Health Steps during the year).31 The study area is underserved in the number of dentists available (as detailed in Chapter 4), but it appears that another need is to publicize the programs that already exist such as Texas Health Steps.
Chronic Disease
Another health care burden borne disproportionally by the population of the study area relative to the rest of the state is that of chronic disease in adults below 65 who are not eligible for Medicaid or Medicare until they become totally disabled.
One of these chronic diseases that is disproportionately high along the border is diabetes. An estimated 8 percent of the people age 18 and over in the study area were living with diagnosed diabetes (Type 1 or Type 2) in 2001, compared to 6.2 percent for Texas as a whole (many more cases are suspected to be undiagnosed; figures are not available for people under 18). The percent of diagnosed diabetes in every county in the study area was higher than that for Texas (see Table 3.5). Type 2 diabetes is more prevalent in Native Americans, Hispanics, African Americans, and Asians than in non-Hispanic whites,32 which partially explains these figures, due to the study area’s high proportion of Hispanics. Mortality rates for diabetes have also increased in the past decade, taking a heavy toll on Hispanics and other minorities.33
Table 3.5
Estimates of the Number and Percent of People with Diagnosed Diabetes
in the Study Area and Texas, 2001
Area Cases of Diagnosed Diabetes Population 18 and over Percent of Pop. 18 and over Cameron Dimmit Hidalgo Kinney Maverick Starr Val Verde Webb Willacy Zapata Zavala Study Area Texas 17,531 538 29,618 177 2,422 2,763 2,334 10,141 1,095 638 615 67,872 1,055,002 227,856 6,949 380,255 2,527 30,466 34,399 30,962 127,489 13,989 8,296 7,784 870,972 15,242,510 7.7% 7.7% 7.8% 7.0% 7.9% 8.0% 7.5% 8.0% 7.8% 7.7% 7.9% 8.0% 6.2%
Source: Texas Department of Health, Diabetes Prevalence in Texas, 2001 (estimates using the Texas Behavioral Risk Factor Surveillance System), online at http://www.tdh.state.tx.us/diabetes/data/county.pdf, accessed August 26, 2002.
One study estimated that the economic cost of diabetes in Texas in 1992 was in excess of $4 billion. Of this, indirect costs (lost wages due to short-term illness, long-term disability, and premature mortality) amounted to $2.4 billion. Direct costs (treatment costs) were estimated at $1.6 billion. Of particular interest is the fact that, while Medicare paid $659 million in medical costs attributable to diabetes, Medicaid only covered about $70 million of such care for non-Medicare patients.34 The direct and indirect costs of diabetes in Texas in 1997 were estimated to be $9 billion.35
Type 1 diabetes is thought to be the result of an autoimmune disorder that gradually kills the insulin-producing cells of the pancreas; it accounts for only 5 to 10 percent of diabetes cases, usually appears during childhood or adolescence, and can often be controlled by taking insulin or other drugs. Diabetes Mellitus, or Type 2 diabetes, is the most prevalent type and is associated with a high-fat, low-fiber diet and being overweight and physically inactive. It usually strikes after age 45; however, in a troubling trend, an increasing number of children and young adults nationwide are developing Type 2 diabetes as more people in these age groups are becoming overweight and obese. The Texas Department of Health helped host an international conference on this phenomena in 1999 and after that developed the first statewide action plan on Type 2 diabetes in children and adolescents, which outlines steps to address this emerging problem.36 Type 2 diabetes can lead to devastating and costly complications such as blindness, kidney failure, strokes, and need for limb amputations; however, almost all complications could be prevented by early detection, improved care, and lifestyle changes such as exercise and healthier diets. It is ironic that funds for medical care in many cases only become available when the preventable or delayable complications of the illness happen and prevent the individual from working.
Many organizations in Texas have recognized the growing problem of diabetes and are developing more programs to address it. The Texas Department of Health is involved in a variety of diabetes programs including the Diabetic Eye Disease Program to provide free eye screenings to uninsured people, a statewide action plan developed by collaboration to address the growing problem of pediatric diabetes, and providing financial and technical support to local organizations addressing diabetes prevention. TDH also collaborates with several federal agencies and the Texas Community Health Care Association in the Diabetes Learning Collaborative, which among other activities has implemented the Capacity/Infrastructure Development (CID) program. This program aims to “improve the health status of minorities in Texas and to establish the capacity and infrastructure to develop, promote, and disseminate breakthrough changes in public primary care systems for diabetes care.”37
Another program, the Texas Diabetes Prevention and Control Initiative, is a collaboration of the Texas Diabetes Council and Bristol-Myers Squibb, and its goal is to “increase awareness of the importance of prevention, diagnosis and proper management of Type 2 diabetes among Texas residents through diabetes prevention activities, early diagnosis and referrals for treatment, and an awareness campaign.”38 It is estimated that more than 1 million people will benefit from this program. The initiative has three pilot screening sites, two of which are along the border: the sites are in Harlingen, El Paso, and Houston.39
Notes
1 Texas Department of Health, Bureau of Communicable Disease, Incidence of Drug-Resistant TB Cases by County,
Texas, 1995-2001, online at http://www.tdh.state.tx.us/tb/DRTBbyCounty.htm, accessed August 19, 2002.
2 Texas Department of Health, 1999 Epidemiology Annual Report, Regional Statistical Summaries, online at
http://www.tdh.state.tx.us/epidemiology/99annual/frames/frames.htm, accessed August 19, 2002.
3 Pan American Health Organization, Table 1: Number of Cholera Cases in the Americas (1991-2001, by Country
and Year), online at http://www.paho.org/English/HCP/HCT/EER/cholera-cases-deaths-91-01.htm#table1, accessed August 21, 2002.
4 Centers for Disease Control and Prevention, Summary of Notifiable Diseases, United States, 1999, online at
http://www.cdc.gov/mmwr/preview/mmwrhtml/mm4853a1.htm, accessed August 19, 2002.
5 U.S.-Mexico Border Health Commission, WHO Removes Mexico from Cholera Epidemic List, online at
http://www.borderhealth.gov/Events/Mexico-WHO/mexico-who.html, accessed September 19, 2002.
6 Texas Department of Health, 1999 Epidemiology Annual Report, Regional Statistical Summaries, online at
http://www.tdh.state.tx.us/epidemiology/99annual/frames/frames.htm, accessed August 19, 2002.
7 David C. Warner and Jillian Hopewell, NAFTA and the U.S./Mexico Border Health: The Impact on
HRSA-Sponsored Programs, Report Prepared for HRSA (San Antonio, Tex.: Center for Health Economics and Policy, The University of Texas Health Science Center at San Antonio, October 1999), p. 11.
8 Texas Department of Health, 1999 Epidemiology Annual Report, Regional Statistical Summaries, online at
http://www.tdh.state.tx.us/epidemiology/99annual/frames/frames.htm, accessed August 19, 2002.
9 Texas Department of Health, 1994 Epidemiology Annual Report (Austin, Texas, 1996), pp. 146, 160.
10 Texas Department of Health, 1999 Epidemiology Annual Report, Regional Statistical Summaries, online at
http://www.tdh.state.tx.us/epidemiology/99annual/frames/frames.htm, accessed August 19, 2002.
11 Texas Department of Health, 1994 Epidemiology Annual Report (Austin, Texas, 1996), pp. 146, 160.
12 Texas Department of Health, 1999 Epidemiology Annual Report, Regional Statistical Summaries, online at
http://www.tdh.state.tx.us/epidemiology/99annual/frames/frames.htm, accessed August 19, 2002.
13 Texas Department of Health, 1994 Epidemiology Annual Report (Austin, Texas, 1996), pp. 146, 160.
14 Texas Department of Health, 1999 Epidemiology Annual Report, Regional Statistical Summaries, online at
15 David C. Warner and Jillian Hopewell, NAFTA and the U.S./Mexico Border Health: The Impact on
HRSA-Sponsored Programs, Report Prepared for HRSA (San Antonio, Tex.: Center for Health Economics and Policy, The University of Texas Health Science Center at San Antonio, October 1999), p. 12.
16 Pan American Health Organization, Dengue in three border cities in Tamaulipas, Mexico, online at
http://www.fep.paho.org/denguebul/english/section3_2.htm, accessed August 21, 2002.
17 Centers for Disease Control and Prevention, Summary of Notifiable Diseases, United States, 1999, online at
http://www.cdc.gov/mmwr/preview/mmwrhtml/mm4853a1.htm, accessed August 19, 2002.
18 David C. Warner and Jillian Hopewell, NAFTA and the U.S./Mexico Border Health: The Impact on
HRSA-Sponsored Programs, Report Prepared for HRSA (San Antonio, Tex.: Center for Health Economics and Policy, The University of Texas Health Science Center at San Antonio, October 1999), p. 13.
19 Texas Department of Health, HIV/STD Epidemiology Division, Texas HIV/STD Surveillance Report, Annual
Report 2001, online at http://www.tdh.state.tx.us/hivstd/stats/pdf/surv01_4.pdf, accessed August 21, 2002.
20 Secretaría de Salud de Tamaulipas, Principales Causas de Enfermadades, online at
http://salud.tamaulipas.gob.mx/estadisticas/enfermedades.htm, accessed September 11, 2002.
21 Texas Department of Health, Health Disparities in Texas: An Epidemiologic Review of Priority Health Outcomes,
March 2002, online at http://www.tdh.state.tx.us/minority/pubs/Disp_all.PDF, accessed September 10, 2002.
22 Pan American Health Organization, Report of the Regional Evaluation Meeting of National TB Control Programs,
online at http://www.paho.org/English/HCP/HCT/TUB/tb-regional-eval-mtg-2000.PDF, accessed September 11, 2002.
23 Pan American Health Organization, Report of the Regional Evaluation Meeting of National TB Control Programs,
online at http://www.paho.org/English/HCP/HCT/TUB/tb-regional-eval-mtg-2000.PDF, accessed September 11, 2002.
24 Secretaría de Salud de México, Distribución de Casos Nuevos de Enfermedades por Grupo de Edad, Estados
Unidos Méxicanos, 2001, online at http://www.epi.org.mx/anuarios/p.pdf, accessed September 14, 2002. Note: “Measles” in Spanish is “sarampión.”
25 Texas Department of Health, 1999 Epidemiology Annual Report, Regional Statistical Summaries, online at
http://www.tdh.state.tx.us/epidemiology/99annual/frames/frames.htm, accessed August 20, 2002.
26 Secretaría de Salud de México, Dirreción General de Epidemiología, Estadísticas en Salud, Boletín
Epidemiológico, Vigilancia Epidemiológica Semana 52-2001, Cuadro 4, online at http://www.epi.org.mx, accessed September 11, 2002.
27 Texas Department of Health, 1999 Epidemiology Annual Report, Regional Statistical Summaries, online at
28 Secretaría de Salud de México, Tasa Bruta de Natalidad por Entidad Federative, 2002, online at
http://www.ssa.gob.mx, accessed September 24, 2002.
29 Calculated from birth and population data from: Instituto Nacional de Estadística, Geografía e Informática
(INEGI), Anuario de Estadísticas por Entidad Federativa, Aspectos Demográficos, 1995-1998, online at http://tamps.inegi.gob.mx/tamaulipas/difusion/espanol/bvinegi/aef/apsdemo.pdf, accessed November 6, 2002.
30 Texas Department of Health, The Health of Texans (Austin, Texas, 2002), pp. 96-97.
31 Texas Department of Health, Associateship for Family Health, Texas Health Steps Dental Statewideness Report
for Service Utilization, SFY 2000, online at http://www.tdh.state.tx.us/dental/StateW_2000.pdf, accessed September 12, 2002.
32 Texas Department of Health, Health Disparities in Texas: An Epidemiologic Review of Priority Health Outcomes,
March 2002, online at http://www.tdh.state.tx.us/minority/pubs/Disp_all.PDF, accessed September 10, 2002.
33 Texas Department of Health, The Health of Texans (Austin, Texas, 2002), p. 42.
34 Warner, David C., Roy R. McCandless, Louis A. De Nino, John E. Cornell, Jacqueline A. Pugh, and Genevieve
M. Marsh, “Cost of Diabetes in Texas, 1992,” Diabetes Care, vol. 19 (December 1992), pp. 1416-1419.
35 Texas Department of Health, Health Disparities in Texas: An Epidemiologic Review of Priority Health Outcomes,
March 2002, online at http://www.tdh.state.tx.us/minority/pubs/Disp_all.PDF, accessed September 10, 2002.
36 Texas Department of Health, Texas Diabetes Council, Type 2 Diabetes in Children and Adolescents Statewide
Action Plan, online at http://www.tdh.state.tx.us/diabetes/t2child/Statewide%20Action1.pdf, accessed November 19, 2002.
37 Texas Department of Health, Health Disparities in Texas: An Epidemiologic Review of Priority Health Outcomes,
March 2002, online at http://www.tdh.state.tx.us/minority/pubs/Disp_all.PDF, accessed September 10, 2002.
38 Texas Department of Health, Texas Diabetes Council, Diabetes Prevention and Control Initiative, online at
http://www.tdh.state.tx.us/diabetes/bms/index.html, accessed September 10, 2002.
39 Texas Department of Health, Texas Diabetes Council, Diabetes Prevention and Control Initiative, online at
Chapter 4. Health Resources
Border Public Health Systems
Border public health is driven by complex systems of federal, state, local, private, and binational components. The public health system in Texas is decentralized. The Texas Department of Health (TDH), the state’s health agency located in Austin, is responsible for coordinating funding and programs in 11 public health regions (PHRs).
The counties contained in the study area are part of TDH public health regions 8 and 11. Among them, Cameron and Hidalgo have independent “full-service” county health departments and Webb has an independent full-service city health department in Laredo. (These local health departments receive state and federal funding through TDH as well as local funding.)1 County health departments in Val Verde and Zavala have closed in the last several years. There are also three “non-participating” local health departments in the study area (meaning that they do not receive funds from TDH): these are the City of Brownsville Health Department and the City of Harlingen Health Department (both in Cameron County), and the City of McAllen Health Department in Hidalgo County.2 These three departments provide environmental and public health services, but do not provide direct medical services to individuals. Table 4.1 outlines local public health services available in the study area.
There is also a regional TDH office in the study area (for PHR 11), located in Harlingen, Cameron County. The remaining counties without LHDs are served by the regional offices of PHRs 8 and 11 and clinics operated by TDH.
In the border region, the U.S. public health system is greatly affected by Mexico. Many border residents seek medical care in both countries because of differences in cost, quality, and/or accessibility. The health system prevailing on the other side of the border is described here. The Mexican health care system consists of three sectors: social security including the Instituto Mexicano del Seguro Social (IMSS) and the Instituto de Seguridad y Servicios Sociales para los Trabajadores del Estado (ISSSTE); the Secretaria de Salud y Asistencia (SSA); and the private sector.
IMSS, ISSSTE, and a few other specialized social security programs provide health care services to employed Mexicans. The SSA system administers indigent care. The private sector, a
growing part of the Mexican health care system, serves people at all socioeconomic levels, and many physicians in Mexico combine work in public clinics and hospitals with private practice. Because private medical care in Mexico is, for the most part, significantly less expensive than in the U.S., this sector also serves low-income border populations.