Original research
Mapping cardiac microstructure of rabbit heart in different
mechanical states by high resolution diffusion tensor imaging: A
proof-of-principle study
Irvin Teh
a, Rebecca A.B. Burton
b, Darryl McClymont
a, Rebecca A. Capel
b, Daniel Aston
b,
Peter Kohl
c,d, Jürgen E. Schneider
a,*aDivision of Cardiovascular Medicine, Radcliffe Department of Medicine, University of Oxford, Oxford, United Kingdom bDepartment of Pharmacology, University of Oxford, Oxford, United Kingdom
cNational Heart and Lung Institute, Imperial College London, London, United Kingdom
dInstitute for Experimental Cardiovascular Medicine, University Heart Centre Freiburg - Bad Krozingen, Medical School of the University of Freiburg,
Germany
a r t i c l e i n f o
Article history:
Received 9 February 2016 Accepted 13 June 2016 Available online 16 June 2016
Keywords:
Rabbit heart
Myocardial tissue characterisation Diffusion tensor imaging Tractography
Diastole Systole
a b s t r a c t
Myocardial microstructure and its macroscopic materialisation are fundamental to the function of the heart. Despite this importance, characterisation of cellular features at the organ level remains chal-lenging, and a unifying description of the structure of the heart is still outstanding. Here, we optimised diffusion tensor imaging data to acquire high quality data in ex vivorabbit hearts in slack and con-tractured states, approximating diastolic and systolic conditions. The data were analysed with a suite of methods that focused on different aspects of the myocardium. In the slack heart, we observed a similar transmural gradient in helix angle of the primary eigenvector of up to 23.6/mm in the left ventricle and 24.2/mm in the right ventricle. In the contractured heart, the same transmural gradient remained largely linear, but was offset by up toþ49.9in the left ventricle. In the right ventricle, there was an increase in the transmural gradient to 31.2/mm and an offset of up toþ39.0. The application of trac-tography based on each eigenvector enabled visualisation of streamlines that depict cardiomyocyte and sheetlet organisation over large distances. We observed multiple V- and N-shaped sheetlet arrangements throughout the myocardium, and insertion of sheetlets at the intersection of the left and right ventricle. This study integrates several complementary techniques to visualise and quantify the heart’s micro-structure, projecting parameter representations across different length scales. This represents a step towards a more comprehensive characterisation of myocardial microstructure at the whole organ level. ©2016 The Authors. Published by Elsevier Ltd. This is an open access article under the CC BY license (http://creativecommons.org/licenses/by/4.0/).
1. Introduction
The heart’s pump function depends on cardiomyocyte activity. These cells occupy the majority of the ventricular volume, and are organised in a highly structured three-dimensional (3D) pattern (Kohl, 2003). The two perhaps most prominent macroscopic de-scriptors are (i) locally prevailing cardiomyocyte orientation, often referred to as ‘fibre orientation’ (Holmes et al., 2000), and (ii) laminar structures of laterally interconnected myocyte layers known as ’sheetlets’(Hales et al., 2012; Sands et al., 2005). The
organisation and precise distribution of cardiac cells play important roles in the complex electromechanical properties in the heart (Katz and Katz, 1989). During systole, a combination of diomyocyte contraction and shear between layers of car-diomyocytes leads to longitudinal shortening of the ventricle in the form of an atrio-ventricular valve plane shift, radial thickening of the ventricle wall predominantly in a centripetal direction, and torsion of the ventricles by apical rotation relative to the base of the heart (Axel et al., 2014). The 3D organisation offibres and sheetlets has been shown to influence both mechanical contraction (Waldman et al., 1988) and electrical propagation (Kanai and Salama, 1995) in the heart, and has been implicated in ventricular hypertrophy (Ferreira et al., 2014; McGill et al., 2012; Tseng et al., 2006), infarct remodelling (Wickline et al., 1992) and arrhythmia (Chen et al., 1993). Accurate characterisation of the myocardial *Corresponding author. Wellcome Trust Centre for Human Genetics (CVMed),
Roosevelt Drive, Oxford, OX3 7BN, United Kingdom.
E-mail address:[email protected](J.E. Schneider).
Contents lists available atScienceDirect
Progress in Biophysics and Molecular Biology
j o u r n a l h o m e p a g e : w w w . e l s e v i e r . c o m/ l o c a t e / p b i o m o l b io
http://dx.doi.org/10.1016/j.pbiomolbio.2016.06.001
with tissue distortion and disruption during sample preparation, limited spatial coverage, and non-trivial challenges during recon-struction of whole heart two-dimensional (2D) data stacks into 3D volumes (Burton et al., 2014; Plank et al., 2009).
Other tissue imaging methods are available. These include anatomical magnetic resonance imaging (MRI) (Bernus et al., 2015; Burton et al., 2006) and X-ray computed tomography (Ni et al., 2013), with excellent sample coverage suitable for whole organ studies, but at a resolution in the 105m region, they do not yet resolve cellular features. Polarised light imaging also offers good coverage, but resolution is limited to the 105m range, andfibre orientation estimates are sensitive to the elevation angle of the cells (Jouk et al., 2007). Scanning electron microscopy (LeGrice et al., 1995) and confocal microscopy (Young et al., 1998), in contrast, provide the highest resolution of 109m and better, but are limited infield-of-view.
Diffusion tensor imaging (DTI) (Basser et al., 1994) enables 3D structural mapping of whole hearts. While the imaging resolution is on the order of 104m, the technique is sensitive to the micro-scopic diffusion of water in the 106m range, and its interactions with the cellular environment. This facilitates assessment of the 3D arrangement of cardiac fibres and sheetlets (Helm et al., 2005; Scollan et al., 1998). In DTI, the diffusion of water is modelled as a 3D tensor. The lengths and orientations of the three mutually orthogonal major axes (longest, intermediate and shortest) of this tensor are described respectively by its eigenvalues and eigenvec-tors. The primary, secondary and tertiary eigenvectors (v1,v2,v3) are understood to correspond to the fibre long-axis, the fi bre-normal/in-sheet and the sheetlet-normal directions respectively, of cells in myocardial laminae (Helm et al., 2005; Scollan et al., 1998), as validated by histology (Holmes et al., 2000; Hsu et al., 1998; Kung et al., 2011; Scollan et al., 1998).
Several studies have utilised DTI to quantitatively investigate rabbit heart structure. Early work characterisedfibre and sheetlet orientations in healthy rabbit hearts, and linkedv3to the orien-tation of the ventricular sheetlets (Scollan et al., 2000). Rabbit hearts have also been used in important histological validation studies of DTI, which clarified the correspondence of the diffusion signal to the underlying microstructure (Holmes et al., 2000; Scollan et al., 1998). In these studies, 2D fast spin echo DTI data were acquired at an imaging resolution of 1563122000
m
m. More recent work investigated how well thefibre orientation is conserved across species in mice, rabbit and sheep (Healy et al., 2011). Using a 3D spin echo acquisition at 250m
m isotropic res-olution, the study focused only on the helix angle ofv1in the left ventricle.Improvements in magnet and gradient system hardware, as well as data acquisition protocols, now allow one to acquire high quality DTI data at comparatively high isotropic resolution in the isolated
fixed heart. Here, we combine a state-of-the-art preclinical MRI system with optimised 3D spin echo DTI acquisition to improve the signal-to-noise ratio, supporting an isotropic imaging resolution of 200
m
m inex vivorabbit hearts. Bothv1andv3are assessed and2.1. Sample preparation
All experiments were conducted in accordance with the Ani-mals (Scientific Procedures) Act 1986 (UK). Hearts were isolated from two male New Zealand White rabbits after induction of terminal anaesthesia (pentobarbitone under Schedule 1 protocol). Isolated hearts were swiftly cannulated and perfused in constant pressure Langendorff mode for 5 min with normal physiological saline (in mM: NaCl 125, NaHCO325, KCl 5.4, NaH2PO41.2, MgCl21, Glucose 5.5, CaCl21.8, pH to 7.4 with NaOH and oxygenated with 95% O2/5% CO2) containing heparin (5 IU/mL). Thefirst heart was arrested using physiological saline with elevated potassium (20 mM KCl) to induce diastolic arrest, while the second heart was exposed to lithium-replacement of sodium to induce contracture (in mM: LiCl 125, KCl 5, MgCl21, HEPES 10, Glucose 11, CaCl22.5, pH 7.4) (Burton et al., 2006). Hearts were then perfused via the aorta with isosmotic Karnovsky’s fixative (300± 10 mOsm, Sol-media UK) while immersed infixative to avoid ingress of air into cardiac chambers. Following a fixation period of 4 days, hearts were placed infixative containing 2 mM gadolinium (Gd) complex Prohance (Bracco, MN, USA). Prior to imaging, the hearts were washed in PBSþ2 mM Gd, and embedded in 1% low melting point agarose gel made from PBSþ2 mM Gd.
2.2. Data acquisition
Non-selective 3D spin echo DTI data were acquired on a 9.4 T preclinical MRI scanner (Agilent, CA, USA) with a shielded gradient system (max gradient strength¼1 T/m, rise time¼130
m
s), and transmit/receive quadrature coil (inner diameter¼42 mm; Rapid Biomedical, Rimpar, Germany). Acquisition parameters were: repetition time ¼ 250 m, echo time ¼ 10 m, fi eld-of-view¼43.228.828.8 mm, matrix size¼216144144, resolution ¼ 200 200 200m
m, number of non-diffusion-weighted (DW) images¼3, number of DW directions¼12 (Cook et al., 2007), diffusion duration (d
) ¼ 2 m, diffusion time (D
)¼5.5 m, b-value¼1000 s/mm2, acquisition time¼21:36 h. Based on these diffusion times and assuming unrestricted diffusion, the root mean squared displacement in tissue with apparent dif-fusivities ranging from 1.0e1.5103mm2/s would have ranged from 3.1 to 3.8m
m (Latt et al., 2007). Sample temperature varia-tions, arising from warming of the gradient coils during the appli-cation of diffusion gradients, were minimised by interleaving DW and non-DW scans. The receiver gain was increased by 10 dB during the DW scans to increase the signal-to-noise ratio, while remaining within the dynamic range of the receiver. The amplified DW signals as a result of the higher gain were normalised by separate non-localised gradient echo data acquired at the respective receiver gains. The gradient system was calibrated prior to the experiment to minimise directional bias in the diffusion measurements (Teh et al., 2016).2.3. Data analysis
3D tensors werefitted to the DTI data using non-linear least squares. Manual segmentation of the LV and RV myocardium was performed based on reconstructed fractional anisotropy (FA) maps (Pierpaoli and Basser, 1996). The DTI data were then registered as follows: centroids of the LV cavity in each axial slice were detected automatically and a line, defining the long axis, was fit to the centroids. The DTI data were aligned to the long-axis, and the LV-RV intersections at the anterior and posterior walls in a mid-myocardial short-axis slice were manually specified. The inter-connecting line between the two points was defined as the anterior-posterior direction. The DTI data were then rotated in-plane to the new reference frame. The b-matrix was correspond-ingly transformed in 3D to match the rotated images (Leemans and Jones, 2009). Diffusion tensors were then recomputed based on the registered data.
Parametric maps, including the mean apparent diffusion
coef-ficient (ADC), principal eigenvalues
l
1,l
2andl
3, FA and transverse anisotropyl
2/l
3, were calculated (Pierpaoli and Basser, 1996) and reported for the LV and RV in slack and contractured states. To quantify precision inv1,v2 and v3, wild bootstrapping was per-formed (Whitcher et al., 2008), and 95% cone-of-uncertainty (COU) are reported. Masks based on the signal intensity of the B¼0 im-age, mean ADC and FA were used to exclude the surrounding gel and buffer within the ventricles. Superquadric shape functions describe a wide range of shapes from spheres to discs and cubes, and are better suited in highlighting the orientations ofv2andv3 than traditional ellipsoids (Ennis et al., 2005). As illustrated inFig. 1, tensors were displayed as superquadric glyphs for improved visu-alisation of myocardial sheetlet arrangements. Tracking was per-formed in the whole heart alongv1andv3using Diffusion Toolkit (Wang et al., 2007). The fibre assignment by continuous tracking algorithm (Mori et al., 1999) was used, along with a splinefilter and an angle threshold of 30. A threshold of FA 0.11 was used to segment the heart, and tracks were seeded from all voxels within the segmented volume. The tracks in the whole heart and inter-secting various regions-of-interest (ROIs) were displayed in Track-vis (Wang et al., 2007). The term‘fibres’is used to describe the locally prevailing cell orientations as assessed byv1in DTI.‘Tracks’ refer to the streamlines connecting contiguous tensors with similar alignment. A minimum length threshold of 0.5 mm was used forv1 tracks.v1andv3tracks were colour-coded by orientation: apico-basal (red), anterior-posterior (green) and lateral-septal (blue).In order to mitigate variations arising from local tissue de-formations, the helix angles (HA) and transverse angles (TA) were defined relative to a local coordinate system. Local radial unit vectors were computed using Laplace’s method in the LV and RV separately (Jones et al., 2000). Local circumferential unit vectors were defined as being perpendicular to the local radial and global longitudinal unit vectors. Finally, the local longitudinal unit vectors were derived from the local radial and circumferential unit vectors. Short-axis planes were defined by the local radial and circumfer-ential unit vectors. Tangcircumfer-ential planes were defined by local longi-tudinal and circumferential unit vectors.
Typically, HA and TA reflect the orientation ofv1in the long-axis and its deviation from the circumferential axis in the short-axis plane respectively. In order to assess sheetlet structures, we simi-larly define HA and TA based onv3. The HA of a given eigenvector is the angle subtended by the projection of the eigenvector onto the tangential plane and the short-axis plane. The TA is the angle subtended by the projection of the eigenvector onto the short-axis plane and the tangential plan. HA (v1,v3) and TA (v1,v3) maps were generated in the whole heart. A custom cyclic colour map was used to avoid discontinuities at transitions between90andþ90.
ROIs in the LV and RV myocardium were identified according to Fig. 1. Segments of LV myocardium corresponding to angular pro-jections (
q
) in the short-axis plane were defined as the LV lateral (10<q
<10), anterior (40<q
<60), septal (170<q
<190) and posterior (300<q
<320) walls (Healy et al., 2011). Similarly, segments in the RV myocardium were defined as the RV anterior (120 <q
< 140), lateral (170 <q
< 190) and posterior (220<q
<240) walls. The transmural profiles of HA (v1,v3) and TA (v1,v3) were reported in these ROIs in a basal, middle and apical slice. To do so, HA and TA, corresponding to each ROI, slice and heart, were averaged in polar coordinates within radial bins of 0.2 mm. HA and TA were then reported as a function of myocardial wall thickness. Wrap-around of HA and TA from90toþ90and vice versa, as occurring particularly in epicardial and endocardial regions, was avoided by expanding the dynamic angle range to 150toþ150. The linearity of the profiles was characterised by the R2obtained with a linearfit (Healy et al., 2011). The total angle gradients over the myocardial walls are reported in/mm. Histo-grams of HA (v1,v3) and TA (v1,v3) were computed in the LV and RV across three adjacent mid-ventricular slices with a bin size of 2. All processing was performed using in-house code (Matlab2013a, Natick, MA, USA).3. Results
Diffusion parameter maps in a mid-ventricular slice in slack and contractured hearts are presented inFig. 2.
l
1was relatively ho-mogeneous across the myocardium in the slack heart, whereasl
2 andl
3 were elevated in the subendo- and subepicardium, contributing to a locally higher mean ADC and lower fractional and transverse anisotropy. Data from the contractured heart were less heterogeneous than in the slack heart. Transverse anisotropy was higher is the contractured heart, but remained low within the papillary muscles. Summary data of these observations in the whole heart are presented inTable 1. Mean ADC and transverse anisotropy were 6.7% lower and 4.9% higher respectively, in the LV of the contractured heart compared to the LV of the slack heart. Similarly, the same values in the RV of the contractured heart were 3.5% lower and 3.2% higher than those of the slack heart respec-tively. Average FA was unchanged. Correspondingly,l
1,l
2andl
3 were lower in both the LV and RV of the contractured heart, by up to 8.8%.In terms of measurement precision, 95% COU (v1/v2/v3)¼6.2/ 14.8/13.6 (slack) and 6.7/12.8/11.3 (contracture) averaged across the myocardium. Maps of 95% COU show that precision ofv1, v2andv3are excellent throughout most of the myocardium, and poorer where there are major vessels and edges with residual partial volume. In addition, precision ofv2andv3are also poorer in the papillary muscles, in myocardial regions containing greater extracellular space and in regions near the apex. Wefind that 99%/ 90%/91% (slack) and 99%/93%/94% (contracture) of voxels in the myocardium fall within a threshold of 95% COU (v1/v2/v3)<30.
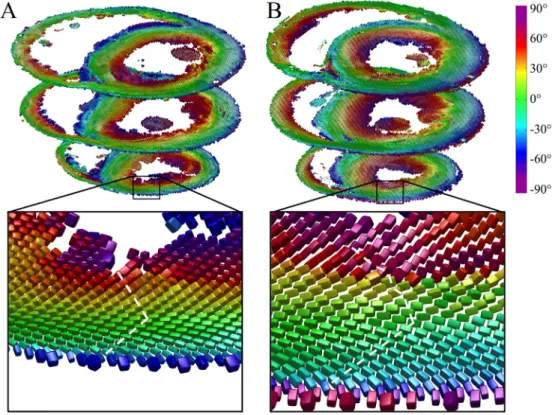
Fig. 3 illustrates tensors in three short-axis slices as super-quadric glyphs, coloured by the helix angle of v1. Besides the orientation ofv1, these glyphs highlight the orientations ofv2and v3more clearly than ellipsoids. A close up of tensors in the slack heart illustrates the known circumferential arrangement ofv1and the transmural variation in helix angle, from negative in the sub-epicardium to positive in the subendocardium. v3 was oriented radially at the midline, but fanned out towards the edges of the heart giving a characteristic V-shaped transmural sheetlet profile. This V-shaped sheetlet arrangement was less coherent in the contractured heart between the subendocardium and midline.
Multiple epicardial views of tracks in the two hearts are shown inFig. 4, along with an endocardial view of the RV wall. In the LV
lateral wall of the slack heart, a thin outer layer of tracks is aligned longitudinally over a larger region of obliquely oriented left helical tracks. Tracks continue around the anterior surface of the heart where they interdigitate in bundles with left helical tracks of the RV. From the septal view, these tracks of the RV take on a more circumferential orientation. Tracks then revert to a left helical orientation at the posterior wall and blend in seamlessly with the epicardial tracks of the LV. In the apical view, tracks of the LV spiral clockwise towards the LV apex. In contrast, the RV apex is
composed primarily of a combination of septally oriented tracks radiating from the LV apex, and longitudinally oriented tracks extending from the RV endocardium. Tracks in the RV endocardium can be seen to be generally right handed, with steeper helix angles near the LV posterior wall. In the contractured heart, tracks at the LV lateral wall epicardium are oriented more longitudinally than in the slack heart. Tracks in the RV epicardium, seen from anterior and septal aspects, are more circumferential. They interdigitate more pronouncedly with LV epicardial tracks in the anterior view, Fig. 1.Definition of eigenvectors, angles, and segments. A: Single tensor, displayed as a superquadric glyph, shows the orientation of the principal eigenvectorsv1,v2andv3. B: The helix angle (HA) of a given eigenvector is the angle subtended by the projection of the eigenvector onto the tangential plane and the short-axis plane. The transverse angle (TA) is the angle subtended by the projection of the eigenvector onto the short-axis plane and the tangential plane. C: Specification of regions-of-interest in the LV anterior, lateral, posterior and septal walls (LVA, LVL, LVP and LVS) based on the angleq, perpendicular to the long-axis centred in the LV cavity. The RV anterior, lateral and posterior walls (RVA, RVL, RVP) were similarly specified based on a long-axis centred on the union of the LV septum and cavity and the RV cavity.
Fig. 2.Parametric maps in a mid-myocardial short-axis slice. (Top from left to right): Mean apparent diffusion coefficient (ADC), principal eigenvaluesl1,l2, andl3, and fractional anisotropy (FA). (Bottom from left to right): 95% cone-of-uncertainty (COU) inv1,v2andv3, and transverse anisotropy (l2/l3).
forming a suture-like feature in the apical view. We observe that LV tracks in the contractured heart spiral more uniformly towards the LV apex. RV endocardial tracks are again right-handed but with steeper helix angles. Besides the LV and RV, tracks forming the left and right atria, left atrial appendage, pulmonary artery and aorta can be seen. Gaps in the tracks in the LV wall correspond to major coronary vessels.
Digital bisections of the heart in the vertical long-axis, hori-zontal long-axis and short-axis are presented inFig. 5. Tracking based on bothv1andv3is shown. Thev1data in the slack heart (Fig. 5AeC) recapitulate the transmural transition in helix angle fairly consistently across a mid-myocardial short-axis slice of the LV. This left to right helical transition from the subepicardium to subendocardium is replicated in the RV. Papillary muscles and chordae tendinae are predominantly longitudinal in orientation. Subtle differences in track orientation can be seen throughout the contractured heart (Fig. 5GeI). A key difference is the marked decrease in HA in the LV lateral wall and increase inv1HA in the LV septal wall, such that the majority of tracks in these segments were left-handed and right-handed respectively. Tracks based onv3are more discontinuous than those based on v1 as they follow the nominal sheetlet-normal direction.v3tracks also tend to form more
discrete segments, with sharper orientation differences between adjacent segments (Fig. 5DeF). This gives rise to V- and N-shaped transmural sheetlet-normal profiles which occur throughout the LV wall, and are particularly evident in the long-axis views. V-shaped v3distributions can also be seen in the RV wall. At the bottom of the short-axis view, longitudinally orientedv3tracks of the RV can be seen to insert into the more radially oriented tracks of the LV. This contrast is not visible by trackingv1(Fig. 5C). All features described are also seen in the contractured heart (Fig. 5JeL), with differences in the specific angle distributions.
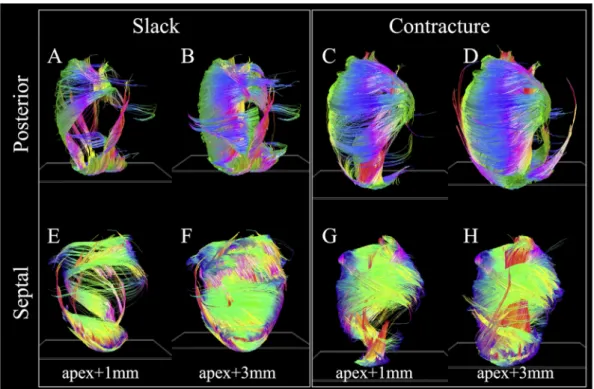
Fig. 6highlights the substantial differences in distribution ofv1 tracks in hearts in slack and contracture. The tracking parameters and short-axis plane seed regions were the same to avoid intro-ducing operator bias. In the slack heart (Fig. 6AeB; EeF), several groups of tracks were seen to arise from the apex. These include longitudinal tracks in the LV lateral subendocardium, some of which wind around towards the base of the heart in a right helical manner, left helical tracks of the LV septal endocardium and lon-gitudinal tracks of the LV septal epicardium. As the specified seed plane is shifted from apexþ1 mm to apexþ3 mm, more tracks follow the above trajectories, forming much of the circumferential tracks of the LV lateral wall. In addition, longitudinal tracks were Table 1
Parametric maps in LV and RV of whole hearts: Mean apparent diffusion coefficient (ADC), principal eigenvaluesl1,l2, andl3, fractional anisotropy (FA), and transverse anisotropy¼l2/l3(mean±standard deviation over voxels in whole heart).
Mean ADC 103mm2/s l1103mm2/s l2103mm2/s l3103mm2/s FA l2/l3 Slack state LV 1.34±0.17 1.78±0.16 1.24±0.20 1.02±0.18 0.29±0.06 1.22±0.11 RV 1.45±0.22 1.87±0.26 1.37±0.24 1.10±0.22 0.27±0.07 1.25±0.14 Contractured state LV 1.25±0.12 1.64±0.14 1.18±0.14 0.93±0.13 0.29±0.05 1.28±0.14 RV 1.40±0.19 1.80±0.23 1.34±0.21 1.05±0.197 0.27±0.07 1.29±0.15
Fig. 3.Diffusion tensors in apical, middle and basal short-axis slices in A: slack and B: contractured hearts. The tensors are coloured by helix angle ofv1and represented as superquadric glyphs to highlight the orientations ofv2andv3. A closer view of the LV anterior wall in an apical slice shows the extent of wall thickening in the contractured heart. Illustrative profiles trackingv3(white dashed lines) shows a regular V-shaped sheetlet structure, which is less well-aligned in the contractured heart.
seen to rise up the LV posterior subendocardium. These wind in a right helical manner to form the LV septal epicardium. Tracks are also seen to wind in a left helix from the LV lateral epicardium, up the anterior wall, to form the circumferential tracks of the LV septal and posterior walls between the apex and mid-myocardium. In the contractured heart (Fig. 6CeD; GeH), major differences are observed. Starting from the apex, a thick band of right helical tracks is seen to arise from the LV lateral apical wall, moving up the LV subendocardium and LV posterior wall, before transitioning to circumferential tracks of the LV mid-myocardial septal wall, then to the left helical tracks of the LV basal anterior and lateral sub-epicardium and circumferential tracks of the LV posterior wall. With the seed plane shifted to apexþ3 mm, another major band of tracks extend from the LV posterior apical subendocardium to the LV septal basal subendocardium in a steep right helix. These two bands of tracks combine to form a laminated fan-like array of tracks that meet at the LV septal basal wall. Separately, longitudinal tracks
are seen to extend right helical-wise from the LV posterior sub-endocardium to the LV septal epicardium in a similar manner as in the slack heart.
HA (v1, v3) and TA (v1, v3) maps are presented in digitally resected hearts asFig. 7. Transmural angle profiles were aggregated in several segments of the LV and RV at apical, middle and basal slices and are plotted inFigs. 8 and 9. Linearity and gradient of the profiles in a mid-myocardial slice are summarised inTable 2and histograms of the angle distributions are plotted inFig. 10. The transmural variation in HAv1in the slack heart is relatively uniform and linear across the LV lateral, apical, septal and posterior walls, with gradients in a mid-myocardial slice ranging from 18.2/mm to 23.6/mm and linearity ranging from 0.94 to 0.99. In the con-tractured heart, HAv1remains linear with R2>0.94, but there is a constant offset across the myocardium depending on region. For instance, there is a decrease of between 16.3and 48.5in the LV lateral endocardium depending on the height of the short-axis Fig. 4.Tracking in slack and contractured hearts based on connectingv1tensors. Left to right: Lateral, anterior, septal, posterior, and apical views of the epicardial surface. Tracks were colour-coded by orientation: apico-basal (red), anterior-posterior (green) and lateral-septal (blue).
Fig. 5.Tracking offibre and sheetlet structures in digitally bisected hearts. A to C: Lateral, anterior and apical views of a slack heart with tracking based onv1, D to F:v3. G to L: Corresponding views in the contractured heart.
slice, and an increase of between 41.7and 49.9in the LV septal subendocardium. In the RV of the slack heart, a similar trend of increasingly right helicalfibres is observed from the subepicardium to the subendocardium in the anterior, lateral and posterior walls at the middle and basal slices. The gradients in a mid-myocardial slice range from 19.2/mm to 24.2/mm depending on region, and are remarkably similar to those in the LV wall of the slack heart. In the RV of the contractured heart, the linear trend towards increasingly right helicalfibres in the subendocardium continues with R2>0.94. However, there is a notable increase in the gradients, which ranges from 28.3/mm to 31.2/mm, and a rightward shift of between 25.2and 34.2at the midline of the anterior wall, and between
27.1and 39.0at the midline of the lateral wall. These descriptions are likewise reflected in the tracking and 3D angle mapping in Figs. 4e7.
Compared to HA, TAv1is relatively small in the slack heart, with small gradient values of between9.2/mm to 10.7/mm, signi-fying a predominance of circumferential orientation in projections of v1 onto the short-axis plane. The majority of the RV is also comprised of largely circumferentialfibre with | TAv1|<15. In the contractured heart, TAv1is similar to that of the slack heart near the midline, but deviates sharply towards the wall surfaces, resulting in an R2 of 0.57 compared to 0.79 in the slack hearts, averaged over four regions in a mid-myocardial slice. Most of the Fig. 6. v1tracks intersecting with single-voxel thickness short-axis planes (white oblique rectangles near the apex) offset by 1 mm and 3 mm from the apex. Posterior and septal views are presented for clarity.
fibres in the RV of the contractured heart are also close to circumferential in orientation, with the exception of a region near the RV posterior endocardium where there is a marked increase of 103compared to slack hearts, averaged over three heights. Sudden large deviations tend to be more prevalent at the LV and RV epicardial and endocardial surfaces. This is a result of the pre-dominantly longitudinal fibre orientation, which greatly reduces the dynamic range of the projection ofv1onto the short-axis plane. Like HAv1, HAv3is highly uniform and linear in the LV of the slack heart, with linearity ranging from 0.95 to 0.98 and gradient ranging from 21.1/mm to 22.8/mm.v3is however, by definition orthogonal to v1 and the transition from LV subepicardium to subendocardium is broadly one of right helical to longitudinal to left helicalv3. However, this is a simplification of the complex and discrete sheetlet structures that can be seen from Fig. 5. In the contractured heart, linearity of HAv3is preserved with R2>0.92, but there is an overall leftward shift ofv3in the LV lateral wall and a rightward shift in the LV septal wall. In the RV in both hearts, there is a similar general trend of right helical through longitudinal to left helical arrangement ofv3.
The distributions of TA v3 across the hearts are highly
heterogenous, with an average R2of 0.80, 0.10, 0.43 and 0.65 in the LV and RV of the slack heart and the LV and RV of the contractured heart respectively. This is due to the short-range and discrete na-ture ofv3, and the fact that near the midline,v3is close to longi-tudinal in orientation. Nonetheless, the histograms inFig. 10show that TAv3has a more circumferential orientation (i.e. smaller |TA v3|) in a sizeable region of the LV and RV in the contractured heart relative to the slack heart.
4. Discussion
Our study showsfirst data on the effects of contracture on DTI parameters in rabbit hearts, and comparisons will be made to studies using other species, with the caveat that there are known structural differences between species (Healy et al., 2011). Here, we found no change in LV and RV FA between slack and contractured hearts. This agrees withfindings in a study of isolated rat hearts in multiple states (Hales et al., 2012). In contrast, we found that the mean ADC was lower and the transverse anisotropy was higher in the contractured heart. This result could be attributed to the fact that ourex vivo imaging protocol, with its extended acquisition Fig. 8.Left ventricular transmural profiles ofv1andv3helix angles (HA) and transverse angles (TA) across four segments (lateral, anterior, septal and posterior) in three slices (basal, mid and apical) in slack (SL) and contractured (CO) hearts. Profiles are centred on the midline (transmural depth, d¼0 mm) and extend towards the epicardium (d<0 mm) and endocardium (d>0 mm).
time, afforded higher sensitivity to subtle changes in diffusivity than prior life-heart DTI in rat heart (Hales et al., 2012). On the other hand, that data were acquired in the same heart, while we used separate rabbit hearts for slack and fixed states, with all consequences of inter-individual differences.
Tractography provides a powerful means to identify groups of cells with potential functional relevance. It has been used to visu-alise conduction pathways to inform electro-mechanical models (Hwang et al., 2011) and to identify structural remodelling in the myocardium post-infarct (Vadakkumpadan et al., 2010). It has also been used to track accelerationfields from phase contrast MRI to
estimate LV fibre orientations (Jung et al., 2006) and support structural models of the heart (Buckberg et al., 2006). In this study, we reconstructed extensive fibre tracks across the whole heart based onv1andv3, summarising information on the 3Dfibre and sheetlet architecture. Differences infibre and sheetlet organisation between the slack and contractured hearts were readily visualised. Localisation of tracks near the apex highlighted dramatic differ-ences in trajectories between slack and contractured hearts, which may inform our understanding of the mechanics of contraction. We observed V-shaped arrangements of sheetlets that are in agree-ment with MRI (Hales et al., 2012), confocal microscopy Fig. 9.Right ventricular transmural profiles ofv1andv3helix angles (HA) and transverse angles (TA) across four segments (lateral, anterior, septal and posterior) in three slices (basal, mid and apical) in slack (SL) and contractured (CO) hearts.
Table 2
Linearity and gradient of transmuralv1andv3helix angle (HA) and transverse angle (TA) profiles in a mid-myocardial slice in lateral (L), anterior (A), septal (S) and posterior (P) LV and RV myocardial walls (Refer toFig. 1for segmentation) in a slack and contractured heart.
v1HA v1TA v3HA v3TA
Linearity Gradient (/mm) Linearity Gradient (/mm) Linearity Gradient (/mm) Linearity Gradient (/mm)
Slack state LV L 0.986 20.5 0.954 10.0 0.973 21.2 0.946 42.9 A 0.971 23.6 0.430 4.0 0.945 22.8 0.622 17.9 S 0.967 18.3 0.943 9.2 0.950 21.4 0.825 33.4 P 0.941 18.2 0.817 10.7 0.975 21.1 0.792 16.3 RV A 0.766 64.0 0.757 55.6 0.760 74.5 0.005 2.0 L 0.946 37.7 0.701 23.5 0.199 13.3 0.302 59.9 P 0.964 41.4 0.751 55.0 0.977 42.2 0.000 0.5 Contractured state LV L 0.963 24.2 0.404 17.5 0.958 24.9 0.475 25.6 A 0.987 19.2 0.971 13.9 0.923 13.7 0.267 6.8 S 0.973 22.0 0.113 4.0 0.973 21.8 0.102 3.2 P 0.941 19.6 0.785 15.2 0.942 24.0 0.879 27.7 RV A 0.947 31.2 0.963 16.6 0.607 62.4 0.681 47.2 L 0.942 29.8 0.283 16.3 0.922 28.7 0.438 15.7 P 0.983 28.3 0.867 28.0 0.983 27.6 0.837 38.0
(Harrington et al., 2005; Sands et al., 2005) and histologicalfindings (Kung et al., 2011). Evidence was also found of N-shaped sheetlet arrangements and insertion of sheetlets at the intersection of the LV and RV. These observations highlight the complexity in myocardial structure that is still being unravelled. It is worthwhile to keep in mind that the tracks seen are streamlines connecting diffusion tensors and not anatomical features of the heart. The precise organisation of myocardial structure into sheetlets remains a matter of debate. We have no evidence to support the presence of a continuous muscle band, wrapped in 3D to form whole ventricles (Anderson et al., 2005; Torrent-Guasp et al., 2001). However, the continuity of locally prevailing cell orientations, sustained over long distances, is remarkable. This may be an expression of me-chanical stress fields, whose presence in the developing heart advance cell maturation (Banerjee et al., 2015) and guide myocar-dial patterning (Bressan et al., 2014; Nguyen et al., 2015). The view thatv1andv3reflect myocyte and sheetlet-normal orientations is based on histological validation studies (Holmes et al., 2000; Hsu et al., 1998; Kung et al., 2011; Scollan et al., 1998). However, his-tology work suffers from tissue distortion and 2D acquisition. De-velopments in 3D histological reconstruction with methods for correcting tissue distortion promise to further improve the accu-racy of these important validation studies (Burton et al., 2014). Besides interpretation, quantification is a challenge in tractography. Parameters such asfibre number and length are sensitive to arbi-trary thresholds such as the maximum angle step between adjoining tensors and the minimum FA used for terminating tracks. An initial study investigated how changing thresholds could affect
fibre number and length in the heart (Song et al., 2010), but a formal multi-parametric sensitivity analysis is still outstanding. Other technical challenges include intuitive display and interpretation of large numbers of tracks, and questions as to the biological signifi -cance of track properties in the heart. In the brain, track number and density have been used to estimate probabilities of connections between grey matter regions (Behrens et al., 2003) and as param-eters for inter-subject quantitative analysis (Roberts et al., 2005). Further work is needed to rationalise the utility of track-based statistics in the heart. In any case,fiber and sheetlet tracking are promising techniques that will add a new dimension to conceptual insight and computational modelling of structural and electro-mechanical properties of the heart.
Our measurements of the transmural range of HAv1in the slack
heart were 117and 120in the LV lateral and septal walls. This is higher than the 76and 83seen in a previous DTI study (Healy et al., 2011), and closer to the values of 131and 97reported in histological work (Vetter and McCulloch, 1998). There are a number of reasons that could affect the estimation ofv1in DTI, starting from sample variability and differences in contraction state andfixation. In addition, the resolution of 250
m
m used in the earlier study, compared to 200m
m here, could potentially have led to greater voxel averaging and underestimation of absolute helix angles at the epi- and endocardium. Hardware and acquisition parameters such asfield strength, maximum gradient strength, and b-value would have affected signal-to-noise ratio and contrast. Differences in post-processing including long-axis calculation, image registration, ROI selection, and transmural profile identification may have also affected the outcome. We observed a well-conserved transmural variation in HAv1. Additionally we found considerable variation in HA and TA throughout the LV and RV. This is not surprising given the 3D angle mapping and tractography results. We also describe HAv1of the RV and showed that it also varies from left to right helical orientation when progressing form RV epi-to endocardium. It is important to consider that angular measurements are gov-erned by the definition of the local coordinate system. This in turn depends on the nature of the data acquired. Here we acquired 3D isotropic high-resolution data with high SNR and whole heart coverage. This made it possible to accurately segment the hearts and align them to a common global reference frame via rigid registration. Our implementation based on Laplace’s method enabled robust detection of local radial unit vectors in both the LV and RV, in slack and contractured hearts. An alternative approach that has shown promise in in vivo cardiac DTI data with limited slices and SNR, could involve investigating tensor variability using diffeomorphic transformations into prolate spheroidal space (Toussaint et al., 2013).Measurement offibre orientation alone is insufficient to inform our understanding of cardiac structure and function. While myo-cyte contraction provides a basis for force generation and ventric-ular wall thickening, it does not, for example, fully account for the >25% increase in wall thickness in systole. Instead, changes in sheetlet orientation are thought to increase wall thickness by 16% (Chen et al., 2005), as supported by studies that demonstrated significant transverse shear occurring along the sheetlet planes (Costa et al., 1999; LeGrice et al., 1995). The inclusion of HA and TA Fig. 10.Histograms ofv1andv3helix angles (HA) and transverse angles (TA) across 3 adjacent mid-ventricular slices in the LV and RV of slack and contractured hearts.
data based onv3shed new light on sheetlet arrangement in the rabbit heart. While the transmural variation in HAv3was largely linear as per HA v1, it was broadly speaking offset by 90. In contrast, the distribution of TAv3was characterised by irregular and large discontinuities. An important consideration is the accu-racy in sortingv2andv3that depends both on the measurement and sample. Here, mean 95% COU values are low and the precision ofv2 andv3 are inversely related to transverse anisotropy, sug-gesting that the measurement is robust and sorting ofv2andv3 may be problematic in regions with lower tissue orthotropy. These regions include voxels containing substantial isotropic components such as major vessels, and regions with complex cell arrangements such as near the apex. As these regions may be localised, probabi-listic (Parker et al., 2003) and global tractography (Reisert et al., 2011) methods could offer improved confidence in tracking over long distances. We observed that transverse anisotropy was higher in the contractured compared to the slack heart, giving rise to better precision inv2andv3estimates.
The limitations of the study include a small sample size that precludes statistical analysis, and comparison of twoex vivohearts
fixed in different mechanical states. Our prior work using a similar approach yielded consistent results over five ex vivo rat hearts, where 95% COU (v1/v2/v3)¼3.7±0.2/14.7 ±1.0/14.4±1.0 (McClymont et al., 2016). This underscores the reproducibility of the DTI measurements, and a larger sample size would improve confidence in sample-related changes in contracture. The second limitation could be resolved by DTI experiments with isolated living hearts observed in multiple mechanical states (Hales et al., 2012), albeit at the cost of signal-to-noise ratio and image resolu-tion. However,fixed tissueex vivopreparations continue to provide data with the highest quality and resolution due to the longer acquisition times and lack of sample motion. In addition, tensors were visualised using superquadric glyphs. While ellipsoids are a more direct representation of the diffusion tensor, superquadric shapes may provide a more intuitive representation of the known orthotropy of myocardial structure.
5. Conclusion
Our data reconfirm the highly complex and ordered nature of cardiac architecture. Measuring, understanding and communi-cating the wealth of macro- and microstructural information is not trivial. To address this challenge, we have combined multiple complementary techniques to quantify and visualise measure-ments at different length scales. Superquadric glyphs facilitate voxel-wise interrogation of tensors, transmural profiles highlight changes across the myocardial wall, 3D maps describe global parametric distributions, histograms capture summary metrics, and localised and global tractography can potentially identify functionally important groups offibres and sheetlets.
Editors’note
Please see also related communications in this issue by Baumgartner et al. (2016)andKang et al. (2016).
Acknowledgements
This work was supported by the Engineering and Physical Sci-ences Research Council (EP/J013250/1), the Biotechnology and Biological Sciences Research Council (BB/I012117/1), the British Heart Foundation (PG/13/33/30210) and by the British Heart Foundation Centre for Research Excellence (RE/13/1/30181). JES and PK are British Heart Foundation Senior Basic Science Research Fellows (FS/11/50/29038 and FS/12/17/29532). RABB is a Sir Henry
Dale Fellow jointly funded by the Wellcome Trust and the Royal Society (109371/Z/15/Z). The authors acknowledge a Wellcome Trust Core Award (090532/Z/09/Z) and the ERC Advanced Grant CardioNECT. We thank Professor Derek Terrar for access to labo-ratory facilities.
References
Anderson, R.H., Ho, S.Y., Redmann, K., Sanchez-Quintana, D., Lunkenheimer, P.P., 2005. The anatomical arrangement of the myocardial cells making up the ventricular mass. Eur. J. Cardio-Thorac. Surg. Off. J. Eur. Assoc. Cardio-Thorac. Surg. 28, 517e525.
Axel, L., Wedeen, V.J., Ennis, D.B., 2014. Probing dynamic myocardial microstructure with cardiac magnetic resonance diffusion tensor imaging. J. Cardiovasc. Magn. Reson. Off. J. Soc. Cardiovasc. Magn. Reson. 16, 89.
Banerjee, I., Carrion, K., Serrano, R., Dyo, J., Sasik, R., Lund, S., Willems, E., Aceves, S., Meili, R., Mercola, M., Chen, J., Zambon, A., Hardiman, G., Doherty, T.A., Lange, S., del Alamo, J.C., Nigam, V., 2015. Cyclic stretch of embryonic cardiomyocytes increases proliferation, growth, and expression while repressing Tgf-beta signaling. J. Mol. Cell Cardiol. 79, 133e144.
Baumgartner, C., Brandl, J., Münch, G., Ungerer, M., 2016. Rabbit models to study atherosclerosis and its complicationsetransgenic vascular protein expression in vivo. Prog Biophys Mol Biol 121/2, 131e141.
Basser, P.J., Mattiello, J., LeBihan, D., 1994. MR diffusion tensor spectroscopy and imaging. Biophysical J. 66, 259e267.
Behrens, T.E., Johansen-Berg, H., Woolrich, M.W., Smith, S.M., Wheeler-Kingshott, C.A., Boulby, P.A., Barker, G.J., Sillery, E.L., Sheehan, K., Ciccarelli, O., Thompson, A.J., Brady, J.M., Matthews, P.M., 2003. Non-invasive mapping of connections between human thalamus and cortex using diffusion imaging. Nat. Neurosci. 6, 750e757.
Bernus, O., Radjenovic, A., Trew, M.L., LeGrice, I.J., Sands, G.B., Magee, D.R., Smaill, B.H., Gilbert, S.H., 2015. Comparison of diffusion tensor imaging by cardiovascular magnetic resonance and gadolinium enhanced 3D image in-tensity approaches to investigation of structural anisotropy in explanted rat hearts. J. Cardiovasc. Magn. Reson. Off. J. Soc. Cardiovasc. Magn. Reson. 17, 31. Bressan, M.C., Louie, J.D., Mikawa, T., 2014. Hemodynamic forces regulate
devel-opmental patterning of atrial conduction. PloS one 9.
Buckberg, G.D., Mahajan, A., Jung, B., Markl, M., Hennig, J., Ballester-Rodes, M., 2006. MRI myocardial motion andfiber tracking: a confirmation of knowledge from different imaging modalities. Eur. J. Cardio-Thorac. 29, S165eS177.
Burton, R.A., Lee, P., Casero, R., Garny, A., Siedlecka, U., Schneider, J.E., Kohl, P., Grau, V., 2014. Three-dimensional histology: tools and application to quanti-tative assessment of cell-type distribution in rabbit heart. Eur. Eur. Pacing, Arrhythm. Cardiac Electrophysiol. J. Work. Groups Cardiac Pacing, Arrhythm. Cardiac Cell. Electrophysiol. Eur. Soc. Cardiol. 16 (Suppl. 4), iv86eiv95. Burton, R.A.B., Plank, G., Schneider, J.E., Grau, V., Ahammer, H., Keeling, S.L., Lee, J.,
Smith, N.P., Gavaghan, D., Trayanova, N., Kohl, P., 2006. Three-dimensional models of individual cardiac histoanatomy: tools and challenges. Ann. N. Y. Acad. Sci. 1080, 301e319.
Chen, J.J., Liu, W., Zhang, H.Y., Lacy, L., Yang, X.X., Song, S.K., Wickline, S.A., Yu, X., 2005. Regional ventricular wall thickening reflects changes in cardiacfiber and sheet structure during contraction: quantification with diffusion tensor MRI. Am. J. Physiol-Heart C 289, H1898eH1907.
Chen, P.S., Cha, Y.M., Peters, B.B., Chen, L.S., 1993. Effects of myocardial fiber orientation on the electrical induction of ventricularfibrillation. Am. J. Physiol. 264, H1760eH1773.
Cook, P.A., Symms, M., Boulby, P.A., Alexander, D.C., 2007. Optimal acquisition orders of diffusion-weighted MRI measurements. J. Magn. Reson. Imag. 25, 1051e1058. Costa, K.D., Takayama, Y., McCulloch, A.D., Covell, J.W., 1999. Laminarfiber archi-tecture and three-dimensional systolic mechanics in canine ventricular myocardium. Am. J. Physiol. Heart Circ. Physiol. 276, H595eH607.
Ennis, D.B., Kindlman, G., Rodriguez, I., Helm, P.A., McVeigh, E.R., 2005. Visualization of tensorfields using superquadric glyphs. Magn. Reson Med. 53, 169e176. Ferreira, P.F., Kilner, P.J., McGill, L.A., Nielles-Vallespin, S., Scott, A.D., Ho, S.Y.,
McCarthy, K.P., Haba, M.M., Ismail, T.F., Gatehouse, P.D., de Silva, R., Lyon, A.R., Prasad, S.K., Firmin, D.N., Pennell, D.J., 2014. In vivo cardiovascular magnetic resonance diffusion tensor imaging shows evidence of abnormal myocardial laminar orientations and mobility in hypertrophic cardiomyopathy. J. Cardiovasc Magn. R. 16.
Hales, P.W., Schneider, J.E., Burton, R.A., Wright, B.J., Bollensdorff, C., Kohl, P., 2012. Histo-anatomical structure of the living isolated rat heart in two contraction states assessed by diffusion tensor MRI. Prog. Biophys. Mol. Biol. 110, 319e330. Harrington, K.B., Rodriguez, F., Cheng, A., Langer, F., Ashikaga, H., Daughters, G.T., Criscione, J.C., Ingels, N.B., Miller, D.C., 2005. Direct measurement of transmural laminar architecture in the anterolateral wall of the ovine left ventricle: new implications for wall thickening mechanics. Am. J. Physiol. Heart Circ. Physiol. 288, H1324eH1330.
Healy, L.J., Jiang, Y., Hsu, E.W., 2011. Quantitative comparison of myocardialfiber structure between mice, rabbit, and sheep using diffusion tensor cardiovascular magnetic resonance. J. Cardiovasc. Magn. Reson. Off. J. Soc. Cardiovasc. Magn. Reson. 13, 74.
light microscopy. Accuracy, limitations and contribution to the study of the fiber architecture of the ventricles during fetal and neonatal life. Eur. J. Cardio-Thorac. Surg. Off. J. Eur. Assoc. Cardio-Cardio-Thorac. Surg. 31, 915e921.
Jung, B.A., Kreher, B.W., Markl, M., Hennig, J., 2006. Visualization of tissue velocity data from cardiac wall motion measurements with myocardialfiber tracking: principles and implications for cardiacfiber structures. Eur. J. Cardio-Thorac. 29, S158eS164.
Kanai, A., Salama, G., 1995. Optical mapping reveals that repolarization spreads anisotropically and is guided byfiber orientation in guinea pig hearts. Circ. Res. 77, 784e802.
Kang, C., Brennan, J., Garrott, K., Kuzmiak-Glancy, S., Kay, M., Efimov, I.R., 2016. Technical advances in studying cardiac electrophysiology - role of rabbit models. Prog Biophys Mol Biol 121/2, 97e109.
Katz, A.M., Katz, P.B., 1989. Homogeneity out of heterogeneity. Circulation 79, 712e717.
Kohl, P., 2003. Heterogeneous cell coupling in the heart: an electrophysiological role forfibroblasts. Circ. Res. 93, 381e383.
Kung, G.L., Nguyen, T.C., Itoh, A., Skare, S., Ingels Jr., N.B., Miller, D.C., Ennis, D.B., 2011. The presence of two local myocardial sheet populations confirmed by diffusion tensor MRI and histological validation. J. Magn. Reson Imag. 34, 1080e1091.
Latt, J., Nilsson, M., Malmborg, C., Rosquist, H., Wirestam, R., Stahlberg, F., Topgaard, D., Brockstedt, S., 2007. Accuracy of q-space related parameters in MRI: simulations and phantom measurements. IEEE Trans. Med. Imag. 26, 1437e1447.
Leemans, A., Jones, D.K., 2009. The B-Matrix must Be rotated when correcting for subject motion in DTI data. Magn. Reson Med. 61, 1336e1349.
LeGrice, I.J., Smaill, B.H., Chai, L.Z., Edgar, S.G., Gavin, J.B., Hunter, P.J., 1995. Laminar structure of the heart: ventricular myocyte arrangement and connective tissue architecture in the dog. Am. J. Physiol. 269, H571eH582.
Lower, R., 1669. Tractatus de corde. Item de motu&colore sanguinis et chyli in eum transitu. Jo. Redmayne, Duck Lane, London, UK.
McClymont, D., Teh, I., Whittington, H.J., Grau, V., Schneider, J.E., 2016. Prospective acceleration of diffusion tensor imaging with compressed sensing using adaptive dictionaries. Magn. Reson. Med. 76, 248e258.
McGill, L.A., Ismail, T.F., Nielles-Vallespin, S., Ferreira, P., Scott, A.D., Roughton, M., Kilner, P.J., Ho, S.Y., McCarthy, K.P., Gatehouse, P.D., de Silva, R., Speier, P., Feiweier, T., Mekkaoui, C., Sosnovik, D.E., Prasad, S.K., Firmin, D.N., Pennell, D.J., 2012. Reproducibility of in-vivo diffusion tensor cardiovascular magnetic resonance in hypertrophic cardiomyopathy. J. Cardiovasc. MagnM Reson. Off. J. Soc. Cardiovasc. Magn. Reson. 14, 86.
Mori, S., Crain, B.J., Chacko, V.P., van Zijl, P.C., 1999. Three-dimensional tracking of axonal projections in the brain by magnetic resonance imaging. Ann. neurology 45, 265e269.
Nguyen, M.D., Tinney, J.P., Ye, F., Elnakib, A.A., Yuan, F.P., El-Baz, A., Sethu, P., Keller, B.B., Giridharan, G.A., 2015. Effects of physiologic mechanical stimulation on embryonic chick cardiomyocytes using a microfluidic cardiac cell culture model. Anal. Chem. 87, 2107e2113.
Ni, H., Castro, S.J., Stephenson, R.S., Jarvis, J.C., Lowe, T., Hart, G., Boyett, M.R., Zhang, H., 2013. Extracting myofihre orientation from micro-CT images: an optimisation study. In: Proceedings of the 40th Annual Conference on Computing in Cardiology, Zaragoza, Spain.
Parker, G.J., Haroon, H.A., Wheeler-Kingshott, C.A., 2003. A framework for a streamline-based probabilistic index of connectivity (PICo) using a structural interpretation of MRI diffusion measurements. J. Magn. Reson. Imag. JMRI 18, 242e254.
Pierpaoli, C., Basser, P.J., 1996. Toward a quantitative assessment of diffusion anisotropy. Magn. Reson. Med. Off. J. Soc. Magn. Reson. Med./Soc. Magn. Reson. Med. 36, 893e906.
Scollan, D.F., Holmes, A., Zhang, J., Winslow, R.L., 2000. Reconstruction of cardiac ventricular geometry andfiber orientation using magnetic resonance imaging. Ann. Biomed. Eng. 28, 934e944.
Song, X., Zhu, Y.M., Yang, F., Luo, J.H., 2010. Quantitative study offiber tracking results in human cardiac DTI. In: 2010 Ieee 10th International Conference on Signal Processing Proceedings (Icsp2010), vols. I-Iii, pp. 724e727.
Streeter Jr., D.D., 1979. Gross morphology andfiner geometry of the heart. In: Handbook of Physiology, Section 2: the Cardiovascular System. Williams and Wilkins, Baltimore, pp. 61e112.
Streeter Jr., D.D., Spotnitz, H.M., Patel, D.P., Ross Jr., J., Sonnenblick, E.H., 1969. Fiber orientation in the canine left ventricle during diastole and systole. Circulation Res. 24, 339e347.
Teh, I., Maguire, M.L., Schneider, J.E., 2016. Efficient gradient calibration based on diffusion MRI. Magn. Reson. Med.http://dx.doi.org/10.1002/mrm.26105(Epub ahead of print).
Torrent-Guasp, F., Buckberg, G.D., Clemente, C., Cox, J.L., Coghlan, H.C., Gharib, M., 2001. The structure and function of the helical heart and its buttress wrapping. I. The normal macroscopic structure of the heart. Semin. Thorac. Cardiovasc. Surg. 13, 301e319.
Toussaint, N., Stoeck, C.T., Schaeffter, T., Kozerke, S., Sermesant, M., Batchelor, P.G., 2013. In vivo human cardiacfibre architecture estimation using shape-based diffusion tensor processing. Med. Image Anal. 17, 1243e1255.
Tseng, W.Y., Dou, J., Reese, T.G., Wedeen, V.J., 2006. Imaging myocardialfiber disarray and intramural strain hypokinesis in hypertrophic cardiomyopathy with MRI. J. Magn. Reson. Imag. JMRI 23, 1e8.
Vadakkumpadan, F., Arevalo, H., Prassl, A.J., Chen, J.J., Kickinger, F., Kohl, P., Plank, G., Trayanova, N., 2010. Image-based models of cardiac structure in health and disease. Wires Syst. Biol. Med. 2, 489e506.
Vetter, F.J., McCulloch, A.D., 1998. Three-dimensional analysis of regional cardiac function: a model of rabbit ventricular anatomy. Prog. Biophys. Mol. Bio 69, 157e183.
Waldman, L.K., Nosan, D., Villarreal, F., Covell, J.W., 1988. Relation between trans-mural deformation and local myofiber direction in canine left ventricle. Circ. Res. 63, 550e562.
Wang, R., Benner, T., Soresen, A.G., Wedeen, V.J., 2007. Diffusion Toolkit: a software package for diffusion imaging data processing and tractograpy. In: Proceedings of 15th ISMRM Meeting.
Whitcher, B., Tuch, D.S., Wisco, J.J., Sorensen, A.G., Wang, L., 2008. Using the wild bootstrap to quantify uncertainty in diffusion tensor imaging. Hum. Brain Mapp. 29, 346e362.
Wickline, S.A., Verdonk, E.D., Wong, A.K., Shepard, R.K., Miller, J.G., 1992. Structural remodeling of human myocardial tissue after infarction. Quantification with ultrasonic backscatter. Circulation 85, 259e268.
Young, A.A., Legrice, I.J., Young, M.A., Smaill, B.H., 1998. Extended confocal micro-scopy of myocardial laminae and collagen network. J. Microsc. 192, 139e150. List of abbreviations
2D:two-dimensional
3D:three-dimensional
ADC:apparent diffusion coefficient
DTI:diffusion tensor imaging
FA:fractional anisotropy
HA:helix angle
MRI:magnetic resonance imaging
ROI:region-of-interest