Evaluation of the Youth Financial Literacy Trial
Program
Roslyn Russell, Business Portfolio, RMIT University
Rob Brooks, Department of Econometrics and Business Statistics, Monash University
Aruna Nair, Business Portfolio, RMIT University
Table of Contents
Summary...3
1. Introduction ...4
2. Financial Education and Youth ...4
3. Youth Financial Literacy Trial Program ...5
4. Methodology...6
5. Pre-Training Results ...7
6. Participants’ Financial Product Usage and Literacy: Pre-Training ...13
7. Using Mobile Phones ...14
8. Participants’ Expectations of Program ...16
9. Post-Training Results...16
10. Rating of the Youth Financial Literacy Trial Program ...16
11. Changes in Levels of Understanding: Mobile Phones and Credit Cards ...19
12. Program Improvements ...23
13. Conclusion ...24
List of Tables
Table 1: Characteristics of the participants ...7Table 2: Mathematical and computing skills of participants...9
Table 3: Saving and spending patterns ...10
Table 4: Use of financial products ...13
Table 5: Broad financial literacy of participants...13
Table 6: Mobile phones – understanding and expenditures ...15
Table 7: Participants’ pre-training expectations of the Youth Financial Literacy Trial Program ...16
Table 8: Overall rating of the program...17
Table 9: Rating of the individual lessons: percentage of respondents ...18
Table 10: Changes in participants’ levels of understanding of mobile phones and credit cards ...19
Table 11: Increase in understanding of mobile phones and overall program and lesson satisfaction ...21
Table 12: Increase in understanding of credit cards and overall program and lesson satisfaction ...22
Table 13: Most important lessons learned about mobile phones ...22
Table 14: Most important lessons learned about credit cards ...23
Table 15: Suggestions for program improvement...24
List of Figures
Figure 1: Main language spoken at home...8Figure 2: Mathematical skills of participants ...9
Figure 3: Computing skills of participants...10
Figure 4: Saving behaviour of participants ...11
Figure 5: Savings set aside by participants ...12
Figure 6: Approach to monitoring spending ...12
Figure 7: Overall program rating...17
Figure 8: Rating of the mobile phone lesson...18
Figure 9: Rating of the credit card lesson...19
Figure 10: Rating of change in understanding of mobile phones ...20
Summary
The Youth Financial Literacy Trial Program was delivered at Peter Lalor Secondary College in Melbourne to students in years 7 and 8 in 2005. This report presents the findings from the program’s evaluation. The evaluation was conducted using pre and post-training surveys with 104 students taking part in the research. The primary aim of the Youth Financial Literacy Trial Program was to increase students’ knowledge and understanding of financial issues regarding mobile phones and credit cards. The purpose of the mobile phone topic was to make students aware of the range of costs and charges applicable to different mobile phone deals and the importance of reading and understanding mobile phone contracts. The credit card module was aimed at developing the students’ awareness about the possible pitfalls, advantages and disadvantages around the use of credit cards.
Following is a summary of the key evaluation findings:
§ The overwhelming majority (73.5%) of the students had a positive experience of the program.
§ More than half of the students surveyed (approximately 60%) found the credit card and mobile phone lessons extremely useful or useful.
§ Most importantly, at the completion of the program, the majority of students reported an increase in understanding of both mobile phones and credit cards. Nearly 94% of students reported an increase in understanding of mobile phone plans and charges and nearly 95% reported increased understanding of credit card use.
§ Higher ratings of the program were given by those students whose reported understanding of credit cards and mobile phones increased a lot and those students who rated the lesson on mobile phones as extremely useful.
Students expressed interest in receiving more financial education relating to loans and employment earnings.
1. Introduction
This report presents the findings from an evaluation of the Youth Financial Literacy Trial Program aimed at assisting high school students improve their levels of understanding of mobile phones and credit cards. The primary aims of the evaluation were to assess the program for appropriateness and effectiveness. That is, to ensure that the program objectives met the needs of the participants and the extent to which the program achieved its objectives. There are two primary objectives of the Youth Financial Literacy Trial program:
1) To increase students’ awareness and knowledge of mobile phone charges and contracts
2) To increase students’ awareness and knowledge about responsible use of credit cards.
The Youth Financial Literacy Trial Program was developed specifically for use as a trial at Peter Lalor Secondary College, by a team of teachers and a curriculum specialist working for the Department of Education and Training. Its development and evaluation was supported by ANZ. The development of this trial program was based on the MoneyMinded program, which is designed to improve adult financial education. The program was delivered by high school teachers at Peter Lalor Secondary College to students in years 7 and 8 during the first and second term of 2005. Peter Lalor Secondary College is located in Lalor, a northern suburb of Melbourne and serves a predominantly low socioeconomic market. The program included two modules with a number of lesson topics in each. The first module dealt with mobile phones and the second was about credit cards.
2. Financial Education and Youth
Concern for the levels of financial literacy in society as a whole has grown considerably in recent times and will become even more important in the future (Fox, Bartholomae and Lee, 2005). Inadequate financial knowledge and skills is seen to be a contributing factor towards unsustainable levels of household debt, a growing number of bankruptcies and decreased levels of savings (Fox et al, 2005). This raises serious concerns for the financial future of today’s teenagers. If levels of financial knowledge and skills are inadequate within certain sectors of the general population, then there are reduced chances for many children and teenagers to acquire the information they need to survive in an increasingly complex financial world. At a greater disadvantage are children from low-income families (ANZ, 2003). The primary vehicle for asset and wealth accumulation is through intergenerational transfer and children from low-income families have a greatly reduced chance of benefiting from any financial advantage gained by their parents (Sherraden, 2002; Scanlon and Page-Adams, 2001; Banks and Tanner, 1999).
There is growing evidence that the ‘asset-effect’ provides a range of benefits for those who have been able to accumulate assets. For example, in the UK, research has indicated that young adults who have savings by the age of 23 are less likely to be unemployed 10 years later (Bynner, 2001) and those who start adult life with some assets are more likely to start their own businesses (Blanchflower and Oswald, 1998). However, in many cases it is not the inability of youth and teens to save or accumulate assets that inhibits their opportunities in
later life, but through a lack of knowledge and financial management skills they find themselves in a spiral of debt that makes it very difficult to even get back to a neutral financial starting point.
There are a number of trends that are affecting the financial well being of today’s teens:
§ The growing number and complexity o f financial products available § The increasing availability of credit cards (Godsted, 2005)
§ The increasing mediums for advertising and consumer pressure (Langer, 1996)
§ The advancement of technology at an exponential rate causing a faster rate of redundancy of personal entertainment and communication products such as mobile phones and iPods
Hence, the need for financial education for children and teens has never been greater. The UK and the USA in particular are devoting significant resources to financial education in schools and in the community (Fox, Bartholomae and Lee, 2005; Lyons and Scherpf, 2004; Varcoe and Fitch, 2003). There is substantial evidence to suggest that even pre-schoolers and primary school students benefit from simple lessons in financial management (Davis and Taylor, 1979; Godfrey, 1993; Rendon and Kranz, 1992). Also, research indicates that habitual behaviour in children can be established early with appropriate guidance and education from parents and schools (Furnham, 1999). The crucial factor however, in designing financial education for teens is that it needs to be relevant to their needs at the time (Varcoe and Fitch, 2003).
3. Youth Financial Literacy Trial Program
The Youth Financial Literacy Trial Program includes mobile phones and credit cards as the two primary areas of financial education seen to be of priority to the target group. In recent years the increase in the number of teenagers seeking legal aid to help them sort out their debts from hundreds to even thousands of dollars has increased to the point where it has become a concern for governments here and internationally. The widespread availability of credit together with the upsurge in mobile phone usage is seen as the main causes of debt among teenagers. Teenagers unable to repay their debts run the risk of gaining a bad credit rating, of being declared bankrupt and of being precluded from borrowing money from financial institutions for some years into their future. It is therefore important that teenagers realise the potential traps of mobile phone usage and develop an understanding of their rights and responsibilities when signing mobile phone contracts.
It is also important to make the connection between debt and bankruptcy to the current climate of easy credit/easy money. While credit cards are sometimes seen as an easy way to purchase something that cannot be afforded immediately, students need to develop awareness that borrowing money or getting credit means you promise to repay the money borrowed, often with interest. The promise to repay commits a person’s future income and therefore places limits on how income can be used. People who have problems repaying
credit cards can have their credit rating affected, which can make it difficult and/or impossible to borrow money in the future.
Following is an overview of the modules that comprised the Youth Financial Literacy Trial Program.
Module 1: Mobile Phones
The purpose of this topic is to make students aware of the range of costs and charges applicable to different mobile phone deals and the importance of reading and understanding the fine print when purchasing a mobile phone or entering a mobile phone contract.
By the end of the mobile phone lessons, students should be able to: 1. Describe some different mobile pho ne plans
2. Explain some costly mobile phone habits
3. Describe their personal mobile phone needs and justify a plan that best suits these
4. Understand the importance of shopping around for a mobile phone and plan 5. Understand what a mobile phone contract is and the implications of signing
one
6. Demonstrate an awareness of certain keywords that could warn them or prompt them to seek further information
7. Suggest ways of handling a ‘hard sell’ situation 8. Explain some of the main features of a phone bill Module 2: Credit Cards
The credit card module is aimed at developing student awareness about the possible pitfalls, advantages and disadvantages around the use of credit cards. By the end of the credit card module the students should be able to:
1. Explain the difference between credit and debit cards
2. Describe some advantages and disadvantages of using credit cards 3. Justify when it may not be appropriate to use a credit card
4. Describe some different community attitudes towards credit card use 5. Identify important questions to ask when applying for a credit card
6. Describe some of the different interest rates and charges that apply to credit cards
7. Explain the problems associated with paying the minimum repayment 8. Describe some common features found on credit card statements 9. Explain what a credit report is and what it means to ‘default’ on a loan 10. Suggest ways for staying out of trouble when using credit cards
4. Methodology
The Youth Financial Literacy Trial Program was delivered to students in years 7 and 8 at Peter Lalor Secondary College in Melbourne’s northern suburb of Lalor. There were 104 students who took part in the research.
The research was survey-based and utilised a primarily quantitative approach but opportunity was given for the respondents to include qualitative information. The
overall aim was to assess the effectiveness and appropriateness of the Youth Financial Literacy Trial Program for years 7 and 8 students.
The data collection was facilitated by the participants’ class teachers and took place in the classroom. The research aimed to include the total population of students undertaking the Youth Financial Literacy Trial Program. Data collection took place in two stages: Firstly, a pre-training questionnaire was administered at the commencement of the Youth Financial Literacy Trial Program and a post-training survey was conducted at the completion of the program. The first questionnaire aimed to capture demographic variables, pre-training levels of numeracy and computer literacy, attitudes towards spending and saving, pre-training financial product usage and literacy, and pre-pre-training mobile phone usage and literacy. The second questionnaire aimed to capture self-reported change in students’ knowledge and understanding of mobile phones and credit cards, their levels of satisfaction with the program, and the appropriateness and effectiveness of program content.
5. Pre-Training Results
The pre-training data analysis includes a breakdown of the participants’ demographic information, their self-reported levels of numeracy and computer literacy, their attitudes towards spending, saving and debt, what they expect to learn from the program, current mobile phone and credit usage and their levels of usage of a range of financial products.
The Participants
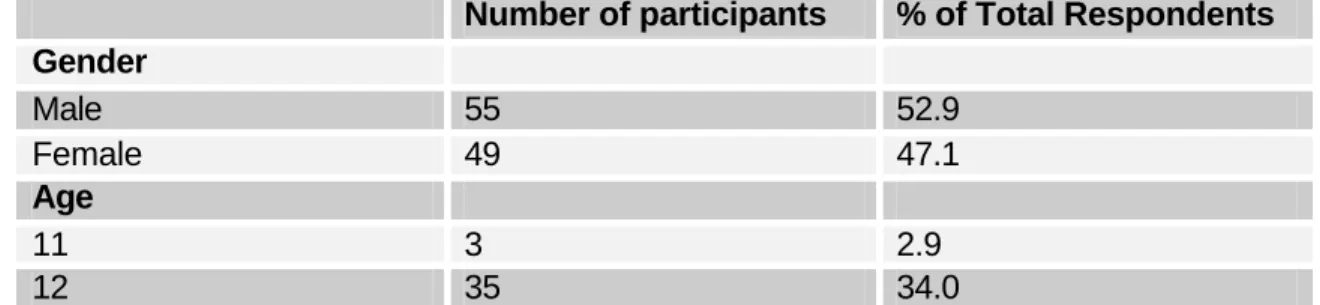
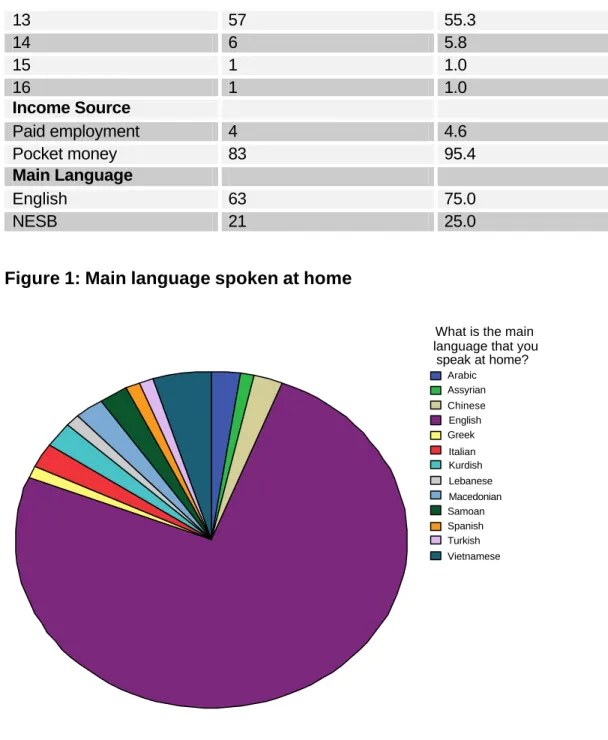
A total of 104 students participated in the Youth Financial Literacy Trial Program and returned training questionnaires for inclusion in the analysis. The pre-training survey collected information on a range of personal characteristics including gender, age, main source of income and main language spoken at home. This information is summarised in Table 1 and Figure 1. The participants are fairly evenly balanced in terms of gender with slightly more males (52.9%). In terms of age, the overwhelming majority (approximately 90%) of participants are either 12 (34.0%) or 13 (55.3%). Consistent with the age profile, most (95.4%) of the participants have pocket money as their main source of income. While the majority of participants (60.6%) have English as their main language spoken at home, a sizable proportion of participants have one of twelve languages as their main language.
Table 1: Characteristics of the participants
Number of participants % of Total Respondents Gender Male 55 52.9 Female 49 47.1 Age 11 3 2.9 12 35 34.0
13 57 55.3 14 6 5.8 15 1 1.0 16 1 1.0 Income Source Paid employment 4 4.6 Pocket money 83 95.4 Main Language English 63 75.0 NESB 21 25.0
Figure 1: Main language spoken at home
What is the main language that you
speak at home? Arabic Assyrian Chinese English Greek Italian Kurdish Lebanese Macedonian Samoan Spanish Turkish Vietnamese
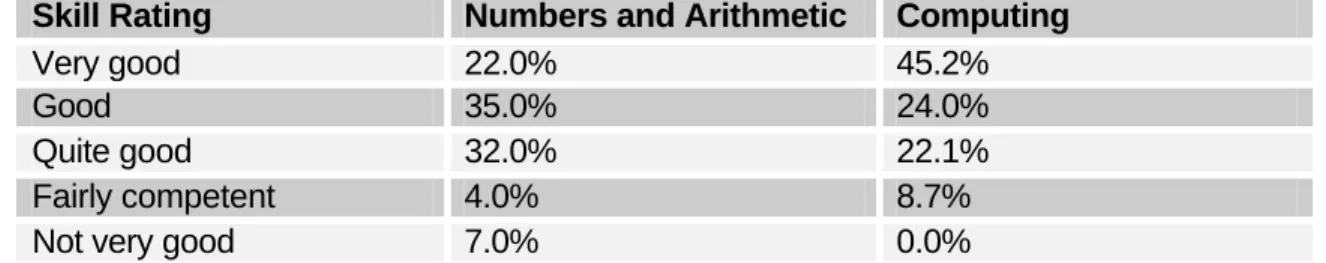
Prior to undertaking the Youth Financial Literacy Trial Program, the participants were asked to rate their abilities with numbers and arithmetic, and computers. This information is summarised in Table 2 and Figures 2 and 3. In general most of the participants rate themselves well in terms of their mathematical and computing skills, at quite good or better. Further, participant rating of their computing skills is generally higher than that of their numeracy and arithmetic skills. Participants were also asked if they had access to the Internet at home. A total of 58.6% of participants have access to the Internet at home.
Table 2: Self-reported mathematical and computing skills of participants
Skill Rating Numbers and Arithmetic Computing
Very good 22.0% 45.2%
Good 35.0% 24.0%
Quite good 32.0% 22.1%
Fairly competent 4.0% 8.7%
Not very good 7.0% 0.0%
Figure 2: Mathematical skills of participants
On the following scale, please rate your own abilities with numbers and arithmetic
Not very good Fairly competent Quite good Good Very good
Figure 3: Computing skills of participants
On the following scale please rate your own abilities with computers and
the Internet
Fairly competent Quite good Good Very good
The participants were also asked questions about their current savings and spending patterns. This information is summarised in Table 3 and Figures 4 through 6. In terms of their reported saving behaviour, participants are fairly evenly spread across options of saving irregularly (21.4%), saving a set amount on a regular basis (20.4%), saving for a specific purpose (43.7%) or spending all of their income as it comes in (14.4%). These attitudes regarding saving are also reflected in the patterns around saving levels where the participants are fairly evenly spread across having savings set aside for a particular goal (35.9%), savings set aside but no particular goal (40.8%), savings set aside for a rainy day (9.7%) or no savings set aside (13.6%). These savings patterns and behaviours are also consistent with how participants monitor their spending. The majority of participants monitor their spending a bit (52.0%) or closely, but without keeping written records (32.4%). Only a small number of participants monitor their spending using written records (3.9%) or not at all (11.8%).
Table 3: Saving and spending patterns
Number of participants % of total respondents Saving behaviour
Irregular 22 21.4
Specific goal 45 43.7
Regular set amount 21 20.4
Spend all income as it
comes in 15 14.4
Savings levels
Savings – rainy day 10 9.7
Savings – no specific goal 42 40.8
Savings – specific goal 37 35.9
Monitoring spending
Not at all 12 11.8
A bit 53 52.0
Closely – but no written
records 33 32.4
Closely with written
records 4 3.9
Figure 4: Saving behaviour of participants
Which of the following statements best
describes you?
I save money when I can but this doesn't happen often I save when there is something specific that I want
I try to save a set amount on a regular basis I spend all my income as it comes in
Figure 5: Savings set aside by participants Which of the following statements best describes you? I have no savings at the moment I have some savings set aside, not sure what I'll do with it Some savings set aside for a rainy day -only for emergencies I have some savings set aside for a specific goal
Figure 6: Approach to monitoring spending
Which of the following statements best
describes you? Don't keep an eye on spending,no idea how much/what spend on I keep my eye on spending a bit Keep fairly close eye on expenses, but not written records Use written records to keep a close eye on my spending
6. Participants’ Financial Product Usage and Literacy: Pre-Training
The participants were also asked questions about their usage of a range of financial products in their spending. These details are presented in Table 4. Consistent with the age profile of participants, the only product that is used always or often by a significant number of participants is cash. For all other products (except laybys) in excess of 70% of participants never use the product, and even for laybys the percentage who never use is in excess of 60%.
Table 4: Use of financial products
Usage of financial products (% of respondents) Financial
Product Never Hardly ever Often Always
Cash 2.0 7.1 19.2 71.7 Cheques 78.7 13.8 3.2 4.3 Money orders 74.7 13.7 9.5 2.1 Debit cards 87.2 7.4 4.3 1.1 Credit cards 78.1 9.4 8.3 4.2 Store cards 73.4 16.0 7.4 3.2 ATMs 78.9 7.4 10.5 3.2 EFTPOS 80.9 10.6 7.4 1.1 Laybys 60.4 26.0 7.3 6.3
Table 5 presents information relating to the participants’ levels of financial literacy prior to undertaking the Youth Financial Literacy Trial Program. In terms of bills they receive, only a moderate number of participants read the bill and understand it completely (17.3%) or compare the bill to previous periods (20.0%). Larger proportions pay the bill and either file it (44.0%) or throw it away (18.7%). As expected, due to the age group of participants most of them (62.9%) have no debt. Those participants who do have debt, display the full spectrum of debt management skills. In regards to understanding banking, participants are fairly evenly spread across a complete understanding (24.5%), knowing the basics (33.7%) or no understanding (41.8%). In terms of unexpected bank charges the majority of participants (52.6%) would seek the help of their parent/guardian in resolution, although a moderate number of participants said they wo uld either complain (14.7%) or arrange an appointment with the bank to discuss (20.0%). When asked whose responsibility it was for debt incurred through misuse of a credit card that was linked to their parents’ account, 42% of participants incorrectly thought they themselves would be entirely responsible for any debt on their card.
Table 5: Broad financial literacy of participants
Number of participants % of total respondents Bill payment
Understand it completely 13 17.3
Compare to previous 15 20.0
Pay and file it 33 44.0
Handling debt
Out of control 5 5.6
Worries me 15 16.9
Have ideas, but need advice 8 9.0
Have a plan to repay 5 5.6
No debt 56 62.9
Understanding banking
Understand 24 24.5
Know the basics 33 33.7
Don’t understand 41 41.8
Unexpected bank charges
Parental help 50 52.6
Complain to bank 14 14.7
Appointment with bank 19 20.0
Just accept 4 4.2
Change accounts 8 8.4
Responsibility for credit card of others
Not responsible 13 16.0
Parents responsible 20 24.7
Only responsible if over 18 14 17.3
Entirely responsible 34 42.0
7. Using Mobile Phones
One of the key education components of the Youth Financial Literacy Trial Program was about mobile phones – understanding phone plans and monitoring usage. As such, participants were asked a number of questions relating to mobile phones. Not surprisingly, a total of 68.6% of participants have a mobile phone, demonstrating why this is a relevant topic for this group.
Comparable to the earlier questions on understanding banking products, unexpected bank fees and the monitoring of general expenditure, all of these questions were asked in the specific context of mobile phones. These results are summarised in Table 6. Compared to banking products there is a much higher level of understanding in participants with 48.4% of participants claiming they understand their mobile phone plan and only 20.9% saying they don’t understand the product. From the 44 participants who claim an understanding of mobile phones, 40 own a mobile phone. In contrast, of the 19 participants who don’t understand mobile phones, only 9 own a mobile phone.
The 44 participants who claim an understanding of mobile phones are evenly distributed across their understanding of banking products. However those who rate their knowledge of mobile phones as knowing the basics are also likely to rate their understanding of banking products as knowing the basics (51.9% of such respondents). Further, those who indicated that they do not understand mobile phone plans do not have an understanding of banking products either (73.7% of such respondents).
In terms of handling unexpected charges, the majority of participants would adopt a similar strategy for both mobile phones and banks, with 47.1% relying on the help of a parent/guardian in the case of mobile phones, as compared to 52.6% relying on the help of a parent/guardian in the case of unexpected bank charges. The differences are found between those who would make an appointment with the service provider (20.0% banks vs. 12.9% mobile phones) and those who would change service providers (8.4% banks vs. 18.8% mobile phones). Those who own a mobile phone are more likely to say they would complain (92.8% of such respondents) and much less likely to just accept the fees (25.0% of such respondents)1.
The participants were more polarised in relation to monitoring expenditure of mobile phone usage and monitoring spending in general. A greater proportion of participants (25.8%) don’t monitor their mobile phone usage at all compared to 11.8% of participants not monitoring their general spending at all. In comparing the proportions of participants that monitor expenditure closely and keep written records, 7.9% of participants do so with mobile pho ne usage while 3.9% do so for general spending.
Table 6: Mobile phones – understanding and expenditures
Number of participants % of respondents Understanding
Understand plans and
charges 44 48.4
Know the basics but not more complex products and services
28 30.8
Don’t understand plans
and charges 19 20.9
Unexpected charges
Seek parental help 40 47.1
Complain to the phone
company 14 16.5
Make an appointment to
discuss charges 11 12.9
Just accept fees, no use
arguing 4 4.7 Change to a different phone company 16 18.8 Monitoring spending Not at all 23 25.8 A bit 27 30.3
Closely – but no written
records 32 36.0
Closely with written
records 7 7.9
8. Participants’ Expectations of Program
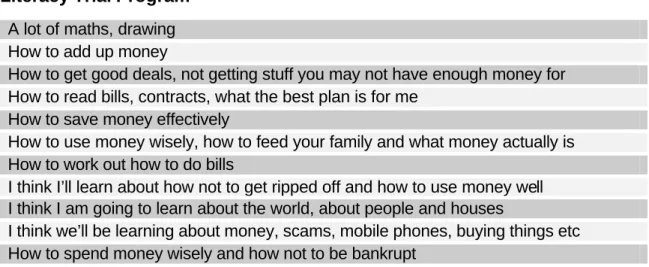
In the pre-training questionnaire the students were asked, “What kinds of things do you think you will learn about in financial literacy lessons?” There was a broad range of expectations listed with some having ‘no idea’ but many having fairly accurate expectations. Following are a sample of participants’ expectations. Table 7: Participants’ pre-training expectations of the Youth Financial Literacy Trial Program
A lot of maths, drawing How to add up money
How to get good deals, not getting stuff you may not have enough money for How to read bills, contracts, what the best plan is for me
How to save money effectively
How to use money wisely, how to feed your family and what money actually is How to work out how to do bills
I think I’ll learn about how not to get ripped off and how to use money well I think I am going to learn about the world, about people and houses
I think we’ll be learning about money, scams, mobile phones, buying things etc How to spend money wisely and how not to be bankrupt
9. Post-Training Results
A total of 98 post-training questionnaires were returned at the completion of the Youth Financial Literacy Trial Program. It is important to note that the results are based on self-reporting data. The analysis of post-training data includes:
§ How the participants’ rated their overall experience of the program
§ How useful the participants found the lessons on mobile phones and credit cards
§ The reported change in levels of understanding of mobile phones and credit cards
§ How satisfied the participants were with the overall program and lessons 10.Rating of the Youth Financial Literacy Trial Program
At the conclusion of the Youth Financial Literacy Trial Program participants were asked to rate their overall experience of the program. These ratings are summarised in Table 8 and Figure 7. The overwhelming majority of participants reported a positive experience of the program with 73.5% of participants indicating a very positive, positive or somewhat positive experience, including 15.3% of participants who rated the program very positively. In contrast, 12.2% of participants rated the program experience as being very negative, negative or somewhat negative. In addition the participants were also asked if they thought it would be useful for students in other secondary colleges to undertake the program, with 74.5% of participants replying yes to this question.
An analysis was conducted to determine whether the differences in overall program ratings could be explained by the pre-training characteristics of the
participants. These included socio-demographic characteristics, reported levels of mathematical and computer literacy, attitudes to spending and savings, pre-training financial product usage and literacy, and pre-pre-training mobile phone usage and literacy. There were no statistically significant differences found across any of the groups in overall program rating.
Table 8: Overall rating of the program
Rating Number of participants % of respondents
Very positive 15 15.3 Positive 29 29.6 Somewhat positive 28 28.6 Neutral 14 14.3 Somewhat negative 8 8.2 Negative 2 2.0 Very negative 2 2.0
Figure 7: Overall program rating
How would you rate your overall experience in doing the MoneyMinded program? Very Negative Negative Somewhat negative Neutral Somewhat positive Positive Very positive
The participants were also asked to rate the individual lessons on credit cards and mobile phones. These ratings are summarised in Table 9 and Figures 8 and 9. The majority of participants rated the lessons positively with 24.5% of participants rating both lessons as extremely useful and 34.7% of participants rating the credit card lesson as useful, and 33.7% of participants rating the mobile
phone lesson as useful. Only a small proportion of participants (5.1% in both cases) rated the lessons as not at all useful.
An analysis was conducted to determine whether the differences in the ratings of the usefulness of the lessons on mobile phones and credit cards could be explained by the pre-training characteristics of the participants. These included socio-demographic characteristics, reported levels of mathematical and computer literacy, attitudes to spending and savings, pre-training financial product usage and literacy, and pre-training mobile phone usage and literacy. There were no statistically significant differences found across any of the groups in overall ratings of the usefulness of the mobile phone or credit card lessons.
Table 9: Rating of the individual lessons: percentage of respondents
Rating Mobile phones Credit cards
Extremely useful 24.5 24.5
Useful 33.7 34.7
Somewhat useful 27.6 27.6
Slightly useful 9.2 8.2
Not at all useful 5.1 5.1
Figure 8: Rating of the mobile phone lesson
How useful was the lesson on mobile
phones?
Not at all useful Slightly useful Somewhat useful Useful
Figure 9: Rating of the credit card lesson
How useful was the lesson on credit
cards?
Not at all useful Slightly useful Somewhat useful Useful
Extremely useful
11.Reported Changes in Levels of Understanding: Mobile Phones and Credit Cards
One of the key aims of the Youth Financial Literacy Trial Program was to increase the participants’ levels of understanding of mobile phones and credit cards. These results are summarised in Table 10 and Figures 10 and 11. Overall, the majority of participants report to have considerably increased their levels of understanding of both mobile phones and credit cards (46.9% mobile phones, 49.0% credit cards).
Table 10: Reported changes in participants’ levels of understanding of mobile phones and credit cards
Change in understanding Mobile phones (%) Credit cards (%)
Increased a lot 20.4 21.4
Increased significantly 26.5 27.6
Increased somewhat 29.6 30.6
Increased slightly 17.3 15.3
Figure 10: Rating of change in understanding of mobile phones
On the following scale please rate how much your understanding of mobile phones has
increased since doing the MoneyMinded program? Hasn't increased at all Has increased slightly Has somewhat increased Has increased quite significantly Has increased a lot
Figure 11: Rating of change in understanding of credit cards
On the following scale please rate how much your understanding of
credit cards has increased since doing the MoneyMinded program? Hasn't increased at all Has increased slightly Has somewhat increased Has increased quite significantly Has increased a lot
In looking at the underlying factors determining the ratings of the reported change in understanding, it is useful to see how these changes can be related to how useful the participants found the overall program and the individual lessons. The results of this analysis are reported in Table 11 for mobile phones and Table 12 for credit cards. Those participants who rated the overall program as highly and/or the lessons on mobile phones and credit cards as more useful, were more likely to report higher increases in their understanding of mobile phones. For
instance, from the 20 participants who rated their understanding of mobile phones as having increased a lot, 40% of those participants had rated the overall program experience as very positive, and 60% of those participants had rated the lesson on mobile phones as extremely useful. In addition, from the 21 participants who rated their understanding of credit cards as having increased a lot, 47.6% of those participants had rated the overall program experience as very positive, and 71.4% of those participants had rated the lesson on mobile phones as extremely useful2.
An analysis was also conducted to determine whether the differences in the ratings of the changed understanding of mobile phones and credit cards could be explained by the pre-training characteristics of the participants. These include socio-demographic characteristics, reported levels of mathematical and computer literacy, attitudes to spending and savings, pre-training financial product usage and literacy, and pre-training mobile phone usage and literacy. There were no statistically significant differences found across any of the groups in overall ratings of the changed understanding of mobile phones or credit cards.
Table 11: Reported increase in understanding of mobile phones and overall program and lesson satisfaction
Reported increase in understanding
Not at all Slightly increased Somewhat increased Significantly increased Increased a lot Number of participants 6 17 29 26 20
Overall program rating (% of number in each category)
Very Positive 16.7 11.8 0.0 15.4 40.0 Positive 50.0 11.8 31.0 38.5 25.0 Somewhat Positive 0.0 23.5 48.3 30.8 10.0 Neutral 0.0 35.3 13.8 7.7 10.0 Somewhat Negative 16.7 17.6 6.9 0.0 10.0 Negative 0.0 0.0 0.0 7.7 0.0 Very Negative 16.7 0.0 0.0 0.0 5.0
Lesson on mobile phone usefulness rating (% of number in each category)
Extremely useful 33.3 5.9 17.2 15.4 60.0 Useful 0.0 17.6 34.5 57.7 25.0 Somewhat useful 33.3 35.3 44.8 19.2 5.0 Slightly useful 0.0 41.2 3.4 3.8 0.0 Not at all useful 33.3 0.0 0.0 3.8 10.0 2
Table 12: Reported increase in understanding of credit cards and overall program and lesson satisfaction
Reported increase in understanding
Not at all Slightly increased Somewhat increased Significantly increased Increased a lot Number of participants 5 15 30 27 21
Overall program rating (% of number in each category)
Very positive 0.0 0.0 3.3 14.8 47.6 Positive 20.0 13.3 30.0 37.0 33.3 Somewhat Positive 0.0 26.7 40.0 40.7 4.7 Neutral 0.0 20.0 20.0 7.4 14.3 Somewhat Negative 20.0 33.3 6.7 0.0 0.0 Negative 40.0 0.0 0.0 0.0 0.0 Very Negative 20.0 6.7 0.0 0.0 0.0
Lesson on credit card usefulness rating (% of number in each category)
Extremely useful 0.0 0.0 6.6 25.9 71.4 Useful 20.0 26.7 46.7 37.0 23.8 Somewhat useful 0.0 26.7 46.7 29.6 4.8 Slightly useful 0.0 46.6 0.0 3.7 0.0 Not at all useful 80.0 0.0 0.0 3.7 0.0
The participants were asked what they thought were the most important lessons they learned from the mobile phone module. Table 13 provides a summary of lessons learned.
Table 13: Most important lessons learned about mobile phones
There are a lot of hidden fees
Always read the fine print when signing a contract Not to sign anything before reading it
Make sure you keep a copy of the contract Read contracts carefully
I learned about the fees and charges I learned about the plans
Don’t buy if you don’t want it How to message in smaller words
Make sure you’re not paying for something you don’t use Not to run up a high bill
Phones are expensive when not used properly
You should have a parent or guardian with you [when you sign up] Get the right phone for me
How to read bills
Keep my phone out of reach from little brothers or sisters Look for catches
To make sure they’re not ripping me off Upsides and downsides of plans Always keep an eye on the costs Never let the phone company win
The difference between pre-paid and plan
You can have a plan and get the bill at $982 – that’s bad!
The participants were asked to list the three most important things they learned about credit cards. Following is a list of the most commonly reported learnings. Table 14: Most important lessons learned about credit cards
Don’t overspend
Don’t use them for everything How to read a credit card statement It’s the bank’s money
Read the fine print You have to pay it back
To not use your parents’ card until your parents let you Look around for a good bank
People can use it if you lose it Watch out for hidden charges
Debit cards are not the same as credit cards Credit cards can put you in a circle of debt Choose a card with less interest
Don’t give out your PIN number/Don’t lend the card to anyone Don’t buy houses or cars with them
Pay the amount by the due date
12.Program Improvements
The participants were offered the opportunity to provide qualitative suggestions for program improvement. While most of the students thought there was “nothing” needed to improve the program, there were some constructive and useful suggestions provided. Table 15 includes a sample of suggestions.
Table 15: Suggestions for program improvement
Home loans, car loans, health insurance
If we got a special speaker to come in from a phone store or a bank to help us understand more
More about credit cards and mobile phones Information about job earnings
Go on the Internet for more information and books
Do more lessons with different things, not just credit cards Loans
Watch a video and see how it is in the real world
13.Conclusion
Financial education is crucial to slowing the growth of financial exclusion. There is substantial evidence that financial literacy programs in general (Fox, Bartholomae and Lee, 2005) and also programs aimed at children and teens (Varcoe and Fitch, 2003; Gonzalez-Rubio, 2005) are successful in helping to improve levels of financial capabilities. In particular, the children of low-income families are particularly disadvantaged with reduced chances of gaining adequate financial education from their parents and therefore having to rely heavily on schools and the community for access to this knowledge (Sherraden, 2002). The development of MoneyMinded as a financial literacy training resource for adults has been a successful initiative in helping to increase the levels of financial capabilities in the community (Russell, Brooks and Nair, 2005). Introducing financial literacy into schools also is helping to address a critical need and has the potential to provide teens with a sound financial start to adult life.
After completing the Youth Financial Literacy Trial Program, students have reported an increase in understanding of the financial issues surrounding mobile phone contracts and credit card usage. There is also an indication that students are eager to learn more about other topics that will help them better manage their finances now and in the future.
References
ANZ (2003). ANZ Survey of Adult Financial Literacy in Australia. Roy Morgan Research.
Banks, J. and Tanner, S. (1999). Household saving in the UK. London: Institute for Fiscal Studies.
Blanchflower, D. and Oswald, A. (1998). What makes an entrepreneur? Journal of Labour Economics, 16, pp. 26 - 60.
Bynner, J. (2001). Effect of assets on life chances. In J. Bynner and W. Paxton (eds) The Asset-effect. London: IPPR, pp. 17 - 38.
Davis, E. and Taylor, T. (1979). Kids and cash: Solving a Parent’s Dilemma. La Jolla, CA: Oak Tree.
Fox, J., Bartholomae, S. and Lee, J. (2005). Building the case for financial education. The Journal of Consumer Affairs, 39 (1), pp 195 - 214.
Furnham, A. (1999). The saving and spending habits of young people. Journal of Economic Psychology, 20, pp 677- 697.
Godfrey, N. (1993). A penny saved: Teaching your children the values and life skills they will need to live in the real world. New York: Fireside.
Godsted, D. (2005). Financial literacy digest: Taking the long-term view. Hoosier Banker, 89 (1) pp 37.
Gonzalez-Rubio, V. (2005). I can save: A savings program for children in primary school. Testimony for hearing on ‘Building assets for low-income families’ Subcommittee on Social Security and Family Policy, Senate Finance Committee, USA.
Langer, B. (1996). The Consuming Self. In K. Allan (ed), Social Self, Global Culture: An Introduction to Sociological Ideas. Melbourne: Oxford University Press.
Lyons, A.C. and Scherpf, E. (2004). Moving from unbanked to banked: Evidence from the Money Smart program. Financial Services Review, 13, pp 215 - 231.
Rendon, M. and Kranz, R. (1992). Straight Talk About Money. New York: Facts on File.
Russell, R., Brooks, R. and Nair, A. (2005). Evaluation of MoneyMinded: an adult financial education program. Report prepared by RMIT University for ANZ.
Scanlon, E. and Page-Adams, D. (2001). Effects of assets on families and children. In R. Boshara, Ed. Building Assets. Washington: Corporation for Enterprise Development.
Sherraden, M. (2002). Assets, Poverty and Children. The Fedele, F. and Iris M. Fauri Lecture, University of Michigan School of Social Work.
Varcoe, K. and Fitch, P. (2003). Money talks – a program to improve financial literacy of teens. International Journal of Consumer Studies, 27 (3), pp 225 - 226.