C H A P T E R 2
Authors
Justin Goodwin (UK), Mike Woodfield (UK)
Mirghani Ibnoaf (Sudan), Matthias Koch (Germany), and Hong Yan (China)
Contributing Authors
Christopher Frey (USA), Rosemary Montgomery (United Nation Statistical Division), Tinus Pulles (Netherlands), Deborah Ottinger Schaeffer (USA), and Karen Treanton (IEA)
Contents
2 Approaches to Data Collection2.1 Introduction ... 2.4 2.2 Collecting data ... 2.4 2.2.1 Gathering existing data ... 2.6 2.2.2 Generating new data ... 2.8 2.2.3 Adapting data for inventory use ... 2.10 2.2.4 Emission factors and direct measurement of emissions ... 2.12 2.2.5 Activity data ... 2.17 References ... 2.19 Annex 2A.1 A protocol for expert elicitation ... 2.20 Annex 2A.2 General guidance on performing surveys ... 2.22
Figures
Figure 2.1 Process for including data in the EFDB ... 2.14
Tables
Table 2.1 Generic elements of a measurement programme ... 2.9 Table 2.2 Potential sources of literature data ... 2.13 Table 2.3 Standard measurement methods for exhaust gas ... 2.16 Table 2A.1 Example of documentation of expert judgement ... 2.21
Boxes
Box 2.1 Example of using alternative data to approximate activity data ... 2.8 Box 2.2 The difference between census and survey data ... 2.17
2
APPROACHES TO DATA COLLECTION
2.1
INTRODUCTION
Data1 collection is an integral part of developing and updating a greenhouse gas inventory. Formalised data
collection activities should be established, adapted to countries’ national circumstances, and reviewed periodically as a part of implementing good practice. In most cases generating new source data will be limited by the resources available and prioritisation will be needed, taking account the results of key category analysis set out in Chapter 4, Methodological Choice and Identification of Key Categories. Data collection procedures are necessary for finding and processing existing data, (i.e., data that are compiled and stored for other statistical uses than the inventory), as well as for generating new data by surveys or measurement campaigns. Other activities include maintaining data flows, improving estimates, generating estimates for new categories and/or replacing existing data sources when those currently used are no longer available.
The methodological principles of data collection that underpin good practice are the following:
• Focus on the collection of data needed to improve estimates of key categories which are the largest, have the greatest potential to change, or have the greatest uncertainty.
• Choose data collection procedures that iteratively improve the quality of the inventory in line with the data quality objectives.
• Put in place data collection activities (resource prioritisation, planning, implementation, documentation etc.) that lead to continuous improvement of the data sets used in the inventory.
• Collect data/information at a level of detail appropriate to the method used.
• Review data collection activities and methodological needs on a regular basis, to guide progressive, and efficient, inventory improvement.
• Introduce agreements with data suppliers to support consistent and continuing information flows.
This chapter provides general guidance for collecting existing national/international data and new data. The material is intended both for countries establishing a data collection strategy for the first time and for countries with established data collection procedures. It is applicable to emission factor, activity, and uncertainty data collection. It covers:
• Developing a data collection strategy to meet data quality objectives regarding timeliness, and also consistency, completeness, comparability, accuracy, and transparency using guidance provided in Chapter 6, QA/QC and Verification, of this volume,
• Data acquisition activities including generating new source data, dealing with restricted data and confidentiality, and using expert judgement,
• Turning the raw data into a form that is useful for the inventory.
Advice related to selecting emission factors focuses on understanding and generating measured data as well as addressing where to find and when to use default factors. Guidance on activity data focuses on generating and using new census & survey data as well as providing guidance on the use of existing international data sets. The chapter draws on information from a range of institutions and where possible additional documents have been identified and referenced so that users can find more detailed information. Sector specific data collection issues - like selecting the appropriate activity data for a particular category of emissions by sources and removals by sinks - are described in the sector specific Volumes 2-5.
2.2
COLLECTING DATA
This section provides general guidance for collecting existing data, generating new data, and adapting data for inventory use. The guidance is applicable to emission factors, activity and uncertainty data collection. It
1 Data can be defined as factual information (e.g., measurements or statistics) used as a basis for reasoning, discussion, or
discusses separately specific issues relating to new data and existing data. Specific guidance for the collection/calculation of emission factors and the collection of activity and uncertainty data is provided subsequently. Throughout the data collection activities the inventory compiler should maintain QA/QC records about the data collected according to the guidance provided in Chapter 6 of Volume 1. While collecting data it is good practice to be aware of future data collection needs.
Maintaining supply of inventory data
It is good practice to engage data suppliers in the process of inventory compilation and improvement by involving them in activities such as:
• Offering an initial estimate for the category, pointing out the potentially high uncertainties and inviting potential data suppliers to collaborate in improving estimates,
• Scientific or statistical workshops on the inventory inputs and outputs, • Specific contracts or agreements for regular data supply,
• Regular/annual informal updates on the methods that use their data,
• Establishment of terms of reference or memoranda of understanding for government and/or trade organisations providing data to clarify what is needed for the inventory, how it is derived and provided to the inventory compiler and when.
These activities will help to ensure that the most appropriate data are available for the inventory and that the data are properly understood by the inventory compiler. It will also help to establish links to data providing organisations.
Where appropriate, it may be useful to explore existing or new legal arrangements as means of guaranteeing the delivery of data to the inventory.
Restricted data and confidentiality
Data providers might restrict access to information because it is confidential, unpublished, or not yet finalised. Typically, this is a mechanism to prevent inappropriate use of the data, unauthorised commercial exploitation, or sensitivity to possible imperfections in the data. Sometimes, however, the organisation simply does not have the resources required to compile and check the data. It is advisable, where possible, to cooperate with data providers to find solutions to overcome their concerns by:
• explaining the intended use of the data,
• agreeing, in writing, to the level at which it will be made public,
• identifying the increased accuracy that can be gained through its use in inventories, • offering cooperation to derive a mutually acceptable data sets,
• and/or giving credit/acknowledgement in the inventory to the data provided.
The protection of confidentiality is one of the fundamental principles of a national statistical agency (NSA2 - see:
http://unstats.un.org/unsd/methods/statorg/). NSAs are committed to safeguarding information that plainly reveals the operations, belongings, attitudes or any other characteristics of individual respondents. If respondents are not convinced that the information they provide to the NSA is absolutely confidential, the quality of the information collected may suffer. Detailed individual data must therefore be treated and aggregated so as to draw out the information that is important to the user, without disclosing individual data. This is more likely to be an issue for business statistics, especially where a few companies dominate the sector, than for other data.
Sometimes, depending on the size and structure of the original sample, raw data can be aggregated in a way that protects confidentiality and yet produces useful information for emission inventory purposes. If, however, there is a need to preserve confidentiality the NSA, or the body that originally collected the data, are normally the only ones that can carry out this additional treatment of the raw data.
Some countries have special arrangements to mask data (i.e., make data anonymous with respect to companies or facilities) to allow researchers access. Inventory compilers may investigate the possibility of making such arrangements. However, as this reprocessing will be required regularly (annually if possible), a better solution would probably be for NSAs to incorporate this into their own work programmes. While this will require an initial investment in data processing, it will probably be quicker and less expensive in the long run. Once the
reprocessing system is set up it can be reused every time the survey is repeated, with low marginal costs. An added advantage is that the information will then be in the public domain so that others can validate the figures reported in the inventories.
Many agencies collect ancillary data during operations for other purposes, such as registration of businesses or vehicles, collection of taxes, granting of licences, allocation of grants and subsidies. Such information is usually also covered by confidentiality clauses. In general, such clauses foresee the use of the data for statistical purposes, and NSAs have the right of access to such data. Often these administrative data form the basis for sample stratification and selection and NSAs will have experience in handling them, perhaps even developing specialist software that allows the required information to be drawn out without breaching the confidentiality rules.
For all these reasons, when existing data need to be reprocessed, it is strongly recommended to work together with NSAs or the statistical service of the relevant ministry, not only to protect confidentiality, but also for cost savings.
Expert judgement
Expert judgement on methodological choice and choice of input data to use is ultimately the basis of all inventory development and sector specialists can be of particular use to fill gaps in the available data, to select data from a range of possible values or make judgements about uncertainty ranges as described in Section 3.2.2.3. Experts with suitable backgrounds can be found in government, industrial trade associations, technical institutes, industry and universities.
The goal of expert judgement may be choosing the proper methodology; the parameter value from ranges provided; the most appropriate activity data to use; the most appropriate way to apply a methodology; or determining the appropriate mix of technologies in use. A degree of expert judgement is required even when applying classical statistical techniques to data sets, since one must judge whether the data are a representative random sample and, if so, what methods to use to analyze the data. This requires both technical and statistical judgement. Interpretation is especially needed for data sets that are small, highly skewed or incomplete3. In all
cases the aim is to be as representative as possible in order to reduce possible bias and increase accuracy. Formal methods for obtaining (or eliciting) data from experts are known as expert elicitation, see Annex 2A.1 for details.
2.2.1
Gathering existing data
Although the list below is not exhaustive, it provides a starting point for possible sources of country specific data: • National Statistics Agencies
• Sectoral experts, stakeholder organisations • Other national experts
• IPCC Emission Factor Database • Other international experts
• International organisations publishing statistics e.g., United Nations, Eurostat or the International Energy Agency, OECD and the IMF (which maintains international activity as well as economic data)
• Reference libraries (National Libraries)
• Scientific and technical articles in environmental books, journals and reports. • Universities
• Web search for organisations & specialists
• National Inventory Reports from Parties to the United Nations Framework Convention on Climate Change Screening of available data
It is best to start data collection activities with an initial screening of available data sources. This will be an iterative process where details of data that are available are built up. This screening process may be slow and require questioning until a final judgement can be made about the usefulness of a data set for the inventory.
3 Methods for characterising sampling distributions for the mean are described by Cullen and Frey (1999), Frey and Rhodes
The purpose for which data were originally collected may be an important indicator of reliability. Regulatory authorities and official statistical bodies have a responsibility to take representative samples and accurate measurements, and so they often adopt agreed standards. Often official statistics (because they have a more elaborate review process) take a long time to become available but preliminary data may be available at an earlier stage. These preliminary data can be used provided that their validity is documented and can be checked against the data quality objectives set by the quality management system described in Chapter 6.
Refining Data Requirements
Once the inventory compiler has selected a data set, unless published data simply can be used in their original form, the next step will be to develop a more formal specification and data request. This formalisation enables efficient annual updating (through knowing what to ask for, from whom, and when) while complying with QA/QC requirements for documentation (see Chapter 6, QA/QC and Verification). A clear definition of data requirements will ensure that when data are delivered they are as expected. The specification should include details such as:
• Definition of the data set (e.g., time series, sectors and sub-sector detail, national coverage, requirements for uncertainty data, emission factors and/or activity data units),
• Definition of the format (e.g., spreadsheet) and structure (e.g., what different tables are needed and their structure) of the data set,
• Description of any assumptions made regarding national coverage, the sectors included, representative year, technology/management level, and emission factors or uncertainty parameters,
• Identification of the routines and timescales for data collection activities (e.g., how often is the data set updated and what elements are updated),
• Reference to documentation and QA/QC procedures, • Contact name and organisation,
• Date of availability.
It can be useful to seek commitment to these specifications from the organisation providing the data. Maintaining and updating these specifications on a regular basis, in case data requirements change, can also help to document the data sources and provide up-to-date guidance for routine data collection activities. It is not unusual for the delivery of data sets to be delayed so incorporating early warning routines to detect and manage delays can be useful.
Choosing between published national and international data
In most cases it is preferable to use national data since national data sources are typically more up to date and provide better links to the originators of the data. Most international datasets rely on nationally-derived data, and in some cases data from reputable international bodies may be more accessible and more applicable to the inventory. In some cases, groups such as international trade associations or international statistical bodies will have country specific datasets for industries or other economic sectors that are not held by national organisations. Often international data have undergone additional checking and verification and may have been adjusted with the aim of increasing consistency, though this will not necessarily lead to improved estimates if the adjusted data are recombined with national information. Countries are encouraged to develop and improve national sources of data to avoid being reliant on international data. Cross-checking national data sets with any available international data can help to assess completeness and identify possible problems with either data set.
Surrogate data
It is preferable to use data that are directly related to the item being quantified rather than to use surrogate data (i.e., alternative data that have a correlation with the data that they are replacing). In some cases, however, directly applicable data may be unavailable or have gaps (e.g., if survey and sampling programmes may be infrequent). In these cases surrogate data can help fill gaps and generate a consistent time series or a country average. For example, where a country has information to apply a higher tier method for some but not all of its facilities, then surrogate data can be used to fill the gaps. The surrogate data should be physically and statistically related to the emissions from the set of facilities for which information is not available. These alternative data should be selected based on country-specific circumstances and information, and a relationship between the data and emissions (i.e., an emission factor) developed using information from a representative subset of facilities whose emissions are known. The use of surrogate data to obtain an initial estimate of an emission or removal can help prioritise resources.
In selecting and using surrogate data to estimate emissions or removals, it is good practice for countries to perform the following steps:
(i) Confirm and document the physical relationship between emissions/removals and the surrogate activity data.
(ii) Confirm and document a statistically significant correlation between emissions/removals and the surrogate activity data.
(iii) Using regression analysis, develop a country-specific factor relating emissions/removals to the surrogate data.
An example of this approach is given in Box 2.1 and further explanation and equation (Equation 5.2) given in Section 5.3 of Chapter 5, Time Series Consistency.
BOX 2.1
EXAMPLE OF USING ALTERNATIVE DATA TO APPROXIMATE ACTIVITY DATA
The U.S. receives emission estimates for SF6 associated with electrical equipment based on a
mass-balance approach from electric power systems representing about 35 percent of the total length of U.S. transmission lines. (In the U.S., transmission lines are defined as lines carrying electricity at or above 34.5 kV.) To estimate emissions from the remaining systems, the U.S. uses kilometres of transmission lines as alternative activity data. In the U.S., SF6 is primarily used in
equipment rated at or above 34.5 kV, and kilometres of transmission lines are therefore expected to be a good predictor of emissions. In addition, statistical analysis has demonstrated a high correlation between emissions and kilometres of transmission lines. Given these relationships, the U.S. uses regression factors relating transmission kilometres to emissions. These factors are then applied to the total transmission kilometres of the systems whose emissions are being estimated. Germany has also used the length of transmission lines to estimate emissions from closed pressure systems for a set of utilities that did not respond to an industry survey. Estimates are based on the electric power systems from utilities for which both transmission kilometres and emissions data were available. The resulting estimates were later confirmed by more comprehensive surveys in subsequent years. Information on equipment banks, available nationally from equipment manufacturers and distributors were used to estimate emissions from sealed-pressure systems.) Transmission kilometres are likely to be a good predictor of emissions where most SF6 is used in
high voltage transmission equipment, as in the U.S. Where a high percentage of SF6 is used in
medium voltage distribution equipment or in gas-insulated substations, another type of data may be appropriate, such as the combined length of transmission and distribution lines or the number of substations. Combinations of these or other types of data may also be used although this increases the probability that one or more of the types of data will not be available for all the systems whose emissions are to be estimated.
2.2.2
Generating new data
It may be necessary to generate new data if representative emission factors, activity data or other estimation parameters do not exist, or cannot be estimated from existing sources. Generation of new data may entail measurement programmes for industrial process or energy related emissions, sampling of fuels for carbon content, land-use change and forestry sampling activities, or new census or surveys for activity data. Generation of new data is best undertaken by those with appropriate expertise (e.g., measurements carried out by competent organisations using appropriately calibrated equipment or surveys and censuses by any national statistical authority). These activities are often resource intensive and are most appropriately considered when the category is key and there are no other options. To optimise resource use it is recommended as far as possible to generate the required data from an extension of existing programmes rather than the initiation of totally new ones. More specific details for emission factor and activity data are outlined in the respective sections of this chapter. Where guidelines exist for activities that are defined in detail by other official bodies, such as statistical offices and measurement standards committees, these are also referenced in these sections.
Generating data by measurement
Measurements should be used in the context of advice in the sectoral Volumes 2-5, for example to determine or revise emission factors, destruction/abatement efficiency factors and activity rates. Measurements can also be used to quantify greenhouse gas emissions directly or to calibrate and verify models that are used to generate data.
When considering using measurement data it is good practice to check whether it covers a representative sample, i.e., that is typical of a reasonable proportion of the whole category – and also whether a suitable measurement method has been used. The best measurement methods are those that have been developed by official standards organisations and field-tested to determine their operational characteristics.4 Using standardised measurement
methods improves the consistency of measured data and provides the inventory compiler with additional information about the method such as statistical uncertainty levels, lower detection limits, sensitivity, and upper limits of measurement etc. The International Standards Organisation (ISO) standards, European Standards (EN) or suitable validated national standards of, e.g., U.S. Environmental Protection Agency (USEPA), or the Association of German Engineers (Verein Deutscher Ingenieure, VDI), may meet these criteria. It is good practice for the inventory compiler to document any measurement or quality management standards that have been used, and to bear in mind the data requirements of the uncertainty analysis in Chapter 3, Uncertainties, of Volume 1.
Reliable and comparable results can be achieved using a well-designed measurement programme with defined objectives; suitable methods; clear instructions to the measurement personnel; defined data processing and reporting procedures, and adequate documentation. Table 2.1 sets out the elements of such an approach.
TABLE 2.1
GENERIC ELEMENTS OF A MEASUREMENT PROGRAMME
Measurement objective Clear statement of the parameter(s) to be determined, e.g., HFC-23 emissions from HCFC-22 production.
Methodology protocol Description of the measurement methodology to be used. This should include:
• The components to be measured and any associated reference conditions;
• Methods to ensure that representative samples are taken that reflect the nature of the source category and the measurement objective a;
• The identification of any standard techniques to be used;
• The analytical equipment needed and its operational requirements;
• Any source/sink or installation access requirements;
• Any accuracy, precision or uncertainty requirements;
• Data capture requirements to be met;
• QA/QC regimes to be followed. Measurement plan with
clear instructions to the measurement personnel
Measurement plan specifies for those carrying out the measurements that includes:
• Number of sampling points for each parameter to be measured and how these are to be selected;
• Number of individual measurements to be made for each sampling point and set of conditions;
• Measurement dates and periods of the measurement campaign;
• Reporting arrangements;
• Additional source or process related information to be collected to enable data processing or interpretation of the results;
• Conditions (or range of conditions) of the source (or for industrial plant the capacity, load, fuel or feedstock) to be met during the measurements;
• Personnel responsible for the measurements, who else is involved and the resources to be used.
Data processing and reporting procedures, and documentation
Data processing requirements, including;
• Reporting procedures that will form an account of the measurements, the description of the measurement objectives, and the measurement plan;
• Documentation requirements to enable the results to be traced back through the calculations to the collected basic data and process operating conditions.
aWhen making eco-system measurements particular care is required in defining the sampling requirements – see Volume 4.
General guidance to ensure the quality of measured data to determine better emission factors and other parameters are provided in Section 2.2.2.
Relationship of data to models
Although models are frequently used to assess complex systems and can be used to generate data, models are a means of data transformation and do not remove the need for data to drive them.
2.2.3
Adapting data for inventory use
Whether using existing data, making new measurements or combining the two it is important to ensure that the level of detail and coverage of the data match, including sectors/process/abatement, location, land type, compound and years included.
Gaps in data sets
Greenhouse gas inventories require consistent estimates across time series and between categories. This section introduces approaches to fill gaps if data are missing for one or more years or the data do not represent the year or national coverage required. Examples of data gaps or inconsistencies and guidance for addressing them are presented below.
• Filling gaps in periodic data: Gaps in the time series will exist when data are available at less than annual
frequency. For example, time consuming and expensive surveys relating to natural resources - such as national forest inventories - are compiled at intervals of every fifth or tenth year. Time series data may need to be inferred to compile a complete annual estimate for the years between surveys, and for fore- and back-casts (e.g., where estimates are needed for 1990 – 2004 and survey data are only available for 1995 and 2000). Chapter 5, Time Series Consistency, provides details on splicing and extrapolation methods to fill these gaps.
• Time series revision: In order to meet deadlines, statistical organisations may use modelling and
assumptions to complete the most recent year of their estimates. These estimates are then refined the following year when all the data have been processed. Data may have been subject to further revision of historic data to correct errors or to update new methodologies. It is important that the inventory compiler look for these changes in the source data time series and integrate them into the inventory. Chapter 5 of this Volume contains more guidance on this issue.
• Incorporating improved data: While the ability of countries to collect data generally improves over time
so they can implement higher tier methods, the data may not necessarily be suitable for earlier years for the higher tiers. For example when direct sampling and measurement programs are introduced there may be inconsistencies in the time series as the new program cannot measure past conditions. Sometimes this can be addressed if the new data are sufficiently detailed (e.g., if emission factors for modern abated plant can be distinguished from those of older unabated plant) and the historic activity data can be stratified using expert judgement or surrogate data. Chapter 5 provides more details on methods of incorporating improved data consistently across a time series.
• Compensating for deteriorating data: Splicing techniques, as described in Chapter 5 on Time Series
Consistency, can be used to manage data sets that have deteriorated over time. Deterioration can occur as the result of changing priorities within governments, economic restructuring, or diminishing resources. For example, some countries with economies in transition no longer collect certain data sets that were available in the base year, or these data sets may contain different definitions, classifications and levels of aggregation. The international data sources discussed in the activity data section (see Section 2.2.5) may provide another source of relevant activity data.
• Incomplete coverage: When data do not fully represent the whole country, e.g., measurements for 3 of 10
plants or survey data of the agricultural activity for 80 percent of the country, then the data can still be used but needs to be combined with other data to calculate a national estimate. In these cases expert judgement (see Section 2.2 above for details) or the combination of these data with other data sets (surrogate or exact data) can be used to calculate a national total. In some cases survey or census data are collected in a rolling national programme that samples different provinces or sub-sectors yearly with a repeat cycle that builds a complete data set after a period of years. It is recommended that, bearing in mind that time series consistency, assumptions made in one year must also apply to the other years, and that data providers be requested to compute representative yearly data with a complete coverage.
Combining data sets numerically
Sometimes an inventory compiler will be presented with several potential datasets to use for the same estimate e.g., a series of independent measurements for the carbon content of a fuel. If the data refer to the same quantity and were collected in a reasonably uniform manner then combining them will increase accuracy and precision. Combination can be achieved by pooling the raw data and re-estimating the mean and 95 percent confidence limits, or by combining summary statistics using the relationships set out in statistical textbooks. It also is possible to combine measurements of a single quantity made using different methods that produce results with different underlying probability distributions. However, the methods for doing this are more complex, and in most cases, it will probably be sufficient to use expert judgement to decide whether to average the results, or to use the more reliable estimate and discard the other.
When using data that are not homogeneous (e.g., because of the presence of abatement technology at some plant but not others) the inventory estimate should be stratified (subdivided) so that each stratum is homogeneous and the national total for the source category will then be the sum of the strata. The uncertainty estimates can then be obtained using the methods set out in Chapter 3 by treating each stratum in the same way as an individual category. Inhomogeniety may be identified by specific knowledge of the circumstances of individual plants or technology types, or by a detailed data analysis, e.g., scatter plots of estimated emissions/removals against activity data.
Empirical data sets may contain outliers – data points that lie outside the main probability distribution and are regarded as unrepresentative. These may be identified by some rule, for example lying more than three standard deviations from the mean. Before taking this path the inventory compiler should consider whether the apparently anomalous data do in fact indicate some other set of circumstances (e.g., plant in start-up conditions) that should really be represented separately in the inventory estimate.
Multi-year averaging: Countries should report annual inventory estimates that are based on best estimates for
actual emissions and removals in that year. Generally, single year estimates provide the best approximation of real emissions/removals and a time series of single year estimates prepared according to good practice can be considered consistent. Countries should, where possible, avoid using multi-year averaging of data that would result in over- or under-estimates of emissions over time, increased uncertainty, or reduced transparency, comparability or time-series consistency of the estimates. However, in some specific cases that are described for specific sectors in Volume 2-5, multi-year averaging may be the best or even the only way to estimate data for a single year. In the case of high or uncertain annual variability – as in the growth of various tree species in a year – and where there is higher confidence in the average annual growth rate over a period of years then multi-year averaging can improve the quality of the overall estimate.
Non-calendar year data: It is good practice to use calendar year data whenever the data are available. If
calendar year data are unavailable, then other types of annual year data (e.g., non-calendar fiscal year data e.g., April – March) can be used provided that it is used consistently over the time series and the collection period for the data is documented. Similarly, different collection periods can be used for different emission and removal categories, again provided that the collection periods are used consistently over time and documented this is acceptable. It is good practice to use the same collection periods consistently over the time series to avoid bias in the trend. Animal population data may, for example, have been collected in the summer and so may not correspond with the annual average. The data should be corrected where possible to represent the calendar year. If uncorrected data are used, it is good practice for the inventory compiler to make consistent use of either calendar year data or fiscal year data for all years in the time series.
Regional inventory data
In some circumstances regional activity statistics and emission datasets are more detailed, up-to-date, accurate and/or complete than national datasets. In these cases a regionally compiled and then aggregated inventory can result in a better quality inventory for a country than one compiled using averaged national statistics and datasets. In such cases, and in order to fulfil the requirements of good practice, inventories can be compiled entirely or in part on a regional basis provided that:
• Each regional component is compiled in a way that is consistent with good practice QA/QC, choice of tiers, time series consistency and completeness.
• The approach used to aggregate the regional inventories and fill any gaps at a national level is transparent and in line with the good practice methods provided in the Guidelines.
• The final country inventory complies with the good practice quality requirements of completeness, consistency, comparability, timeliness, accuracy and transparency. In particular the sector estimates calculated at different regions, and then aggregated in the final inventory, should be self-consistent. There should be no emissions or removals omitted or double counted in the aggregated inventory and the different parts of the inventory should use assumptions and data consistently as far as practical and appropriate.
2.2.4
Emission factors and direct measurement of
emissions
This section provides generic advice for the derivation or review of emission factors or other estimation parameters; this includes specialised literature sources, using measured data, and further remarks on combining data sets. It is good practice when developing emission factors or other estimation parameters to follow the stepwise approach to data collection described above:
• Setting priorities,
• Developing a strategy for accessing the data, • Collecting and processing the data.
Volumes 2-5 provide advice on the selection and use of emission factors or other estimation parameters for specific categories.
Literature sources
Inventory compilers commonly rely on the available literature to find emission factors or other estimation parameters. Table 2.2 lists a variety of potential literature sources in order of descending likelihood of the data being representative and appropriate for national circumstances. It is good practice, for countries to use their own, peer-reviewed, published literature because this should provide the most accurate representation of their country’s practices and activities. If there are no country-specific peer-reviewed studies available, then the inventory compiler can use IPCC default factors and Tier 1 methods as indicated by the decision trees in Volumes 2 to 5, or Tier 2 methods with data from Emission Factor Database (EFDB), or other literature values e.g., modelled/estimated energy data from international bodies that reflect national circumstances. The order of presentation in Table 2.2 is indicative only, and inventory compiler should assess each data source individually to make a determination of suitability. A literature review is a useful approach for gathering and selecting from among a variety of possible data sources. Literature reviews can be time-consuming because many lead to old data and in addition the use of conversion units may generate artificial differences. Journal papers can sometimes be accessible through web without a subscription and libraries may facilitate search and access. Specialised literature sources relevant to emission factors are:
• National and international testing facilities (e.g., road traffic testing facilities),
• Industrial trade associations (technical papers such as reports, guidelines, standards, sectoral surveys or similar technical material),
• National authorities with responsibility for regulating emissions from industrial processes.
Literature reviews should be fully documented so that the data used for the inventory is transparent (see Chapter 6, QA/QC and Verification). It is also helpful to record the sources not used, providing an explanation of why, to save time in later literature review activities.
TABLE 2.2
POTENTIAL SOURCES OF LITERATURE DATA
Literature Type Where to find it Comments
IPCC Guidelines IPCC website Provide agreed default factors for Tier 1 methods but may not be representative of national circumstances. IPCC Emission Factor
Database (EFDB)
IPCC website Described in more detail below. May not be representative of processes in your country or appropriate for key category estimates. EMEP/CORINAIR Emission Inventory Guidebook EEA (European Environment Agency website)
Useful defaults or for cross-checking. May not be representative of processes in your country or appropriate for key category estimates. International Emission
Factor Databases: USEPA
USEPA website Useful defaults or for cross-checking. May not be representative of processes in your country or appropriate for key category estimates. Country-specific data from
international or national peer reviewed journals
National reference libraries, environmental press, environmental news journals
Reliable if representative. Can take time to be published.
National testing facilities (e.g., road traffic testing facilities)
National laboratories Reliable. Need to make sure the factors are representative and that standard methods are used.
Emission regulating authority records and papers, or pollution release and transfer registries
Industrial process
regulating authority Regularly updated and plant-specific. Quality is dependent on the regulatory requirements, which may not extend to the methods used for
estimating/measuring. Industry, technical and trade
papers
Specific trade association Publications, libraries, and Web search
Sector-specific and up-to-date. QA/QC is needed to check for bias in data and to ensure the test conditions and measurement standards are understood.
Other specific studies, census, survey, measurement and monitoring data Universities (environmental, measurement and monitoring departments)
Need to make sure the factors are representative and that standard methods are used.
International Emission Factor Databases: OECD
OECD website Useful defaults or for cross-checking. May not be representative of processes in your country or appropriate for key category estimates. Emission factors or other
estimation parameters for other countries
National Inventory Reports from Parties to UNFCCC, other inventory
documentation, web search, national library
Appropriate for inventory use. Useful defaults or for cross-checking. May not be representative of processes in your country or appropriate for key category estimates.
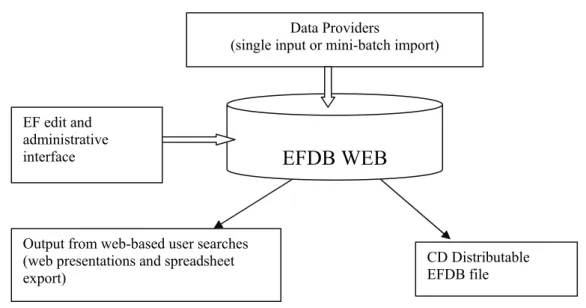
Data Providers
(single input or mini-batch import)
EFDB WEB
CD Distributable EFDB file Output from web-based user searches
(web presentations and spreadsheet export)
EF edit and administrative interface
IPCC Emission Factor Database
The Emission Factor Database (EFDB) is a continuously revised web-based information exchange forum for emission factors and other parameters relevant for the estimation of emissions or removals of greenhouse gases at national level. The database can be queried over the internet via the home pages of the IPCC, IPCC-NGGIP or directly at http://www.ipcc-nggip.iges.or.jp/EFDB/main.php.5 The IPCC distributes a CD-ROM with a copy of
the database and a query tool at regular intervals.6 It is designed as a platform for experts and researchers to
communicate new emission factors or other parameters to a worldwide audience of potential end users. The EFDB is intended to become a recognised library where users can find emission factors and other parameters with background documentation or technical references. The criteria for inclusion of data in the database (see Figure 2.2) are:
• Robustness: The value would be unlikely to change, within the accepted uncertainty of the methodology, if there were to be a repetition of the original measurement programme or modelling activity.
• Applicability: An emission factor can only be applicable if the source and its mix of technology, operating and environmental conditions and abatement and control technologies under which the emission factor was measured or modelled are clear, and allow the user to see how it can be applied.
• Documentation: Access information to the original technical reference is provided to evaluate the robustness and applicability as described above.
Figure 2.1 Process for including data in the EFDB
The EFDB invites experts and researchers all over the world to populate the EFDB with their data. The proposal of new emission factors (and other parameters) from data providers will be assessed by the Editorial Board of the EFDB for inclusion into the database. When the proposed new data comply with well-defined quality criteria of robustness, applicability and documentation they are included in the database. These procedures enable the user to judge the applicability of the emission factor or other parameter for use in their inventory and the responsibility of using this information appropriately however will always remain with the users.
5 Information, including manuals, on how to retrieve data from or contribute new data to the EFDB can also be found at this
web site.
Data obtained by measurements
This section applies the guidance in Section 2.2.2 to assessing the quality of measurement data for determination of emissions, emission factors and abatement or destruction efficiencies. Volume 4 provides specific guidance on the use of samples and surveys in Agriculture, Forestry, and Other Land Use (AFOLU) Sector.
In this approach the emissions can be determined directly (i.e., using continuous emission monitoring systems) or calculated. Where emissions depend on variable combustion, process and operating conditions, and technologies (e.g., methane and nitrous oxide from combustion), direct monitoring is likely to be the most accurate way to determine emissions.
When reviewing energy or industrial plant data, it is important to ensure that the measurements are representative of the specific activity and do not include extraneous components. For example stack measurements may exclude losses to the atmosphere through evaporation or poorly burned fuel (that is emitted as volatile organic compounds (VOC); these should be included in the reported emissions totals. More details of measurement issues are included in the Industrial Processes and Product Use (IPPU) Volume.
In implementing the elements of measurement programme identified in Section 2.2.2 is good practice to:
• distinguish between different components in a mixed fuel/raw material feed e.g., coal and wood in a mixed fuel boiler;
• specify how the chemical composition of fuels and raw materials should be determined from the analyses of samples taken from delivery trucks/tankers, pipelines, or stockpiles;
• ensure representative sampling of exhaust gases;
• use instruments with known performance characteristics or perform relative accuracy audits against established standard reference methods.
Most gas analysers determine the volume concentration of gaseous components (volume/volume) and so unless conditions can be shown to be stable it will be necessary to measure the exhaust gas flow rate, pressure, temperature, and water vapour content, so that the greenhouse gas emission can be converted to reference conditions for temperature and pressure (e.g., 273 K and 101.3 kPa, dry) or quoted on a mass emission basis. Other measurements are usually needed to calculate process specific conversion and oxidation efficiency factors and, if the fuel/raw materials used are not dry, a moisture analysis will be required. Related measurements should be made simultaneously, or in such a way that ensures the correct functional relationship between the variables being sampled, otherwise integrated flows or emissions derived from the measurements are likely to be incorrect.
It is good practice to use scales, and flow meters, that are of a known quality, calibrated, maintained, and regularly inspected, when using measurements to calculate activity rates e.g., from measured fuel or raw material feed rates (or sometimes from production data). Measurement equipment can be of variable quality and it is important that there is regular maintenance and calibration procedures in place and that these are subject to regular QA/QC review. When recording is carried out on a continuous basis it is good practice to monitor and record any time when meters are not working and the data capture rate is reduced – the advice on gap filling (in Section 2.2.3, Adapting data for inventory use) can, however, enable imperfect data sets to be repaired sufficiently for some purposes – such as the generation of emission factors.
It is also good practice, as part of the measurement programme to include in the scope of a monitoring protocol how and other measurements are to be carried out, if the fuel/raw materials are not dry or there are contaminants that could adversely affect the measurement process, moisture.
Quality management is an important factor to take into account. ISO 17025:2005 ‘General requirements for the competence of testing and calibration laboratories’ describes a useful QA/QC regime for testing and measurement. It encourages the use of standard methods by qualified personnel using suitability tested equipment. It also encourages a quality management system which should cover traceable calibration artefacts; taking and storing samples; any subsequent analysis; and the reporting of results. The standards listed in Table 2.3 are relevant to greenhouse gas emissions measurement and should be used where applicable.
TABLE 2.3
STANDARD MEASUREMENT METHODS FOR EXHAUST GAS
Existing international standard methods Other widely used standard methods4
CO2 ISO 12039:2001 Stationary source emissions -
Determination of carbon monoxide, carbon dioxide and oxygen - Performance characteristics and calibration of an automated measuring method 1
ISO 10396:2006 Stationary source emissions - Sampling for the automated determination of gas concentrations
US EPA Method 3 - Gas analysis for the determination of dry molecular weight
US EPA Method 3A - Determination of oxygen and carbon dioxide concentrations in emissions from stationary sources (instrumental analyser procedure)
N2O
ISO 11564:1998 Stationary source emissions - Determination of the mass concentration of nitrogen oxides - Naphthylethylenediamine photometric method
Standard being developed by ISO TC 264 – Air Quality
Gas velocity
ISO 10780:1994 Air Quality - Stationary source emissions - Measurement of velocity and volume flow rate of gas streams in ducts. S-Type pitot tube ISO 3966:1977 Measurement of fluid flow in closed conduits - velocity area method using Pitot static tubes 2. L-Type Pitot tube
ISO 14164:1999 Stationary source emissions. Determination of the volume flow rate of gas streams in ducts -automated method. Dynamic pressure method for continuous, in situ/crossduct, measurements
US EPA method 1 - Sample and velocity traverses for stationary sources
US EPA Method 1A - Sample and velocity traverses for stationary sources with small stacks or ducts US EPA Method 2 - Determination of stack gas velocity and volumetric flow rate (Type S pitot tube) (or alternatively Methods 2F, 2G, 2H and CTM-041)5
General 3
ISO/IEC 17025:2005 General requirements for the competence of testing and calibration laboratories ISO 10012:2003 Measurement management systems - Requirements for measurement processes and measuring equipment
PrEN 15259:2005 Air Quality – Measurement of stationary source emissions - measurement strategy, measurement planning and reporting, and design of measurement sites
EN61207-1:1994 Expression of performance of gas analyzers - Part 1 General
Standards under development
CH4 None US EPA Method 3C - Determination of carbon
dioxide, methane, nitrogen and oxygen from stationary sources (i.e., landfills)
Standard being developed by ISO TC 264 - Air Quality H2O
EN 14790 6
US EPA Method 4 - Determination of moisture content in stack gases
PFC, SF6,
HFC, FCs
None (N.B. Where available sector specific methodologies are referenced in the sector specific volumes)
1 This standard describes the performance characteristics, detection principles and the calibration procedures for automated measuring
systems for the determination of carbon dioxide and other substances in the flue gases emissions from stationary sources. The reported concentration range of this standard is 6 - 62500 mg m-3 with a measurement uncertainty of <10 percent of the measured value.
2 This standard has been withdrawn pending revision; nevertheless it is widely used in the absence of anything better.
3 While these standards are not associated with a reference method for a specific greenhouse gas category, they have direct application to
QC activities associated with estimations based on measured emission values.
4 US EPA Methods, e.g., Method 1, 1A, 2, 3, etc., are EPA test methods that are available in Title 40 of the Code of Federal Regulations
(CFR) Part 60, Appendices. These test methods are developed by the Office of Air Quality Planning and Standards in the Office of Air and Radiation. 40 CFR Part 60 is published each year by the Office of the Federal Register, and is available from the U.S. Government Printing Office. Although the test methods generally do not change from year to year, users should check for the most recent version of 40 CFR Part 60, Appendices.
5 Methods 2F and 2G correct the measured flow rates for angular (non-axial) flow. Method 2H (for circular stacks) and conditional test
method CTM-041 (for rectangular stacks and ducts) are used to correct the measured flow rates for velocity decay near the stack wall, using a ‘wall effects adjustment factor’.
2.2.5
Activity data
This section provides general advice for the production or review of activity data. This includes: • Information on specialised data sources,
• Conducting surveys and censuses,
• Where appropriate, the use of measurement related data.
It is good practice when producing suitable activity data to follow the stepwise approach to set priorities for action according to the importance of the sector, putting in place a strategy for accessing the data needed, collecting the data needed, and processing it to produce the data needed for inventory purposes. This section provides generic advice relevant to the choice of activity data to use.
Volumes 2-5 provide advice on the selection and use of activity data for specific categories. Data Sources
National and International Literature
As described in Section 2.2.1, it is preferable to use data from such bodies as National Statistical Agencies, and national regulatory authorities responsible for the permitting of industrial and other processes subject to pollution emission legislation.
There will be occasions, however, when other sources of specialised literature provide activity data i.e. UN statistics, US Geological Survey (USGS) reports on commodities, and technical reports, guidelines, standards, sectoral surveys issued by industrial trade associations.
Surveys & Census information
Survey and census information (see Box 2.2) provide the best agricultural, production and energy statistics that can be used for greenhouse gas inventories. Generally these data are compiled by national statistical agencies (NSA) or relevant ministries for national policy purposes or to comply with international demand for data, or other activities that are outside of the direct control of the inventory compiler although the needs of the inventory can sometimes trigger or influence surveys or censuses.
BOX 2.2
THE DIFFERENCE BETWEEN CENSUS AND SURVEY DATA
Survey data are derived from sampling and do not include real data for the whole population. Surveys should assess a representative sample (in the context of the survey purpose), so that the results can be expanded to provide an estimate of the full population. A survey could, for example, assess the number of animals in a country or region by surveying a discrete selection of farms and groups of farms in a country or region. Using more general surrogate data and assumptions would then derive the national or regional total.. Both the representativeness of the sample and the methods used to gross-up need careful review.
Census data are based on a complete count of the whole population, i.e., an actual count of all the animals in a region or country. A census is usually limited in detail and diversity to only the most important national statistics such as human and livestock population. It is expensive and time consuming and this is a significant limiting factor for specific national inventory applications. Often census data are used as a reliable surrogate for extrapolating survey data to national statistics.
Using existing census and survey data: In some countries the NSA is a single agency who is responsible for all national statistics, while in others the task is split among multiple agencies each of which collect official statistics related to their field, i.e., a country’s agriculture ministry may be responsible for carrying out agricultural surveys and censuses. This has the advantage that the ministry is likely to have the specialist knowledge required to define adequately the data to be collected and to have at their disposal the administrative information to help stratify and select the sample to be surveyed, for example, a register of businesses working in the area covered by the remit of the ministry. In these cases ministries may have their own statistics departments (or will work closely with any NSA) to provide the specialist with statistical knowledge, which is essential to avoiding many of the common pitfalls in data collection.
Where available these data sets can be used either directly (if they represent the geographical and sectoral coverage required) or as part of hybrid data set in combination with other information necessary to derive the detail and geographical coverage required.
Developing new Surveys: Developing new surveys, especially surveys of consumers or households, is relatively expensive because sample size and proper conduct of the fieldwork, data processing, analysis, and reporting are all demanding. Considerable effort would be required to check the reliability and consistency of data, even when response rates appear to be otherwise satisfactory. Unless they can be consistently repeated, surveys are only able to give measurements relating to one point in time. Bearing this in mind, and also taking into account the length of time such surveys take to design, execute and analyse - for the development of a major survey, planning typically starts about 18 months before data collection starts, with results available a year or more after the data collection period - attention should first be paid to the possibility of obtaining regular and consistent data from existing sources, such as recombining data collected for other purposes, or using administrative data. Where new data collection is unavoidable, the NSA and/or the relevant ministry can identify what surveys are ongoing or planned, and can explore the possibility of adding new questions or modules to these surveys to fill the data gaps. One of the many advantages of working with a NSA or ministry is that they will design the method of collection and the questionnaire to take into account the needs of as many users as possible. This reduces costs as well as the burden on businesses and other respondents, making it more likely that they will complete the questionnaire. Also, selecting the survey sample requires a reliable sampling frame, for example, census data or business registers. The NSA or relevant ministry will have ready access to such sources, and experience in using them. They will have teams of qualified and experienced statisticians, experts in sample selection, questionnaire design, data handling and verification, and the necessary software to process the data. They may also have teams of interviewers experienced in telephone or personal surveying. All of these factors contribute to the success of any survey and equally importantly, to keeping costs down.
General Guidelines for Planning Surveys & Census: It is good practice to plan each step with all subsequent steps in mind, from data collection, processing and analysis to dissemination of output. For example, the questionnaire and other data collection procedures should be developed only after thinking through how the data will be processed and analysed, and the nature of the statistical information that will eventually be reported. In particular, planning needs to cover:
• Budget issues: Costs will always be a major consideration. The total budget needs to be calculated and resources allocated to each phase of the process. Uncontrolled spending on each phase until the budget is depleted can lead to the collection of data without the necessary resources to produce and disseminate high quality output.
• Staffing issues, including management of the interviewer workforce: Staff resources need to be planned to ensure that people with the right skills are available at the appropriate times in all phases of the process. If interviewers are used rather than self-completion questionnaires, the interviewer workforce is likely to be the largest single cost in the collection.
• Project management and timetable issues: Good project management is essential to ensure a smooth-running collection. Adequate time needs to be allocated to each phase of the collection process. A thorough pre-testing of the questionnaire will help ensure that the data collected are reliable and valid.
The American Statistical Association’s brochure on how to plan a survey is a useful source of help when setting up a new survey, and can be downloaded from http://www.amstat.org/sections/srms/brochures/survplan.pdf. The UN’s guidelines for conducting household surveys in developing and transition countries provide detailed information on how to set up sample surveys based on direct questions to households, and can be found on http://unstats.un.org/unsd/HHsurveys/part1_new.htm. Another useful source is ‘Basic Steps in Conducting Surveys’, available at http://www.energy.ca.gov/marketinfo/documents/98-10_LANG2.PDF.
Moreover, many organisations contribute to statistical capacity building and will provide assistance to developing countries wishing to set up new surveys; the UNEP, UNDP, and the World Bank are the implementing agencies of the Global Environment Facility.
References to guidance for performing surveys or censuses for energy, industrial processes, agriculture, forestry and waste are given in the Annex 2A.2.
Three important steps are needed before deciding whether a survey is required, and what modules it should contain:
• Review what data are likely to be available through existing data systems, including planned surveys. Remember that published statistics are based on detailed data that have been treated and aggregated to draw out the information that is important to the main user. In some cases, depending on the size and structure of
the original sample, those raw data can be recombined in different ways to produce data that are appropriate for another user.
• Explore administrative sources of data. While the administrative records may not initially be easy to use for inventory purposes, once the system has been reorganised and restructured to produce the relevant data, it can become the regular source of the relevant information, at little marginal cost. More and more countries are beginning to realise the cost benefits of using administrative data for statistics, and in some cases, National Statistical Agencies (NSAs) are obliged by law to explore the use of administrative data to provide statistics before deciding to launch an expensive new survey.
• Explore the possibility of incorporating new questions or modules into existing surveys.
If, after exploring the possibility to make use of existing data, data gaps still remain, then approach the NSA or ministry about carrying out a new survey. Provided the financial resources are made available, the NSA or ministry will be able to provide the all-important expertise. Also explore whether other partners might be interested in sharing the work and resources needed for it.
References
Cullen A.C. and Frey H.C. (1999). The Use of Probabilistic Techniques in Exposure Assessment: A Handbook for Dealing with Variability and Uncertainty in Models and Inputs. Plenum: New York, 335 pages. Frey H.C. and Burmaster D.E. (1999). ‘Methods for characterizing variability and uncertainty: comparison of
bootstrap simulation and likelihood-based approaches,’ Risk Analysis, 19(1):109-130, February 1999. Frey H.C. and Rhodes D.S. (1996). ‘Characterizing, simulating, and analyzing variability and uncertainty: an
illustration of methods using an air toxics emissions example’, Human and Ecological Risk Assessment: an International Journal, 2(4):762-797, December 1996.
Annex 2A.1 A protocol for expert elicitation
Wherever possible, expert judgement should be elicited using an appropriate protocol. An example of a well-known protocol for expert elicitation, Stanford/SRI protocol, has been adapted and is described below.
• Motivating: Establish a rapport with the expert, and describe the context of the elicitation. Explain the elicitation method to be used and the reason it was designed that way. The elicitor should also try to explain the most commonly occurring biases to the expert, and to identify possible biases in the expert.
• Structuring: Clearly define the quantities for which judgements are to be sought, including, for example, the year and country, the source/sink category, the averaging time to be used (one year), the focus activity data, emission factor or, for uncertainty, the mean value of emission factors or other estimation parameter, and the structure of the inventory model. Clearly identify conditioning factors and assumptions (e.g., resulting emissions or removals should be for typical conditions averaged over a one-year period).
• Conditioning: Work with the expert to identify and record all relevant data, models, and theory relating to the formulation of the judgements.
• Encoding: Request and quantify the expert’s judgement. The specific qualification will differ for different elements and be present in the form of a probability distribution for uncertainty, and an activity or emission factor estimate for activity data and emission factors. If appropriately managed, information on uncertainty (probability density function) can be gathered at the same time as gathering estimates of activity or emission factor. The section on encoding in Chapter 3 describes some alternative methods to use for encoding uncertainty.
• Verification: Analyze the expert’s response and provide the expert with feedback as to what has been concluded regarding his or her judgement. Is what has been encoded really what the expert meant? Are there inconsistencies in the expert’s judgement?
Possible Biases in Expert Elicitation
Elicitation protocols should be designed to overcome the biases that can be introduced by the rules of thumb (sometimes called heuristics) that experts use when formulating judgements.
The most common unconscious biases introduced by rules of thumb are:
• Availability bias: This is basing judgements on outcomes that are more easily remembered.
• Representativeness bias: This is basing judgements on limited data and experience without fully considering other relevant evidence.
• Anchoring and adjustment bias: This is fixating on a particular value in a range and making insufficient adjustments away from it in constructing representative estimate.
To counteract the first two potential sources of biases, elicitation protocols should include a review of relevant evidence. In order to counteract the third potential source of bias, it is important to ask the expert to make judgments regarding extreme values first, before asking for judgments regarding the best estimate or central values for an uncertainty distribution.
There is also the possibility of more conscious biases:
• Motivational bias is a desire by an expert to influence an outcome or to avoid contradicting prior positions on an issue.
• Expert bias arises from an unqualified expert’s desire to appear as a true expert in the field. This would typically lead to overconfident estimates of uncertainty.
• Managerial bias is a situation in which an expert makes judgements that achieve organisational goals, rather than judgements that reflect the actual state of knowledge regarding an inventory input.
• Selection bias occurs when the inventory compiler selects the expert who tells it what it wants to hear. The best way to avoid these biases is to be careful in the selection of experts. Expert judgments can be elicited from individuals or groups. Groups can be useful for sharing knowledge and hence could be part of the motivation, structuring, and conditioning steps of the elicitation. However, group dynamics occasionally introduce other biases. Thus, it is usually preferable to elicit judgement on an individual basis. When eliciting judgments independently for a given quantity from two or more experts, it is possible that different views on distributions (or ranges) will be obtained. In some cases, the differences may not lead to a significant difference