Water deficit in bread wheat: Characterisation using genetic and physiological tools
177
0
0
Full text
(2) ii. DECLARATION. I declare that this thesis is my own account of my research and contains as its main content work which has not previously been submitted for a degree at any tertiary education institute.. Chapter 5 was published in the journal of Molecular Breeding.. Another MS combined Chapters 3 and 6 was submitted to the journal of New Phytologist.. Jingjuan Zhang.
(3) iii. ABSTRACT Under terminal water deficit, the impact of stem carbohydrate remobilization has greater significance because post-anthesis assimilation is limited, and grain growth depends on translocation of carbohydrate reserves. The working hypothesis of this thesis is that increases in stem carbohydrates facilitate tolerance to terminal drought in wheat. The goals of this thesis are to examine this hypothesis using physiological and genetic tools; identify genes that are related to QTL for stem carbohydrate; work with wheat and barley breeders to integrate findings into the breeding program of the Department of Agricultural and Food Western Australia.. The physiological data of three drought experiments (two years in a glasshouse and one year in the field) suggested the maximum level of stem water soluble carbohydrate (WSC) is not consistently related to grain weight, especially, under water deficit. The patterns of WSC accumulation after anthesis differed depending on variety and suggested that WSC degradation and translocation have different genetic determinants.. Most of the carbohydrates in stem WSC in wheat are fructans. Because 1-FEH gene was an important gene in fructan degradation, the three copies of this gene (1-FEH w1, 1FEH w2 and 1-FEH w3) were isolated from the respective genomes of bread wheat. In addition, the genes were mapped to chromosome locations and coincided with QTL for grain weight. The results of gene expression studies show that 1-FEH w3 had significantly higher levels in the stem and sheath which negatively corresponded to the level of stem WSC in two wheat varieties in both water-deficit and well-watered.
(4) iv treatments. Strikingly, the 1-FEH w3 appeared to be activated by water deficit in Westonia but not in Kauz. The results suggest that stem WSC level is not, on its own, a reliable criterion to identify potential grain yield in wheat exposed to water deficit during grain filling. The expression of 1-FEH w3 may provide a better indicator when linked to instantaneous water use efficiency, osmotic potential and green leaf retention, and this requires validation in field grown plants. In view of the location of the contribution to grain filling of stem WSC, this is a potential candidate gene contributing to grain filling. The numerous differences of intron sequences of 1-FEH genes would provide more opportunities to find markers associated with the QTL.. A new FEH gene was partially isolated from Chinese Spring and the sequence was closely related to 1-FEH genes. This gene, FEH w4, was mapped to 6AS using Chinese Spring deletion bin lines. The polymorphism of this gene was found between different bread varieties using PCRs and RFLPs, and this allowed the gene to be mapped to two populations of Hanxuan 10 × Lumai 14 and Cranbrook × Halberd. In the population of Hanxuan 10 × Lumai 14, it was close to SSR marker xgwm334 and wmc297 where the QTL of thousand grain weight and grain filling efficiency were located. This result indicated this gene might be another possible candidate gene for grain weight and grain filling in wheat..
(5) v. ACKNOWLEDGEMENTS This thesis was completed between March 2005 and August 2008 during full-time study in the Faculty of Sustainability, Environmental and Life Sciences, Murdoch University.. I would like to take this opportunity to thank the people who have helped me. First of all, I would like to express my sincerest gratitude to my supervisors, Professor Rudi Appels and Professor Bernard Dell, for their continuous guidance, assistance, teaching and encouragement. Their supervision has made a significant contribution to the writing of this thesis.. Secondly, I would like to thank Dr. John Fosu-Nyarko, Dr. Meredith McNeil, Mrs. Irene Waters, Ms. Paula Moolhuijzen and Dr. Elisabeth Conocono. They taught me many technical skills. And also I would like to give my gratitude to Ms. Sharon Westcott, Mrs. Dora Li, Ms. Fiona Drake-Brockman, Mrs. Gabrielle Devlin, Ms. Julie Uhlmann, Ms. Esther Walker, Ms. Vera Limadinata, Mr. Dave Hodgson, Dr. Dave Berryman, Mrs. Frances Brigg and Ms. Claudia Mueller for their help.. Thirdly, I give my gratitude to Dr. Tim Setter, Dr. Michael Francki and Dr. Mehmet Carkir for their help.. Lastly, I thank my husband Dr. Shaobai Huang and my daughter Mengyuan Huang for their support..
(6) vi. LIST OF ABBREVIATIONS (Remaining abbreviations are in the text) +. and. ×. cross. 3'. Hydroxyl-terminus of DNA molecule. 5'. Phosphate-terminus of DNA molecule. ABA. Abscisic acid. ABRE. ABA-responsive element. AP2. Apetala2. AREB. ABA-responsive element binding. AUD. Australian Dollar. bZIP. Basic leucine zipper. CBF. C-repeat binding factor. cDNA. Complementary DNA. CRT. C-Repea T. DH. Double haploid. Dnase. Deoxyribonuclease. DREB. Dehydration-responsive element binding. E.coli. Escherichia coli. EDTA. Ethylenediamine tetraacetic acid. ERD. Early-responsive to dehydration. ERF. Ethylene-responsive factor. EST. Expressed sequence tag. FEH. Fructan exohydrolases. FFT. Fructan fructan transferase. GAPDH. Glyceraldehydes-3-phosphate dehydrogenase. GH. Glycoside hydrolases. HB. Homeobox. HD-ZIP. Homeodomain-leucine zipper. IWUE. Instantaneous water use efficiency. LB. Luria-Bertani.
(7) vii LEA. Late embryogenesis abundant. MPa. Megapascal. mRNA. Messenger ribonucleic acid. MYB. Myeloblastosis oncogene. MYC. Myelocytomatosis oncogene. NAC. N-acetyl cysteine. NSC. Non-structural carbohydrates. OA. Osmotic adjustment. OP. Osmotic potential. PCR. Polymerase chain reaction. PEG. Polyethylene glycol. PI. Proteinase inhibitors. pI. Isoelectric point. PV. Paraffin and Vaseline. qRT-PCR. Quantitative reverse transcription PCR. QTL. Quantitative trait loci. RFLP. Restrict fragment length polymophism. RNase. Ribonuclease. RWC. Relative water content. SDS. Sodium dodecyl sulfate. SE. Standard error. SFT. Sucrose fructan transferase. Sps. Sucrose phosphate synthase. SSS. Soluble starch synthasis. SST. Sucrose sucrose transferase. Sus. Sucrose synthase. Taq. Thermus aquaticus DNA plymerase. TBE. Tris-Boric-EDTA buffer. TE. Tris-EDTA. WSC. Water soluble carbohydrates. WUE. Water use efficiency. Ψsoil. Soil water metric potential.
(8) viii. TABLE OF CONTENTS. DECLARATION. ii. ABSTRACT. iii. ACKNOWLEDGEMENTS. v. LIST OF ABBREVIATIONS. vi. TABLE OF CONTENTS. viii. Chapter 1: General introduction and aims. 1. 1.1 The significance of water deficit tolerance in wheat breeding. 1. 1.2 The gaps of knowledge and the aims of the thesis. 3. Chapter2: Literature review. 5. 2.1 Water deficit in different growth stages of plant. 5. 2.2 Products of the drought-inducible genes. 8. 2.3 Drought stress signal transduction in plants. 10. 2.4 Carbohydrate and drought stress. 14. 2.4.1 The distribution and translocation of carbohydrate. 14. 2.4.2 Water deficit accelerates the translocation of carbohydrate to 15 seeds 2.4.3 Soluble carbohydrate plays an important role under abiotic 16 stress.
(9) ix. 2.4.4 Model for plant fructan biosynthesis. 17. 2.4.5 Key factors in the regulation of fructan synthesis and breakdown. 20. 2.4.6 External influence on fructan concentration. 24. 2.5 Drought tolerant phenotypes. 25. 2.5.1 Genotypic variation in WSC (sucrose and fructan) concentration in response to drought. 25. 2.5.1.1 The inconsistent correlation between the level of WSC and grain yield in wheat in response to drought. 25. 2.5.1.2 The genotypic variation in WSC (sucrose and fructan) 28 in other species 2.5.2 Other phenotypes related to drought tolerance. 29. 2.5.2.1 Plant Size. 29. 2.5.2.2 Root system. 30. 2.5.2.3 Leaf water potential and osmotic potential. 31. 2.5.2.4 Green leaf retention. 32. 2.5.2.5 Water use efficiency. 33. 2.5.2.6 Canopy temperature. 33. 2.6 Quantitative trait loci (QTL) related to drought tolerance. 34. 2.6.1 QTL of drought tolerance and high yield in wheat. 34. 2.6.2 QTL of drought tolerance and high yield in barley. 36. 2.6.3 QTL of drought tolerance and high yield in rice. 40. 2.6.4 QTL of drought tolerance and high yield in ryegrass. 44.
(10) x. 2.7 Summary. 44. Chapter 3: Accumulation and remobilization of stem water soluble carbohydrate differs with wheat genotype 46 under terminal water stress 3.1 Introduction. 47. 3.2 Materials and methods. 48. 3.2.1 Experiment design and cultivars. 48. 3.2.2 Water deficit protocol. 49. 3.2.3 Plant harvest. 51. 3.2.4 Carbohydrate analysis. 52. 3.2.5 Leaf water relation. 52. 3.2.6 Green leaf retention. 53. 3.2.7 Photosynthesis. 53. 3.2.8 Statistical analysis. 54. 3.3 Results. 54. 3.3.1 The absolute grain weight and the ratio of grain weight in 54 well-watered and water-deficit plants 3.3.2 Physiological responses to water deficit 3.3.2.1 Green leaf retention. 56 56. 3.3.2.2 Photosynthesis and instantaneous water use efficiency 57 (IWUE) 3.3.2.3 Main stem and flag leaf osmotic potential. 58.
(11) xi. 3.3.2.4 Peduncle length 3.3.3 Stem water soluble carbohydrate concentration in relation to grain dry weight 3.4 Discussion 3.4.1 Genotype variation in response to water deficit. 59 61 65 65. 3.4.2 Inconsistent relationship between the stem WSC and grain 67 weight 3.4.3 Peduncle proportion of wheat stem related to WSC 68 mobilization. Chapter 4: Pattern of stem water soluble carbohydrate in wheat 70 varieties under terminal drought in the field 4.1 Introduction. 71. 4.2 Materials and methods. 71. 4.2.1 Cultivars. 71. 4.2.2 Drought treatment. 71. 4.2.3 Plant harvest and physiological parameter measurement. 73. 4.3 Results. 73. 4.3.1 Levels of drought stress. 73. 4.3.2 Physiological response to field water deficit. 74. 4.3.2.1 Green leaf retention. 74. 4.3.2.2 The root depth and proportion of peduncle length in 76 relation to the drought stress response 4.3.3 The pattern of stem WSC concentration and related dry grain 77 weight 4.4 Discussion. 80.
(12) xii. 4.4.1 Depression in grain weight in the late anthesis variety. 80. 4.4.2 Differences in WSC levels between field and glasshouse 80 water-deficit treatments 4.4.3 Stem WSC level and grain weight. 81. 4.4.4 Green leaf retention, deep roots and high peduncle proportion 82 related to drought tolerance. Chapter 5: The genome structure of the 1-FEH genes in wheat: New markers to track stem carbohydrates and grain 84 filling QTL in breeding 5.1 Introduction. 85. 5.2 Materials and methods. 85. 5.2.1 Plant materials, growth conditions and sampling. 86. 5.2.2 Database searches and sequence alignment. 86. 5.2.3 Genomic Southern hybridization analysis. 87. 5.2.4 Primer design, PCR amplification of genomic DNA and 87 cloning 5.2.5 RNA extraction and real time PCR. 89. 5.2.6 Carbohydrate analysis. 90. 5.3 Results 5.3.1 1-FEH gene copy number and chromosome location. 90 90. 5.3.2 1-FEH gene structure from the AA genome and 6A of 93 Chinese Spring 5.3.3 1-FEH gene structure on the BB genome and 6B of Chinese 97 Spring 5.3.4 1-FEH gene structure on the DD genome and 6D of Chinese 98 Spring.
(13) xiii 5.3.5 Comparison of 1-FEH-6A (1-FEH w1), 1-FEH-6B (1-FEH 100 w3) and 1-FEH-6D (1-FEH w2) genes 5.3.6 Correlation of water soluble carbohydrate concentration and 103 FEH gene expression pattern 5.4 Discussion. 106. 5.4.1 Identification of 1-FEH gene structure and chromosome 106 location 5.4.2 1-FEH mRNA levels during fructan remobilization and grain 107 filling. Chapter 6: Water deficits in wheat: fructosyl exohydrolase (1FEH) mRNA expression and relationship to soluble 111 carbohydrate concentrations in two varieties 6.1 Introduction. 112. 6.2 Material and methods. 113. 6.3 Results. 113. 6.3.1 Correlation of water soluble carbohydrate concentration and 113 FEH gene expression pattern 6.4 Discussion. 115. Chapter 7: A novel FEH like gene partially isolation in wheat: A new marker to track thousand grain weight QTL in 117 breeding 7.1 Introduction. 118. 7.2 Materials and methods. 119. 7.2.1 Plant materials, growth conditions and sampling. 119. 7.2.2 Database searches and sequence alignment. 120. 7.2.3 Genomic Southern hybridization analysis. 120. 7.2.4 Primer design, PCR amplification of genomic DNA and 120 cloning.
(14) xiv. 7.3 Results. 121. 7.3.1 1-FEH gene copy number and chromosome location. 121. 7.3.2 FEH w4 gene polymorphisms among bread wheat varieties. 122. 7.3.3 FEH w4 location on the map of two populations. 124. 7.3.4 FEH w4 gene structure from the AA genome and 6A of 126 Chinese Spring 7.3.5 FEH w5 gene structure on 6D of Chinese Spring 7.4 Discussion. 128 130. 7.4.1 Identifying FEH gene structure using comparative genomics. 130. 7.4.2 1-FEH enzyme sequence comparison. 130. 7.4.3 Functions and regulation of FEHs in fructan plants. 134. Chapter 8: General Discussion. 135. 8.1 A modified hypothesis relating stem carbohydrate to water deficit tolerance. 135. 8.2 Terminal water deficit and the remobilization of stem reserves. 136. 8.3 The correlation between the genome location of 1-FEH genes and 140 the QTL 8.4 Grain yield selection. 141. 8.5 Drought escape. 143. 8.6 Future work. 144. References. 147.
(15) 1. Chapter 1: General introduction and aims 1.1. The significance of water deficit tolerance in wheat breeding. Wheat is a temperate cereal crop grown primarily for its grain. It is planted in 17% of the world’s cultivated land, equivalent to 220 million hectares and is the staple food of 35% of the world’s population (Kronstad, 1996). Australia contributes only 3.2% of world wheat production but is responsible for 13% of world trade because more than 80% of Australian wheat is exported (Perry, 1992). Almost half of the wheat produced in Australia comes from Western Australia (WA) (Setter et al., 1998).. The most common factor affecting wheat production and grain quality in Australia is water deficit – “drought.” Drought and heat are considered the top priority among 15 abiotic stresses affecting wheat production across the entire state of WA (Setter, 2000). Shallow duplex soils account for 60% of the WA cropping area and means wheat produced in this area is particularly exposed to drought (McFarlane et al., 1989; Setter and Belford, 1990; Setter and Waters, 2003). The cost of a recent drought (2002/03), in terms of lost production, was approximately $ 1.0 billion (AUD).. In many countries there is competition between the rural and urban population for access to water. In agriculture, water availability is an increasing problem whether in irrigated or rainfed production systems. Due to the higher demands for food and reduced water for irrigation as well as the increasing frequency and severity of drought conditions, the.
(16) 2 impact of droughts or of reduced availability of irrigation water can be mitigated by a broad variety of agronomic practices to conserve water. In addition, it is possible to exploit the range of genetic variation for drought tolerance and water use efficiency, and well-adapted wheat lines are now available to farmers. The tools of modern agricultural science, in particular of functional genomics, present a new opportunity to bring together conventional plant breeding and molecular approaches to select and combine optimum pathways for water deficit tolerance and maximise water use efficiency.. High water use efficiency, a deep root system, osmotic adjustment and green leaf retention, have been argued to confer drought tolerance but remain controversial (Fukai and Cooper, 1995). Adaptive traits such as the accumulation of high concentrations of stem carbohydrates, mainly fructan (Blacklow et al., 1984; Kühbauch and Thome, 1989), at flowering enable plants to escape some of the adverse effects of reduced carbon assimilation during grain filling. This is particularly relevant to the Western Australia environment and hence was focused in this thesis. Simulation modelling has shown that this trait is associated with increases in grain production by up to two-fold relative to crops with low shoot carbohydrates (Setter et al., 1998). This trait has been experimentally demonstrated to be an adaptive trait in wheat exposed to terminal drought in the rainfed wheat belt of Western Australia where over 130 genotypes have been evaluated for up to 6 years in multilocational field trials (Setter, 2002; and unpublished data). Foulkes et al. (2007a) and Shearman et al. (2005) suggested that greater stem water soluble carbohydrate (WSC) storage could be important for wheat breeding progress in yield potential in future years as well as optimized rooting traits, an extended stemelongation phase, greater radiation-use efficiency and optimized ear morphology..
(17) 3 1.2. The gaps of knowledge and the aims of the thesis. It should be noted that a direct correlation between the observed fructan accumulation and drought tolerance has not been unequivocally shown (Evans and Wardlaw, 1996; Ehdaie et al., 2006a and b; Ruuska et al., 2006). Furthermore, factors influencing the stem WSC levels have not been identified. For studies on the physiological role of fructan metabolism in plants, fructosyltransferase genes are important and the genes have been transformed into several different plant species. These studies suggested that fructosyltransferase was not sufficient for fructan synthase, and that other additional activities maybe required (Vijn and Smeekens, 1999). There was a weak positive correlation (r2=0.35-0.38) between fructan concentration and fructosyltransferase activity across development in the stems of both rainfed and irrigated wheat (Goggin and Setter, 2004). Goggin and Setter (2004) suggested that fructan exohydrolases (FEHs) may play more of a role in the rate of net fructan accumulation than fructosyltransferases. Moreover,. sucrose. can. act. as. an. activator/substrate. [sucrose:. sucrose. 1-. fructosyltransferase (1-SST) and sucrose: fructan 6-fructosyltransferase (6-SFT)] or inhibitor (fructan exohydrolases) of fructan synthesis (Van den Ende et al., 2003a). Hence, the concentration of fructan is not only controlled by the fructosyltransferase and exohydrolase enzymes, but also is affected by the concentration of sucrose (Le Roy et al., 2007).. The working hypothesis of this thesis is that increases in stem carbohydrates facilitate tolerance (high grain yield) to terminal drought in wheat. The aims of this thesis are to:.
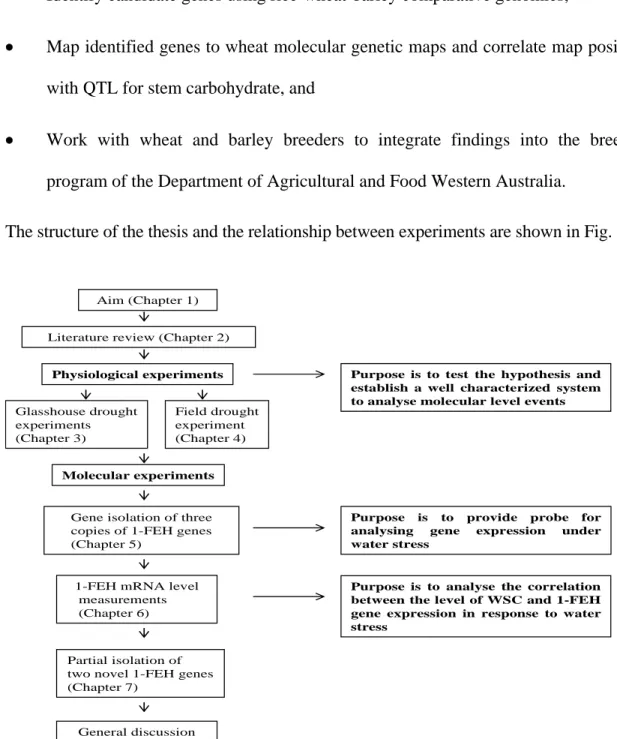
(18) 4 •. Test the hypothesis,. •. Investigate the role of FEH in fructan levels,. •. Identify candidate genes using rice-wheat-barley comparative genomics,. •. Map identified genes to wheat molecular genetic maps and correlate map positions with QTL for stem carbohydrate, and. •. Work with wheat and barley breeders to integrate findings into the breeding program of the Department of Agricultural and Food Western Australia.. The structure of the thesis and the relationship between experiments are shown in Fig. 1.1.. Aim (Chapter 1) Literature review (Chapter 2) Physiological experiments Glasshouse drought experiments (Chapter 3). Purpose is to test the hypothesis and establish a well characterized system to analyse molecular level events. Field drought experiment (Chapter 4). Molecular experiments. Gene isolation of three copies of 1-FEH genes (Chapter 5). 1-FEH mRNA level measurements (Chapter 6). Purpose is to provide probe for analysing gene expression under water stress. Purpose is to analyse the correlation between the level of WSC and 1-FEH gene expression in response to water stress. Partial isolation of two novel 1-FEH genes (Chapter 7). General discussion (Chapter 8). Fig. 1.1 The structure of the thesis and the relationship between experiments..
(19) 5. Chapter 2: Literature review 2.1 Water deficit in different growth stages of the plant. There are three broad periods during plant development that are useful when considering the effects of water deficit (Fukai and Cooper, 1995): 1) early-season drought in the seedling stage; 2) water deficit at the vegetative stage; 3) late water deficit which affects grain filling, particularly in late maturing genotypes (Fig. 2.1).. Grain filling. Vegetative stage. Seedling emergence. Days after sowing. 0. 30. 60. 90. 120. Fig. 2.1 Drought types during wheat development.. In the seedling stage, the early vigour of plants becomes very important and the expanded leaves are able to cover the soil surface and reduce evaporation (Richards et al., 2001). Therefore, the speed of plant growth is a key factor at this stage. Traits contributing to increase seedling vigour would be broad seedling leaves, embryo size, specific leaf area and large coleoptiles (Richards et al., 2001). Selection for long.
(20) 6 coleoptiles allows seed to be sown deeper and thus makes better use of stored soil moisture (Rebetzke et al., 2007).. In the vegetative stage of growth, stomata can be closed to reduce transpiration and conserve water. Stomatal closure includes passive responses due to loss of water through evaporation and active responses due to the reduction in the solute content of the guard cells. Abscisic acid (ABA) is implicated in stomatal hydroactive closure (Taiz and Zeiger, 2002). Water stress can also limit leaf expansion and photosynthesis (Taiz and Zeiger, 2002; Hassan, 2006). As stomata close during early stages of water stress, water use efficiency may increase and more CO2 may be taken up per unit of water transpired. As stress becomes severe, mesophyll metabolism is impaired, the dehydration of mesophyll cells inhibits photosynthesis and water use efficiency usually decreases.. At the vegetative stage, pale colour of leaves, wax on the leaf surface, and optimized angle of the leaf would affect the temperature on the leaf surface and reduce evaporation. The size of the plant is important as plants with large biomass are more susceptible to dehydration compared to smaller plants (Blum et al., 1997b).. Turning to roots, drought stress enhances root extension into deeper, moist soil (Fukai and Cooper, 1995). Varieties with deep roots have been selected for drought tolerance (Fukai and Cooper, 1995; Price et al., 1997). At the early stage of drought stress, osmotic adjustment might contribute to plant survival. Most of the adjustment can usually be accounted for by increases in the concentration of a variety of common solutes, including sugars, organic acids, amino acids, and inorganic ions (especially K+). Osmotic adjustment can maintain turgor and root growth at lower water.
(21) 7 potentials. Some studies have shown that osmotic adjustment promotes dehydration tolerance but does not have a major effect on productivity (McCree and Richardson, 1987).. In the reproductive and grain filling stage of wheat growth, responses similar to those in vegetative stages are likely to occur, for example, stomatal closure, photosynthesis limitation, osmotic adjustment, ABA accumulation and root elongation (Fig. 2.2). Water-deficit at flowering can lead to male sterility (Blum, 2007a) which reduces the seed number. When drought stress becomes severe, it might directly affect translocation, because phloem transport depends on turgor. However, in sorghum, experiments have shown that translocation is unaffected until late in the stress period, when other processes, such as photosynthesis, have already been strongly inhibited (Taiz and Zeiger, 2002). This relative insensitivity of translocation to stress allows plants to mobilize and use reserves where they are needed (eg. in seed fill), even when stress is severe. The ability to continue translocation of assimilates is a key factor in almost all aspects of plant tolerance to drought (Taiz and Zeiger, 2002). Some short season varieties complete their life cycles during the wet season, before the onset of drought. Thus, drought stress at grain filling would have less effect on short season varieties, as they might be able to escape drought (Taiz and Zeiger, 2002; Blum, 2007b).. In the wheat fields of WA, water deficit intensifies from anthesis to about 4 weeks later and severe drought usually occurs from a month after anthesis to maturity (Conocono, 2002). Terminal drought is a major problem for wheat production in WA as well as in other parts of Australia and the improvement of drought tolerant varieties in wheat is a priority for research..
(22) 8. Low Humidity High Temperature Hight Light intensity. Long –Term Responses ¾Shoot Growth Inhibition ¾Decreased Photosynthesis ¾Reduced Transpiration Area ¾Gene Responses ¾Metabolic Acclimation ¾Osmotic Adjustment ¾Increased ABA. Short –Term Responses ¾Root Signal Recognition ¾Gene Responses ¾Inhibition of Growth ¾Signal Transport ¾Xylem Hydraulic Changer ¾Assimilate Transport ¾Root Signal Recognition ¾Stomatal Closure ¾Decreased C Accumulation ¾Increased ABA ¾Multi-stress Sensing ¾Gene Responses. ¾Turgor Maintenance ¾Sustained Root Growth Soil drying ¾Increased Ratio of Root/Shoot ¾Increased Absorption Water Deficit Soil compaction. Root Responses ¾Cell Drought Signaling ¾Gene Responses ¾Osmotic Adjustment. Fig. 2.2 Plant physiological and biochemical responses to drought during reproductive and grain filling. Left: long-term or acclimation response; right: short-term responses (modified from Chaves et al., 2003). 2.2 Products of drought-inducible genes. The products of the drought-inducible genes identified in the literature can be classified into two groups (Shinozaki et al., 2003; Fig. 2.3). The first group (functional proteins) includes proteins that most probably function in abiotic stress tolerance. These include molecules such as chaperones, late embryogenesis abundant (LEA), osmotic, antifreeze proteins, mRNA-binding proteins, key enzymes for osmolyte biosynthesis, water channel proteins, sugar and proline transporters,.
(23) 9 detoxification enzymes, various proteases and proteinase inhibitors. The second group is comprised of regulatory proteins, for example, protein factors involved in further regulation of signal transduction and stress-responsive gene expression, protein kinases, protein phosphatases, enzymes involved in phospholipid metabolism and other signalling molecules such as calmodulin-binding protein.. Regulatory proteins. Functional proteins Water channels Transporters Detoxification enzymes Protection factors of macromolecules (LEA proteins, chaperones). Drought. Transcription factors (DREB2, AREB, MYC, MYB, bZIP, NAC, HB etc.) Protein kinases Phosphatases Phospholipid metabolism. Key enzymes for osmolyte biosynthesis (proline, sugars) ABA biosynthesis Proteases Proteinase inhibitors. Fig. 2.3 Function of drought stress-inducible genes in stress tolerance and response. Gene products are classified into two groups. The first group includes proteins that probably function in stress tolerance (Functional proteins), and the second group contains protein factors involved in further regulation of signal transduction and gene expression that probably function in stress response (Regulatory proteins) ( Shinozaki and Yamaguchi-Shinozaki, 2007). Proteinase inhibitors (PI) constitute a large and complex group of plant proteins and have an enormous diversity of function by regulation the proteolytic activity of their target proteinases, resulting in the formation of a stable protease inhibitor complex (Leung et al., 2000). A putative chymotrypsin inhibitor gene, Oryza sativa chymotrypsin inhibitor-like 1 (OCPI1), which belongs to the serine PI family, was isolated from rice (Callis, 1995; Huang et al., 2007). The expression of OCPI1 was strongly induced by dehydration stresses and ABA (Huang et al., 2007). The positive transgenic plants (OCPI1 was over-expressed) had significantly higher grain yield and seed setting rate than the wild type and the negative transgenic control (no over-expression of the transgene) under the severe drought stress conditions, whereas the potential yield of transgenic plants under normal growth conditions was not affected..
(24) 10 It is noted that the majority of studies of drought-inducible genes have not been studied in field grown material and their relevance to ‘field drought’ is thus unknown. Many are likely to relate to desiccation tolerance and survival, and may not have any economic relevance. Genes identified need to be further verify in field.. 2.3 Drought stress signal transduction in plants. Drought stress signal transduction consists of ionic and osmotic signalling pathways, detoxification (e.g. damage control and repair) response pathways and pathways for growth regulation (Zhu, 2002). Osmotic stress activates several protein kinases for example, mitogen-activated kinases, which may mediate osmotic homeostasis and/or detoxification responses (Zhu, 2002). Some particular genes induced by stress encode key enzymes regulating biosynthesis of compatible solutes such as amino acids (e.g. proline), quaternary and other amines (e.g. glycinebetaine and polyamines), and a variety of sugars and sugar alcohols (e.g. mannitol, trehalose, galactinol and raffinose) (Ramanjulu and Bartels, 2002; Zhang et al., 2004; Bartels and Sunkar, 2005; Umezawa et al., 2006). One early response to drought and other stress (e.g. cold and salinity stress) is a transient increase in cytosolic Ca2+, derived from either influx from the apoplastic space or release from internal stores (Sanders et al., 1999; Knight, 2000). Internal Ca2+ release is controlled by a ligand-sensitive Ca2+ channel (Xiong et al., 2002). Under osmotic stress, changes in phospholipid composition can be detected in plants as well as in other organisms (Munnik et al., 1998). However, during exposure to stress, the major role of phospholipids, the backbone of cellular membranes, may be to serve as precursors for the generation of regulator molecules (Xiong et al., 2002). Abscisic acid biosynthesis is regulated by osmotic stress that modify constitutively expressed transcription factors, leading to the expression of.
(25) 11 early response transcriptional activators, which then activate downstream stress tolerant effector genes (Zhu, 2002).. Cold. Drought, salt stress. Signal perception Signal transduction. IP3. Ca2+. ABA ABA dependent. ABA independent Transcription DREB1/CBF factors (AP2/ERF). DREB2 (AP2/ERF). Cis-acting elements. DRE/CRT (G/ACCGAC). Gene expression. RD29A. Gene function. NAC HD-ZIP. MYB2, MTC2 (MYB, MYC). NAC (RD26). MYBRS, MYCRS (YAACR, CANNTG) ERD1. RD22. AREB/ABF (bZIP). ABRE (ACGTCCC) Gly. RD29B, RD20A. Gene production involved in stress response and tolerance. Fig. 2.4 Transcriptional regulatory networks of abiotic stress signals and gene expression. At least six signal transduction pathways exist in drought, high salinity, and cold-stress responses: three are ABA independent and three are ABA dependent. In one of the ABA-independent pathways, DRE is mainly involved in the regulation of genes not only by drought and salt but also by cold stress. DREB1/CBFs are involved in cold-responsive gene expression. DREB2s are important transcription factors in dehydration and high salinity stress-responsive gene expression. The NAC and HD-ZIP transcription factors are involved in ERD1 gene expression. In the ABAdependent pathway, ABRE functions as a major ABA-responsive element. AREB/ABFs are AP2 transcription factors involved in this process. MYB2 and MYC2 function in ABA-inducible gene expression of the RD22 gene. The RD26 NAC transcription factor is involved in ABA responsive gene expression in stress responses (Shinozaki and Yamaguchi-Shinozaki, 2007; Xiong et al., 2002). IP3, inositol 1,4,5-trisphosphate (second messenger). Stress-responsive genes are regulated by both ABA-dependent and ABA-independent processes. At least six signal transduction pathways exist in drought, high salinity, and cold-stress responses: three are ABA independent and three are ABA dependent (Shinozaki and Yamaguchi-Shinozaki, 2007). The promoter of drought, high salinity,.
(26) 12 and cold inducible genes, RD29A/COR78/LT178, contains two major cis-acting elements, ABRE (ABA-responsive element) and DRE (Dehydration-responsive element)/CRT (C-RepeaT), which function in ABA-dependent and ABA-independent gene expression, respectively, in response to abiotic stress (Fig. 2.4; YamaguchiShinozaki and Shinozaki, 1994, 2005). The DREB1/CBF transcription factor belongs to the AP2/ERF family and most of DREB1/CBF target genes contain the conserved DRE motif (A/G)CCGACNT sequence in their promoter regions. The target gene products of these proteins are consequently involved in establishing stress tolerance (Ito et al., 2006; Shinozaki and Yamaguchi-Shinozaki, 2007). The DREB2 genes are induced by water deficit and may activate other genes involved in drought stress tolerance (Liu et al., 1998). The ERD1 gene is not only induced by dehydration but is also up-regulated during natural and dark-induced senescence (Nakashima et al., 1997). The promoter of the ERD1 gene contains cis-acting element(s) involved not only in ABA-independent stress-responsive gene expression but also in senescenceactivated gene expression (Simpson et al., 2003). DNA-binding proteins interacting with these cis-elements were identified as NAC transcription factors (Tran et al., 2004).. ABRE is a major cis-acting element in ABA-responsive gene expression (Fig. 2.4). Two ABRE motifs are important cis-acting elements controlling ABA-responsive expression of the Arabidopsis RD29B gene (Uno et al., 2000). Two basic leucine zipper (bZIP) transcription factors, AREB/ABF, can bind to ABRE, thereby activating ABA-dependent gene expression (Choi et al., 2000; Uno et al., 2000). RD22 gene is mediated by ABA and requires protein biosynthesis for its ABAdependent expression. A MYC transcription factor, AtMYC2 (RD22BP1), and a MYB transcription factor, AtMYB2, were shown to bind cis-elements in the RD22.
(27) 13 promoter and co-operatively activate RD22 (Abe et al., 1997, 2003; Fig. 2.4). Overexpression of both AtMYC2 and AtMYB2 not only resulted in an ABAhypersensitive phenotype but also improved osmotic stress tolerance of the transgenic plants (Shinozaki and Yamaguchi-Shinozaki, 2007). A drought–inducible RD26 gene encoding NAC transcription factor was identified (Fujita et al., 2004) and expression of this RD26 NAC transcription factor gene is induced by drought, high salinity and ABA.. In addition, ABA is critical during the second phase (Fig. 2.1) of seed development and promotes the accumulation of stored reserves, embryo maturation and the prevention of early germination (Phillips et al., 1997; Brocard-Gifford et al., 2003). The ABA content in grain was greatly enhanced by water-deficit and significantly correlated with activities of sucrose synthase, soluble starch synthase and starch branching enzymes (Yang et al., 2004b). Exogenous ABA reduced chlorophyll content in flag leaves, enhanced remobilization and increased the rate of grain filling (Yang et al., 2003). The results suggested that ABA is involved in controlling plant senescence. Enhanced carbon remobilization and accelerated grain filling rate have been attributed to an elevated ABA level in wheat plants subjected to water deficit (Yang et al., 2001 and 2003; Yang and Zhang, 2006).. Terminal drought affects carbohydrate metabolism and photosynthesis rates, as well as gene expression (Pelleschi et al., 1999; Trouverie et al., 2004). A common observation in the dehydration process is the accumulation of soluble sugars (Ramanjulu and Bartels, 2002; Bartels, 2005). A correlation between sugar accumulation and osmotic stress tolerance has been reported in transgenic experiments (Ramanjulu et al., 1994; Gilmour et al., 2000; Streeter et al., 2001; Taji et.
(28) 14 al., 2002). An example for sucrose accumulation during desiccation occurs in the desiccation-tolerant plant Craterostigma plantagineum, where dehydration had been suggested to induce the conversion of 2-octulose, an eight-carbon sugar, to sucrose (Bianchi et al., 1991). This conversion is correlated with increases in gene expression for sucrose synthase (Sus) and sucrose phosphate synthase (Sps) (Ingram et al., 1997; Kleines et al., 1999). Water-stressed maize leaves showed a strong induction of vacuolar invertase activity that was associated with increases in glucose and fructose levels, and with the expression of the vacuolar invertase gene Ivr2. Ivr2 expression was enhanced by ABA and glucose (Pelleschi et al., 1999; Trouverie et al., 2004). The current hypothesis is that sugars act as osmotic protectants contributing to the stabilization of membrane structures (Bartels, 2005). Despite many studies, the link between the presence of these carbohydrates and desiccation tolerance has not been confirmed (Bartels, 2005).. 2.4 Carbohydrate and drought stress. 2.4.1 The distribution and translocation of carbohydrate. Water soluble carbohydrate is the dominant component of non-structural carbohydrates (Gebbing and Schnyder, 1999). Mobilization of WSC in stems usually starts at about mid-grain filling (Spiertz and Ellen, 1978). On average, the mobilization of WSC contributed 72% to total pre-anthesis carbohydrate mobilization (Gebbing and Schnyder, 1999). Most of the WSC were mobilized from the stem and leaf sheaths (Gebbing et al., 1998), where they are mainly stored in the form of fructan (Blacklow et al., 1984; Kühbauch and Thome, 1989)..
(29) 15 In drought environments, reserves of assimilate present in wheat and barley crops at flowering can buffer grain yield during grain filling (Bidinger et al., 1977). This socalled pre-anthesis assimilate contribution to grain yield in wheat and barley, on average, were estimated to be 12 and 22%. in well-watered and water-deficit. (drought) plants (Table 2.1), respectively, which are below the figures of Gallagher et al. (1975; 1976). Similar results were found in the research of Kühbauch and Thome (1989) (Table 2.1), where the pre-anthesis assimilates did not contribute greatly to grain filling (10%). On the other hand, the average proportions of total crop carbon at maturity in the grain (labelling carried out in the post-anthesis period) was 87.5 and 78% in watered crops and water-deficit crops, respectively (Bidinger et al., 1977) (Table 2.1). Gebbing et al. (1999) estimated pre-anthesis reserves contributed 11-29% to the total mass of carbon in grain at maturity (Gebbing et al., 1999).. Table 2.1 Percentage of grain carbon acquired from pre-anthesis and post-anthesis carbon pools in wheat and barley in water-deficit treatments. Watered. Pre-anthesis. Post-anthesis. Water-deficit. Wheat. Barley. Average. Wheat. Barley. average. 13. 12. 12. 27. 17. 22. 10 87. 10 88. 87.5. Reference. Bidinger et al., 1977 Kühbauch and Thome, 1989. 73. 83. 78. Bidinger et al., 1977. 2.4.2 Water deficit accelerates the translocation of carbohydrate to seeds. A transient water deficit during grain filling of wheat could accelerate grain filling by facilitating the remobilization of carbon reserves in the stem through regulating the enzymes involved in fructan and sucrose metabolism (Yang et al., 2004b; Ehdaie et.
(30) 16 al., 2006b). If mild soil drying is properly controlled during the later grain-filling period in rice and wheat, the gain from the enhanced remobilization and accelerated grain filling rate can outweigh the loss of reduced photosynthesis and the shortened grain-filling period, leading to increased grain yield, better harvest index and higher water use efficiency (Yang et al., 2004a; Yang and Zhang, 2006). Water deficit facilitated the reduction in concentration of total non-structural carbohydrates (NSC) and fructans in the stems and 14C increase in the grain of wheat (Yang et al., 2004b). Water deficit enhanced sucrose synthase (Sus), soluble starch synthase (SSS) and starch branching enzyme (SBE) by 33, 33 and 25%, respectively, which were positively related to starch accumulation rate. Granule-bound starch synthase and, soluble and insoluble acid invertase in grain were less affected by water deficit compared to the enzymes above (Yang et al., 2004a).. 2.4.3 Soluble carbohydrate plays an important role under abiotic stress. Synthesis of sugars or compatible solutes has widely been observed as a mechanism that may help plants cope with water deficit (Whittaker et al., 2001). The accumulation of compatible solutes or osmolytes under osmotic stress is well known in many organisms. Osmolytes are synthesized in response to osmotic stress and do not interfere with normal cellular biochemical reactions (Ramanjulu and Bartels, 2002). They help to maintain an osmotic balance under dehydration conditions (Bray et al., 2000). Kameli and Losel (1995) reported that carbohydrates and other solutes contributed to osmotic adjustment (OA) in wheat leaves under water stress. In durum wheat, glucose appeared to be the major contribution to OA, whereas in barley sucrose seemed more important (Lewicki, 1993). Van Laere and Van den Ende (2002) reported that smaller fructans may exert stronger osmotic effects during water stress..
(31) 17 Since the discovery of 6-FEHs in non-fructan plants, new functions for these FEHs (which are also not inhibited by sucrose) have been suggested (Van den Ende et al., 2003b; De Coninck et al., 2005). For example, they might fulfil a defence related function, which might prevent bacterial diseases or diminish the toxicity of levans (Cairns, 2003), or depolymerize fructans in the apoplast in order to stabilize the membrane during cold stress (Livingston and Henson, 1998; Hincha et al., 2000; Van den Ende et al., 2001). Vereyken et al. (2003) demonstrated that fructans are capable of being inserted between the headgroups of phospholipid vesicles, thus stabilising membranes in a manner consistent with drought protection in vivo. These functions can be envisaged to contribute to drought, salt and frost tolerance.. 2.4.4 Model for plant fructan biosynthesis. The substrate for fructan synthesis is sucrose and, like sucrose, fructans are stored in the vacuole (Vijn and Smeekens, 1999). Whereas sucrose is synthesized in the cytoplasm, fructans are produced in the vacuole by the action of specific enzymes (fructosyltransferases) that transfer frucose from sucrose to the growing fructan chain (Fig. 2.5). The presence of fructosyltransferases and fructans in the vacuole has been shown (Wagner et al., 1983; Vijn et al., 1997). However, fructan synthesis in compartments other than vacuoles, such as prevacuolar compartments, cannot be ruled out. The biosynthesis of five classes of fructans (lnulin series, levan series, mixed levan (graminan), inulin neoseries, and levan meoseries) is shown in Fig. 2.5 (Pavis et al., 2001). Another possibility for the production of levans, which was proposed by Wiemken et al. (1995), involves the removal of the β-(2-1)-linked fructosyl residue from bifurcose by either 1-FFT or exohydrolase (Fig. 2.5)..
(32) 18 Graninan/levan ratios can change greatly in wheat stems, depending on cultivars/environmental conditions (Van den Ende, unpublished results). Fructan synthesis in plants might be much more complex than the proposed model (Fig. 2.5). The different fructosyltransferases tested are able to produce several fructan molecules depending on the available substrate or on incubation conditions (Vijn and Smeekens, 1999). For example, additional 1-kestose, 1-SST is able to produce tetraand even pentasaccharides from sucrose (Koops and Jonker, 1996; Lüscher et al., 1996; Van den Ende and Van Laere, 1996), and additional neokestose, 6G-FFT produces the inulin tetrasaccharide nystose (Vijn et al., 1997).. Fig. 2.5 The model of fructan biosynthesis in plants (Vijn and Smeekens, 1999; Chalmers et al., 2005). Starting from sucrose, structurally different fructan molecules can be produced by the concerted action of different fructosyltransferases and fructan exohydrolases (SST: sucrose sucrose transferase; FFT: fructan fructan transferase; SFT: sucrose fructan transferase; FEH: fructan exohydrolase) (Kaeser, 1983; Wiemken et al., 1995). Both 1-FEH and 6-FEH belong to the GH 32 family of glycosylhydrolases as discussed in the text.. Two classes of glycoside hydrolases, hydrolysing fructans, have been defined (Yamamoto et al., 1985; Le Roy et al., 2007) and called GH32 and 68. The GH32.
(33) 19 family. contains. β-fructosidases,. invertases,. FEHs. and. various. types. of. fructosyltransferases, differing only in their donor (sucrose or fructan) and acceptor (sucrose, fructan or water) specificity (Le Roy et al., 2007). All GH32 enzymes have three critical carboxylic acids (Asp86, Glu342 and Asp247) in their active site (Meng and Futterer, 2003; Lammens et al., 2008). High levels of amino acid sequence similarities between these enzymes reveal evolutionary relationships (Van den Ende et al., 2000). Fructan biosynthesizing enzymes are closely related to vacuolar invertases (Vijn and Smeekens, 1999; Francki et al., 2006; Ritsema et al., 2006), whereas FEHs are closely related to cell wall invertases, suggesting that they both evolved from a common β-fructosidase ancestor (Van den Ende et al., 2000). Site-directed mutagenesis-based data on Arabidopsis thaliana cell wall invertase (AtcwINV) demonstrate an important role for the Asp-239 residue in both binding and hydrolysis of sucrose (Le Roy et al., 2007). In general, the GH32 family of enzymes contain an Asp-239 functional homolog and have sucrose as a preferential donor (Le Roy et al., 2007). The Asp239Ala mutant acted as a 1-FEH, preferentially degrading 1-kestose. Asp-239 is proposed as a reliable determinant for the identification of non-characterized members of cell wall invertases/FEHs (Le Roy et al., 2007).. In the detailed anaysis of Le Roy et al. (2007) a key interaction between Asp239 and Lys242 is proposed for defining the ability to hydrolyse sucrose and thus assist in defining FEHs. Consistent with this model, all plant FEHs purified up to now did not hydrolyse sucrose and had a clear specificity towards either inulin (1-FEH) or levan (6-FEH) type fructans (Van Laere and Van den Ende, 2002; Van den Ende et al., 2003b)..
(34) 20 Although the general model for fructan synthesis suggests that sucrose is the only substrate for fructan synthesis, fructan molecules consisting only of fructose occur in plants (Ernst et al., 1998; Van den Ende et al., 1998). Theoretically, such fructan molecules can be produced by the action of endo-inulinases or alfa-glucosidases, but these enzymes have so far not been detected in plants. One decade ago, it was demonstrated that 1-FFT is able to produce fructofuranosyl-only oligosaccharides from Fru and inulin (Van den Ende et al., 1998).. 2.4.5 Key factors in the regulation of fructan synthesis and breakdown. Sucrose: sucrose 1-fructosyltransferase (1-SST) is considered to be the most important enzyme for fructan synthesis since SST increases at the same time with fructan accumulation (Wagner et al., 1986; Yukawa et al., 1994). Fructan exohydrolase (1-FEH), on the other hand, catalyzes the hydrolysis of fructans, leading to the release of fructose, which, in turn, has to be converted to the precursors required for the resynthesis of sucrose before phloem loading (Simpson and Bonnett, 1993; Willenbrink et al., 1998). Fructosyltransferases and FEHs can work together at the same time in monocots and determine the fructan level while expressions of FT and FEH were separated in time in dicots (W. Van den Ende personal conversersation). Two isoforms of 1-FEH were purified from the phases of fructan biosynthesis (green stems) and breakdown (stems turning yellow) in wheat (Van den Ende et al., 2003a). Characterization of the purified enzymes revealed that inulin-type fructans [β-(2,1)] are much better substrates than the levan-type fructans [β-(2,6)]. These enzymes were named as 1-FEH w1 and 1-FEH w2. 1-FEH activities were found to be considerably higher during the fructan breakdown phase (Van den Ende et al., 2003a; Yang et al., 2004b; Kawakami et al., 2005). However, it was possible to.
(35) 21 purify substantial amounts of 1-FEH w2 from young, fructan biosynthesizing wheat stems. In this process, 1-FEH is postulated to be important not only during the period of fructan breakdown but also as a putative β-(2,1)-trimmer during the period of active fructan biosynthesis (Van den Ende et al., 2003a). Another 1-FEH gene was cloned and characterized in Lolium perenne (Lothier et al., 2007). The expression pattern of this gene (Lp1-FEHa) was positively associated with the fructan level in leaf tissue which supported the hypothesis of a putative β-(2,1)-trimmer during the period of active fructan biosynthesis. Recently, 1-FEH w3 was purified from wheat stems (Van Riet et al., 2008) and the enzyme hydrolysed mainly β-(2,1) linkages in fructans and was inhibited by sucrose. 1-FEH w3 was highly expressed in stems at the grain filling stage (Van Riet et al., 2008).. As discussed earlier, sucrose is a major form of carbon translocation and the main storage sugar in plants (Dennis et al., 1997), and occurs in high concentration in the vacuole where fructan is also mainly located (Van Riet et al., 2006). Sucrose inhibits 1-FEH w1, w2 and w3 involved in the degradation of fructan and therefore, when there is excess sucrose, the degradation of fructans does not occur (Van den Ende et al., 2004). When the demand for grain filling is high and sucrose becomes limiting, fructans are degraded by 1-FEHs to release more sucrose and fructose. Therefore, 1FEH w1, w2 and w3 are very important for maintaining the flow of carbon required for grain filling.. A 6-FEH from wheat was cloned and functionally characterized by Van Riet et al. (2006). This gene exclusively hydrolyses the β-(2-6) bond in a fructan-producing plant and is expressed in stems as well as photosynthetically active tissues like leaves of one-week-old seedlings and adult plants. The high homology of this 6-FEH with.
(36) 22 rice invertase (Hirose et al., 2002) and maize CwInv4 (78%), an unbound apoplast invertase with a low pI (Kim et al., 2000), which is not inhibited by sucrose, might suggest an apoplastic localization, and that 6-FEH might not be involved in reserve mobilization (Van Riet et al., 2006).. Other fructan-degrading exohydrolytic enzymes have been purified from several fructan-accumulating plants. An exohydrolase with a [β-(2-6)]-linkage-specific fructan- β-fructosidase activity has been purified from perennial ryegrass, and a [β-(21)]-linkage-specific exohydrolase has been purified from Jerusalem artichoke (Marx et al., 1997). These enzymes degrade the fructan polymers by removing the terminal fructose residue, resulting in the release of free fructose (Henson and Livingston, 1996; Marx et al., 1997).. A comparison with different types of tissue from wheat plants at grain filling (Van Riet et al., 2006), indicated that 1-FEH activity was mostly present in the stem. 1FEH activity in the stem was also measured at different stages (Yang et al., 2004b) and the results showed that the maximal FEH activity in well-watered plants appeared between 24 to 33 days after anthesis. Consistent with this observation, Kühbauch and Thome, (1989) reported that fuctan degradation occurred 21 days after anthesis when there was an increase in free fructose concentration in stems. Water deficit substantially enhanced the activities of fructan exohydrolase (FEH) and sucrose phosphate synthase (SPS) and the activities were positively correlated with the total WSC remobilization from stems (Yang et al., 2004b). According to Yang et al. (2004b), sucrose levels increased sharply during the reduction of stem WSC (fructans) and promoted the re-allocation of pre-fixed 14C from stems to grain..
(37) 23. Fig. 2.6 Illustration of major WSC metabolic pathways and WSC-correlated enzyme families. The total mRNA levels of individual enzyme families were determined by Affymetrix GeneChip analysis. Red color indicates enzyme families with the total mRNA levels positively correlated with stem WSC concentrations; blue indicates enzyme families with the total mRNA levels inversely correlated with WSCs; black indicates enzyme families that showed no significant correlations. The asterisks (*) show potentially positively WSC-correlated enzyme families (Xue et al., 2008). Affymetrix GeneChip based studies analysed carbohydrate metabolic families of 16 recombinant inbred SB (Seri/Babax) lines of wheat differing in stem WSC concentrations at anthesis (Xue et al., 2008; Fig. 2.6). The results revealed that the mRNA levels of two fructan synthetic enzyme families [sucrose:sucrose 1fructosylthansferase (1-SFT) and sucrose:fructan 6-fructosyltransferase (6-SFT)] in the stem were positively correlated with stem WSC and fructan concentration at anthesis stage while the mRNA levels of enzyme families involved in sucrose hydrolysis (sucrose synthase and soluble acid invertase) were inversely correlated with WSC concentrations. Enzyme families related to sugar catabolic pathways.
(38) 24 (fructokinase and mitochondrion pyruvate dehydrogenase complex) and enzyme families involved in diverting UDP-glucose to cell wall synthesis (UDP-glucose 6dehydrogenase, UDP-glucuronate decarboxylase and cellulose synthase), correlated with a reduction in cell wall polysaccharide contents (mainly hemicellulose) in the stem of high WSC lines. However, 1-FEH and 6-FEH were not associated with genotypic variation in the stem WSC at anthesis (Xue et al., 2008) most likely the authors assessed mRNAs too early in the development of grain filling (see Chapters 5 and 6).. 2.4.6 External influence on fructan concentration. Fructan concentration is strongly affected by the intensity of light. The concentration of fructan in shaded plants has been measured to be approximately 4.3% of dry weight, while sugar (sucrose, glucose and fructose) concentrations in stems were similar to unshaded plants until 29 days after flowering, then decreased faster than in unshaded plants (Kühbauch and Thome, 1989). In separated studies, using additional light to illuminate plants, the fructan concentration increased by 12% (Conocono, 2002). In the study of Gebbing (2003), fructan concentration was significantly higher in wheat peduncle lower unexposed part than up exposed part, and remained unchanged during the light period.. Trimming of inflorescences at full light resulted in increases WSC deposition into stems (637 mg·stem-1 at milk stage) (Kühbauch and Thome, 1989). When inflorescences were partially removed, fructan concentration increased greatly until the milk stage of kernels (21 days after flowering), but the sugar concentrations during this period were not higher than in stems of control plants..
(39) 25 2.5 Drought tolerant phenotypes. 2.5.1 Genotypic variation in WSC (sucrose and fructan) concentration in response to drought. 2.5.1.1 The inconsistent correlation between the level of WSC and grain yield in wheat in response to drought. Stem WSC is an important source of carbon for grain filling. Fructans are the dominant components of the stem WSC (Blacklow et al., 1984; Kühbauch and Thome, 1989; Winzeler et al., 1990; Pollock and Cairns, 1991; Schnyder, 1993; Gebbing et al., 1998). Differences in fructan accumulation have been observed between genotypes (Winzeler et al., 1990). Drought-related fructan accumulation has been reported by several authors (Pollock and Cairns, 1991; Hendry and Wallace, 1993). However, correlation between the level of WSC and grain yield remains controversial.. In wheat, several authors reported that drought tolerance associated with high yield was related to high accumulation of stem WSC reserves (Nicolas and Turner, 1993; Blum et al., 1997a; Kerepesi and Galiba, 2000; Foulkes et al., 2007b; Snape et al., 2007; Xue et al., 2008). However, in these studies, there are inconsistent correlations between the level of stem WSC and grain yield. For example, two double-haploid (DH) populations derived from crosses of Beaver x Soissons and Rialto x Spark in two seasons 2000/2001 and 2001/2002 were analysed (Foulkes et al., 2007b). The results showed that the stem WSC was positively associated with grain yield under irrigation in both seasons (R2 = 0.13; p < 0.01 and 0.22; p< 0.001, respectively) and with drought in the second season (R2 = 0.35; p < 0.001). However, there was no.
(40) 26 correlation under drought in 2000/2001 (R2 = 0.05). In addition, several DH lines with high stem WSC levels gave lower grain yields in 2001/2002. The research group of Snape et al. (2007) reported that WSC of stem (sheath included) was positively associated with grain yield under both drought (R2= 0.05) and irrigated conditions (R2 = 0.13). However, the regression results showed a greater positive correlation between WSC and grain yield in irrigated rather than in drought affected crops.. In a recent study, Yang et al. (2007) used a double haploid population (150 lines) of drought tolerant (Hanxuan 10) and sensitive (Lumai 14) varieties to map QTL of traits of the stem water soluble carbohydrate (SWSC) at different stages. The majority of the corresponding traits had lower correlation coefficients between the traits associated with the SWSC and thousand grain weight (TGW) except that the SWSC at grain filling (SWSCG) showed significantly positive correlations with accumulation efficiency of SWSC (AESWC), remobilization efficiency of SWSC (RESWC), TGW at grain filling and maturity, and grain filling efficiency at late grain filling (GFEL). Likewise, Evans and Wardlaw (1996) reported that there was no simple relationship between grain yield and the amount of reserves mobilized during grain filling in wheat. It is likely that some of those reserves are used as energy sources in respiration, translocation, maintenance or root growth (McCullough and Hunt, 1989; Cruz-Aguado et al., 2000).. Twenty two bread varieties were grown across several years and sites throughout southern New South Wales (NSW), Australia, and WSC concentrations were measured at anthesis (Ruuska et al., 2006). The results showed significant and repeatable differences in WSC accumulation among genotypes, associated with large broad-sense heritability although there were large environmental differences. Across.
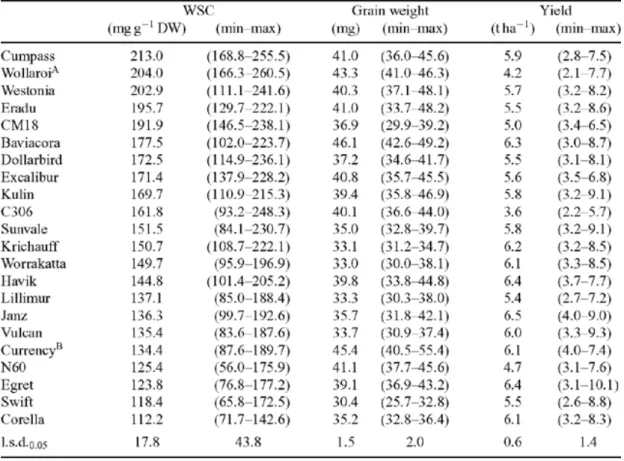
(41) 27 genotypes, a moderate correlation between anthesis WSC concentration and single grain weight at maturity was determined (rg = 0.46, P < 0.01). The correlation between WSC and grain yield was 0.34 (P <0.05) (Table 2.2). There were exceptions (Table 2.2), for example, the yield of Westonia (5.7 t ha-1) was much lower that that of Janz (6.5 t ha-1) whereas the WSC of Westonia was much higher compared to Janz. Ruuska et al. (2006) suggested that the WSC level might not be a reliable trait for selecting high yielding varieties.. Table 2.2. Mean and ranges (in parenthesis) for water soluble carbohydrate concentration, single grain weight, and grain yield for different wheat and triticale genotypes evaluated across six environments (Ruuska et al., 2006).. Stem WSC comparisons of separated parts of the wheat stem were carried out on ten diverse bread cultivars and a durum wheat cultivar under two water treatments.
(42) 28 (irrigated and drought) in field conditions (Ehdaie et al., 2006b). Drought did not reduce WSC content in the peduncle (26%) as much as in the penultimate internode (36%) and in the lower internodes (32%). The WSC concentration of the peduncle was unaffected by drought while it was reduced in the penultimate and lower internodes by 13 and 12%, respectively. In contrast, drought, on average, improved mobilization efficiency in the peduncle by 32.8%, in the penultimate internode by 16.9% and in the lower internodes by 10.7%. The amount of WSC mobilized from the peduncle was, on average, similar under both treatments and more WSC (Ehdaie et al., 2006b) and dry matter (Ehdaie et al., 2006a) were mobilized from the penultimate and the lower internodes under well-watered than under drought conditions. It was reported that the WSC-related traits studied are under genetic control, for example, 4 out of 11 varieties (No. 14; No. 49, Ramona 50 and Anza) had greater post-anthesis accumulation of WSC in the peduncle in drought than in well-watered conditions whereas another 6 varieties showed a reverse trend, and the remaining one had similar WSC levels in both treatments. In addition, the amount of WSC mobilized in the peduncle of No. 14, No. 49, Chinese Spring, and Anza (spring) was markedly greater under drought than the well-watered treatment, while Ramona 50, Maringa, Anza (winter), Express Wincora, and Westbred Turbo showed a reverse trend. This result indicates that the total mobilization of WSC from stem to grain is not only dependent on the WSC level in the stem but also relies on mobilization efficiency controlled by genotypic diversity.. 2.5.1.2 The genotypic variation in WSC (sucrose and fructan) in other species. Perennial ryegrass cultivars with different levels of (WSC) concentrations were evaluated under controlled environmental conditions using hydroponic culture (Smith.
(43) 29 et al., 2002). The high WSC cultivars had shoot growth rates that were similar to the standard cultivars, confirming that the extra WSC in these cultivars was not made available through reductions in yield potential. In addition, the high WSC cultivars had less root mass and lower root: shoot ratio than the standard cultivars but these traits were not consistent across all high WSC cultivars. When ryegrass was grown in a range of Australian environments, the total herbage yield of the high-WSC cultivars has often been lower than that of cultivars better adapted to Australian conditions (Smith et al., 1998). However, during certain periods of the growing season, herbage production by the high-WSC cultivars was equivalent to the local cultivars and their high-WSC phenotype was expressed consistently. There is also evidence that cv. Aurora (high WSC) had fewer roots at depth than cv. Melle (low WSC) when these Perennial ryegrass cultivars were grown under drought conditions in southern France (Volaire et al., 1998).. 2.5.2 Other phenotypes related to drought tolerance. 2.5.2.1 Plant size. The effect of plant size on wheat response to drought stress was carried out by Blum et al. (1997b). Plants with large (wild type, rht), medium (Rht1) and (Rht2), and small biomass potential (Rht3) were grown in hydroponic culture in a growth chamber using polyethylene glycol (PEG) to give a water potential of -0.55 MPa. Shoot biomass in the controls of rht was greater than Rht3. Growth reduction by osmotic stress was inversely related to plant size while the extent of osmotic adjustment during osmotic stress was directly related to plant size. Despite the greater stress tolerance of smaller (Rht3) plants, the absolute growth and biomass of large (rht) plants under stress.
(44) 30 conditions was always better than that of smaller plants. Blum et al. (1997b) proposed that plants with high growth rate and large size were used under mild water deficit and plants with less depression would be grown when stress is more severe. A similar experiment was carried in the field on tall (2 m) and short (1 m) sorghum (Blum et al., 1997a) and the results indicated that grain weight per panicle was reduced by drought stress only in the short genotype. The tall sorghum with greater stem weight at the onset of grain filling lost more reserves from the stems during grain filling (r = 0.89, p < 0.0001; n = 18). Consequently, stem weight loss as a percent of grain weight per panicle increased with larger stem weight (r = 0.73, p = 0.0006; n =18). It was concluded that large carbohydrate reserve in the stem at the onset of grain filling ascribe stable grain filling under any stress which depresses the photosynthetic source during grain filling.. 2.5.2.2 Root system. Deep root systems and high root: shoot weight ratios contribute greatly to drought tolerance (Fukai and Cooper, 1995; Price et al., 1997; Ling et al., 2002; Yue et al., 2005). Root size of modern cultivars is small due to the early green revolution that used dwarf wheat (Waines and Ehdaie, 2007). Root biomass and grain yield increased significantly in irrigated and rain-fed conditions using 1RS lines (a translocation from rye, Secale cereale) and similar alien translocations (Waines and Ehdaie, 2007). Kubo et al. (2006) used a mixture of paraffin and vaseline (PV) as a substitute for compacted soil, and measured the number of roots penetrating through the PV disc per plant. The results indicate that a large genotypic variation exists in the penetrating ability among Japanese wheat cultivars and cultivars with a high penetrating ability of.
(45) 31 roots detected would be useful genetic resources of wheat to improve yield stability under drought and hard soil conditions.. Root depth in cereals is generally related to the number of main (seminal) thick root axes. Such a fibrous root system is well developed in upland rice (Ling et al., 2002; Yue et al., 2005). In addition, the renewal of root branching into wet soil immediately after rainfall is considered as an important factor in plant recovery from drought stress (Blum, 2007b).. High root length density at depth is useful in extracting water in upland conditions but does not appear to offer much scope for improving drought tolerance in rainfed lowland rice where the development of a hard pan may prevent deep root penetration (Fukai and Cooper, 1995). The high root length density might be a useful trait of drought tolerance in wheat. The wheat varieties with high density of roots might have a great capacity to extract water compared with low root density varieties.. 2.5.2.3 Leaf water potential and osmotic potential. Under water-limiting environments, leaf water potential and osmotic potential are usually used for measuring the capability of osmotic adjustment (OA) in plants.. Osmotic adjustment is an effective component of drought tolerance in crop plants (Morgan, 1984) and therefore has been used as a selection criterion in traditional crop breeding programmes to improve grain yield in dry environments (Morgan, 1980; Blum, 1989; Tangpremsri et al., 1991; Zhang et al., 1999; Ma and Turner, 2006). Osmotic adjustment can potentially counteract the effects of a rapid decline in leaf water potential (Fukai and Cooper, 1995). Osmotic adjustment involves the net.
(46) 32 accumulation of compatible solutes in a cell in response to a fall in the water potential of the cell’s environment. As a consequence of this net accumulation, the osmotic potential of the cell is lowered, which in turn attracts water into the cell and tends to maintain turgor pressure (Babu et al., 1999). Substantial genotype diversity for OA was observed in wheat (Morgan et al., 1986). In field studies, osmotic adjustment may not show positive effects on plant growth and grain yield, and some species including wheat, barley, sorghum, maize, rice and soybean showed yield advantages to low OA (Munns, 1988; Serraj and Sinclair, 2002).. 2.5.2.4 Green leaf retention. Soil drying at grain-filling induces early senescence, reduced photosynthesis, and shortened the grain-filling period of wheat (Yang et al., 2000). Flag-leaf photosynthesis in wheat contributes about 30-50% of assimilates for grain filling (Sylvester-Bradley et al., 1990). ‘Stay-green’ as a surviving phenotype of plants is reported to be a tolerant phenotype to terminal drought stress in cereals (Malabuyoc et al., 1985; Borrell et al., 2000; Campos et al., 2004; Foulkes et al., 2007b; Snape et al., 2007). This trait is important for maintaining the flow of carbon assimilate to the grain.. Four classes of delayed senescence or ‘stay-green’ were described by Thomas and Smart (1993). Two of these relate to functionally stay-green effects, corresponding to delayed onset of senescence or a slower rate in progress of senescence, whereas the remaining two classes related to effects that lack photosynthetic capability. In addition, green leaf retention caused by heavy use of nitrogen fertilizers and small.
(47) 33 size of plants complicates its use as a selection criterion for drought tolerance (Fukai and Cooper, 1995; Yang and Zhang, 2006).. 2.5.2.5 Water use efficiency. Water use efficiency (WUE) is commonly defined as dry matter growth per unit of water used and is closely related to transpiration efficiency, dry matter growth per unit of water transpired. Instantaneous measurements, the ratio of leaf photosynthesis and transpiration, can be used to approximate WUE as instantaneous water use efficiency (IWUE). Water use efficiency during the long vegetative growth of wheat is clearly important when drought occurs during this period or where high biomass production needs to be optimised to the water supply. However wheat improvement by increases in water use efficiency has not always resulted in improvements of plants in target environments exposed to drought in Australia (Richards, 2003).. 2.5.2.6 Canopy temperature. The canopy temperature is the temperature in the area of flag leaf sheath. The canopy temperature might affected by leaf angle. A suitable leaf angle might reduce the transpiration rate which reduce the water consumption, and also reduce the surface temperature which might avoid the over heat by sun light. Under drought, Olivares-Villegas et al. (2007) observed that low canopy temperature was the drought-adaptive trait contributing to a higher yield (r2 = 0.74, P< 0.0001) in wheat. The canopy temperature in wheat was highly heritable (h2 = 0.65; P< 0.0001) and it was suggested that low canopy temperature can be utilised as a selection criteria to identify high-yielding wheat genotypes under drought (Olivares-Villegas et al., 2007)..
(48) 34 2.6 Quantitative trait loci (QTL) related to drought tolerance. Understanding the genetic basis of drought tolerance in crops is fundamental to enable breeders and molecular biologists to develop new varieties with more drought tolerant characters (Zhang et al., 2001). QTL studies identify the chromosomal regions that are more consistently associated with drought tolerance. Numerous QTL mapping studies examining drought tolerance and related traits in maize, rice, barley and wheat have demonstrated that drought tolerance is drought tolerance is complex and is comprised of contributions from multiple loci (McCouch and Doerge, 1995; Quarrie, 1996; Diab et al., 2004). Many genes may be involved in drought tolerance mechanisms, and the identification of several QTL involved in drought or dehydration tolerance in rice (Lilley et al., 1996), maize (Lebreton et al., 1995) or in sorghum (Borrell et al., 1999) has confirmed their polygenic nature. Furthermore, several modifications of gene expression were observed under water stress (Close et al., 1989; Bray, 1997; Grover, 1999; Forster et al., 2000). The expression of stress-induced genes is an essential part of tolerant mechanisms, but for many of these genes no direct role in tolerance has been clearly demonstrated. Some of the QTL involved in drought tolerance may correspond to such genes acting directly or in regulatory functions. Consequently, the location of these candidate genes in wheat, rice, barley and ryegrass near or within QTL involved in adaptation could give some information on their role as well as direction for further research (Diab et al., 2004; Hazen et al., 2005).. 2.6.1 QTL of drought tolerance and high yield in wheat.
(49) 35 A population of 96 doubled haploid lines (DHL) of Chinese Spring × SQ1 (a high ABA-expressing breeding line) was used to identify QTL for yield and yield components from 24 combinations of site × treatment × year, including nutrient stress, drought stress (no irrigated) and salt stress treatments (Quarrie et al., 2005). One or more QTL for yield were identified on every chromosome, with chromosome 5B having the most (26) and chromosome 6D the least (3). The group-5 chromosomes gave the largest number of yield QTL (67) and the group-6 chromosomes the least (23). Under stressed conditions (2 g plant-1), five DHLs among the six highest yielding DHLs had the high-yield allele at the five most significant locations for yield (SQ1 at 3BS, 4AS, 4BS, 5AS, 7AL; CS at 1DS). Under optimum conditions, there were also high-yield QTL (SQ1 at 2BS, 3BL, 5BL; CS at 4AL and 7BL). The thousand grain weight (TGW) QTL cluster was on 6B centromeric region which was in a homoeologous position to a yield QTL region identified by Blanco et al. (2002) that is near Xrsq805 on 6A. An association between an inter (I) –SSR marker on wheat 6BL and TGW has also been reported (Ammiraju et al., 2001). A yield QTL in the centromeric region of 6B was also found by Ayala et al. (2002) using the International Triticeae Mapping Initiative (ITMI) population. Grain number per ear was found on the group-7 long arms (Quarrie et al., 2005). The QTL are shown in Table 2.3.. The major TGW QTL were near the centromere region of 6B on the backcross population of Durum × Triticum dicoccoides in rain-field and irrigated condition (Elouafi and Nachit, 2004). The statistical analysis showed significant peaks of TGW in chromosomes 4B, 6A and 6B with main and QTL x Environment (E) interaction effects (Table 2.3). The major peak on 6B was wide (approximately 50 cM) with five.
(50) 36 prominent peaks and was near the centromeric region of 6B (28%). The major QTL explained 32% of the total variation, of which 25% was of genetic origin.. A new but significant QTL for wheat yield on 6A was found across seasons and environments, accounting for between 9-12% of the genotypic variation (Snape et al., 2007) based on the analysis of wheat DH population grown over different environments (rain-field and irrigated) and seasons. They also found flag leaf senescence (stay-green) was the most significant in drought interactions and enabled continued photosynthesis at grain filling. A strong QTL for flag leaf senescence (staygreen) was located on wheat group 2. A similar result was found by Verma et al. (2004) and the coincidence of QTL for senescence [green leaf retention (GLR)] on chromosomes 2B and 2D (Table 2.3).. 2.6.2 QTL for drought tolerance and high yield in barley. Candidate genes and differentially expressed sequence tags (dESTs) for drought response (yield and physiological changes under water deficit) were mapped in a population of 167 F8 recombinant inbred lines derived from a cross between Tadmor (drought tolerant) and Er/Apm (adapted only to specific dry environments) in dry areas (Diab et al., 2004).. Osmotic potential (OP) and relative water content (RWC) are components of osmotic adjustment (OA) and are highly correlated (Teulat et al., 1997) because OA is calculated using OP. Two QTL were identified for OA, one on chromosome 3H and one on 5H (Diab et al., 2004). For RWC, six QTL were detected under water stress. Seven QTL were identified for OP and the seven QTL were detected on all chromosomes except 7H (Diab et al., 2004) (Table 2.3)..
Figure


+7


Outline
Key factors in the regulation of fructan synthesis and breakdown
Genotypic variation in WSC (sucrose and fructan) concentration in
Other phenotypes related to drought tolerance
QTL of drought tolerance and high yield in rice
Discussion
Identification of 1-FEH gene structure and chromosome location
two varieties
Terminal water deficit and the remobilization of stem reserves
Future work
Related documents