Flour from sprouted wheat as a new ingredient in bread-making
Alessandra Marti, Gaetano Cardone, Maria Ambrogina Pagani, Maria Cristina Casiraghi
PII: S0023-6438(17)30805-8 DOI: 10.1016/j.lwt.2017.10.052 Reference: YFSTL 6615
To appear in: LWT - Food Science and Technology Received Date: 11 July 2017
Revised Date: 12 September 2017 Accepted Date: 23 October 2017
Please cite this article as: Marti, A., Cardone, G., Pagani, M.A., Casiraghi, M.C., Flour from sprouted wheat as a new ingredient in bread-making, LWT - Food Science and Technology (2017), doi: 10.1016/ j.lwt.2017.10.052.
This is a PDF file of an unedited manuscript that has been accepted for publication. As a service to our customers we are providing this early version of the manuscript. The manuscript will undergo copyediting, typesetting, and review of the resulting proof before it is published in its final form. Please note that during the production process errors may be discovered which could affect the content, and all legal disclaimers that apply to the journal pertain.
M
AN
US
CR
IP
T
AC
CE
PT
ED
Flour from sprouted wheat as a new ingredient in bread-making
Alessandra Marti*, Gaetano Cardone, Maria Ambrogina Pagani & Maria Cristina Casiraghi
Department of Food, Environmental and Nutritional Sciences (DeFENS), University of Milan, Italy
* alessandra.marti@unimi.it
M
AN
US
CR
IP
T
AC
CE
PT
ED
Abstract 1Despite the nutritional and sensory improvements associated with sprouted grains,
2
their use in baking has been limited until recently. Indeed, severe and uncontrolled
3
grain sprouting induces high accumulations of enzymatic activities that negatively
4
affect dough rheology and baking performance. In this study, wheat was sprouted
5
under controlled conditions and the effects of enrichment (i.e. 15%, 25%, 33%, 50%,
6
75% and 100%) of the related refined flour (SWF) on dough rheological properties,
7
baking performances and starch digestibility were assessed. Adding SWF to flour
8
significantly decreased dough water absorption, development time, and stability
9
during mixing, which suggests a weakening of the gluten network. However, no
10
significant changes in mixing properties and gluten aggregation kinetics were
11
measured from 25 to 75% SWF. Regardless of the amount added, SWF improved
12
dough development and gas production during leavening. Decreases in gas retention
13
did not compromise bread-making performances. The best result – in terms of bread
14
volume and crumb porosity – was obtained with 50% SWF instead of using SWF
15
alone. Interestingly, in 100 % SWF bread the slowly digestible starch fraction
16
significantly increased.
17
Keywords: sprouting; dough rheology; bread- making; starch digestibility
18 19
M
AN
US
CR
IP
T
AC
CE
PT
ED
1. Introduction 20Sprouts from cereals and pulses have been used as food sources for centuries,
21
especially in Africa and Asia, where sprouting (or germination) is mainly carried out
22
in households to improve the sensory quality (Bellaio, Kappeler, & Zamprogna
23
Rosenfeld, 2013). Moreover, germination is also associated with the improvement of
24
the nutritional values of the grains, as recently reviewed by several authors (Hübner &
25
Arendt, 2013; Omary, Fong, Rothschild, & Finney, 2012). The nutritional benefits
26
promoted by germination include: (i) an increase in the bioavailability of several
27
minerals and vitamins; (ii) an increase in antioxidant activity; (iii) a decrease in
anti-28
nutrients, such as enzyme inhibitors and metal-chelating species (i.e. phytates)
29
(Mäkinen & Arendt, 2015; Singh, Rehal, Kaur, & Jyot, 2015). Therefore, using
30
sprouted grains in food formulations is becoming increasingly popular in the
31
marketplace and represents an emerging trend in health foods. Downside of sprouted
32
grains is starch digestibility, that generally increases significantly after germination,
33
due to the increased α-amylase activity induced by the treatment (Dhital, Warren,
34
Butterworth, Ellis, & Gidley, 2017). Unlike pulses (Hoover & Zhou, 2003), less work
35
has been done to evaluate the effect of germination on the starch digestibility of
36
cereals and their products (e.g. bread). Moreover, differences in types of cereal, flour
37
refinement level, and methodology might account for contrasting results (Cornejo,
38
Caceres, Martínez-Villaluenga, Rosell, & Frias, 2015; Świeca, Dziki, &
Gawlik-39
Dziki, 2017).
40
As regards functionality, the hydrolytic enzyme activities induced by
41
germination such as amylases and proteases – if excessive - negatively affect the
42
technological performances of wheat, which thus becomes unsuitable for baked foods
43
(Morris & Rose, 1996). This might occur directly in the field (i.e. pre-harvest
M
AN
US
CR
IP
T
AC
CE
PT
ED
sprouting) - when grains are exposed to prolonged wet or foggy conditions - or when
45
the germination process is carried out under uncontrolled conditions of moisture,
46
temperature and/or time (Nielsen, McCrate, Heyne, & Paulsen, 1984).
47
Germination under controlled conditions has been proposed at an industrial scale to
48
determine the extent of the modifications occurring in germinated grains. Besides the
49
improvement in sensory attributes of bread (Richter, Christiansen, & Guo, 2014), the
50
native enzymes present in sprouted wheat could help decrease or substitute the use of
51
commercially enzymes, such as flour improvers that are commonly present in the
52
formulation of baked products (Marti, Cardone, Nicolodi, Quaglia, & Pagani, 2017).
53
The effects of high percentages (>10%) of refined flour from germinated wheat on
54
bread-making performances have not been investigated yet. In food formulations,
55
balancing nutritional and/or sensory improvements while maintaining technological
56
quality is a challenge. Therefore, the aim of this study was to investigate how gluten
57
aggregation kinetics, dough formation, leavening performance and bread
58
characteristics are affected by blending commercial wheat flour with refined flour
59
from sprouted wheat. This study also aimed at determining the maximum level of
60
sprouted wheat enrichment suitable for obtaining a product with enhanced sensory
61
and nutritional benefits, without compromising the bread-making performance and
62
the in vitro starch digestibility.
63 64
2. Materials and methods
65
2.1 Materials
66
Refined flour from sprouted wheat (SWF; starch: 79 g/100 g db; protein: 12 g/100 g db;
67
lipid: 1.5 g/100 g db; ash: 0.5 g/100 g db) was kindly provided by Molino Quaglia
68
(Molino Qualia S.p.A., Vighizzolo d'Este, Italy). Wheat kernels were sprouted in an
M
AN
US
CR
IP
T
AC
CE
PT
ED
industrial sprouting plant (Bühler AG, Uzwil, Switzerland) and milled as described in
70
a previous work Marti et al. (2017a) with few modifications. Briefly, wheat was
71
soaked in water (kernels:water ratio of 1:2) for 24h at 20 °C, germinated for 48 h at
72
20 °C, dried at 60 °C for 12 h.
73
SWF was used alone (100%) or blended with a commercial wheat flour (CTRL;
74
Molino Quaglia S.p.A., Vighizzolo d'Este, Italy) characterized by the following
75
alveographic indices: W (dough strength) = 280 * 10-4 J; P/L (tenacity:extensibility
76
ratio) =1.16. In details, 15 g, 25 g, 33 g, 50 g, and 75 g of SWF were added to 85 g,
77
75 g, 67 g, 50 g, and 25 g of CTRL, respectively.
78
2.2 Gluten aggregation properties
79
Gluten aggregation properties were measured at least in triplicate with the GlutoPeak
80
device (Brabender GmbH & Co. KG, Duisburg, Germany) as reported by Marti et al.
81
(2017a). The following indices were automatically recorded by the software provided
82
with the device (GlutoPeak version 2.0.1; Brabender GmbH & Co. KG, Duisburg,
83
Germany): (i) Maximum Torque (MT, expressed in Brabender Equivalents, BE),
84
corresponding to the peak occurring due to gluten aggregation; (ii) Peak Maximum
85
Time (PMT, expressed in s), corresponding to the time before torque decreasing,
86
when gluten breaks down; (iii) Energy (expressed in GlutoPeak Equivalent, GPE)
87
corresponding to the area under the curve from the beginning of the test and 15 s after
88
MT.
89
2.3. Mixing properties
90
Water absorption, development time, stability and degree of softening were measured,
91
at least in duplicate, with the Brabender® Farinograph-E (Brabender GmbH & Co.
M
AN
US
CR
IP
T
AC
CE
PT
ED
KG, Duisburg, Germany) equipped with a 50 g mixing bowl according to ICC 115/1
93
Approved Method (ICC, 1992).
94
2.4 Leavening properties
95
Dough development during leavening and its gas production and retention were
96
assessed on two independent dough samples. CTRL, SWF and their blends were
97
mixed with bakers’ yeast and salt (1.5 g/100 g flour), previously dissolved in water.
98
The required amount of water was previously determined by a farinograph until the
99
mixing curve reached 500 BU. For each sample, the ingredients were mixed in an
100
automatic spiral mixer (Bomann, Clatronic s.r.l., Italy) for 8 min and placed (315 g) in
101
the Chopin Rheofermentometer F4 (Chopin, Tripette & Renaud, Villeneuve La
102
Garenne Cedex, France) for recording changes in dough height and gas production
103
during leavening (3 h at 30 °C).
104
2.4 Bread-making
105
Dough samples, which were prepared as described in the previous section, were
106
divided into two portions of 250 g, molded into cylinder shapes, and put in tin pans
107
(height: 8 cm; length: 15 cm; depth: 5 cm) in a proofing chamber for 60 min at 30 °C
108
and 70% of relative humidity. Bread was baked in an oven (Self Cooking Center®,
109
Rational International AG, Mestre, VE, Italy) for 4 min at 120 °C adding vapor until
110
90% relative humidity was reached. Then, the oven temperature was increased up to
111
230°C and bread was baked for 11 min. Samples were analyzed two hours after
112
baking. Bread loaves were packaged in perforated oriented polypropylene film and
113
stored at controlled conditions (20 °C, 60% relative humidity) for six days for texture
114
analysis. Three central slices (15 mm thickness) were selected from each loaf and
115
used for crumb color, porosity and texture analysis. For each flour mixture, two
M
AN
US
CR
IP
T
AC
CE
PT
ED
experimental baking tests were performed and six loaves were obtained from each
117
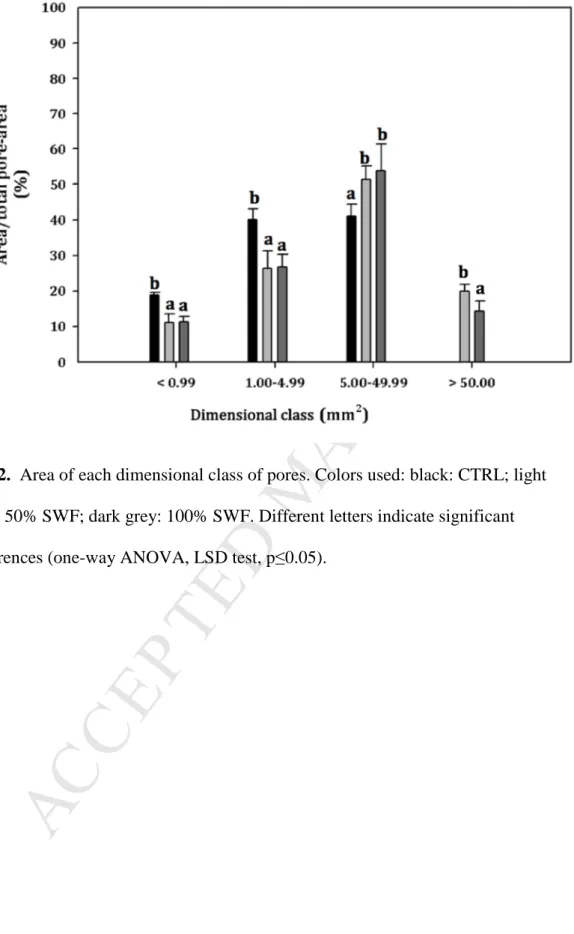
baking test.
118
2.5 Bread properties
119
2.5.1 Colour and specific volume
120
Colour determination was carried out using a reflectance color meter (CR 210,
121
Minolta Co., Osaka, Japan) to measure the lightness and saturation of the color
122
intensity of bread crumb and crust. Results were expressed in the CIE L* a* b* colour
123
space. Measurements of bread crust were performed in triplicate on three loaves for
124
each bread-making process (n=18). Measurements of bread crumbs were performed
125
on three bread slices of one loaf from each bread-making test (n=6).
126
The volume of three loaves from two independent baking tests (n=6) was evaluated
127
by using the sesame displacement method after mechanically compacting the bread to
128
exclude all empty spaces. Weight was assessed using a technical scale (Europe 1700,
129
Gibertini, Novate, Italy). The specific volume (n=6) was determined by the
130
volume/mass ratio and expressed in mL/g.
131
2.5.2 Crumb moisture and water activity
132
Crumb moisture was evaluated using a moisture analyzer (MA 210.R, Radwag Wagi
133
Elektroniczne, Poland) drying the sample at 130 °C until the weight did not change by
134
1 mg for 120 s. Crumb water activity (aw) was measured by an electronic hygrometer
135
(Acqua Lab, CX-2 – Decagon Devices, Pullman, WA). Both crumb moisture and aw
136
were measured on three central slices of one loaf from each bread-making trials
137
(n=6).
138
2.5.3 Crumb porosity
M
AN
US
CR
IP
T
AC
CE
PT
ED
Crumb porosity was evaluated as described in Marti et al. (2017a). Images of three
140
central slices (15 mm thick) of one loaf from each bread-making trial were acquired
141
with a flatbed scanner (Epson Perfection 3170 Photo, Seiko Epson Corp., Japan) at a
142
resolution of 600 dpi (dots for inch). For each image, a single square field of view
143
(49.5 mm x 49.5 mm) was selected. The images were calibrated, standardized and
144
optimized by applying appropriate filters to evaluate the morphological
145
characterization of the bubble area (mm2) and porosity (%) using Image-Pro Plus 6.0
146
software (Media Cybernetics Inc., USA).
147
Moreover, bubbles, were classified into four different size classes according to their
148
surface: class 1: bubble area between < 0.99 mm2; class 2: bubble area between 1.00
149
and 4.99 mm2; class 3: bubble area between 5.00 and 49.99 mm2; class 4: bubble area
150
greater than 50.00 mm2. Porosity (i.e. the area of pores over the total area), and the
151
area occupied by each class of pores (i.e. area of each dimensional class of pores over
152
the total pore-area) were also calculated.
153
2.5.4 Texture
154
Crumb texture characteristics were analyzed by using a texture analyzer (Z005, Zwick
155
Roell, Ulm, Germany), equipped with a 100 N load cell as described by Marti et al.
156
(2017a). To evaluate crumb hardness, three central slices (15 mm thick) of one loaf
157
from each bread-making trial were compressed (speed: 2 mm/s) to 30% of their height
158
by using a 30 mm diameter cylindrical aluminum probe. Crumb hardness (n=6) was
159
measured after 0 (two hours after baking), 1, 3 and 6 storage days and expressed as
160
the load (N) at 30% strain.
161
2.6 In vitro starch digestibility of the bread
M
AN
US
CR
IP
T
AC
CE
PT
ED
According to the method described by Englyst et al. (2000), in vitro starch
163
digestibility was assessed by the estimation of rapidly (RDS) and slowly (SDS)
164
digestible starch fractions that are likely to become available for rapid or slow
165
absorption by the small intestine, thus modulating glycemic response. Bread was
166
minced to simulate mastication (particle size less than 0.9 cm) and treated as reported
167
in Marti et al. (2017b). Duplicates from two independent baking trials were averaged
168
(n=4). Rapidly (RDS) and slowly (SDS) digestible starch fractions were calculated
169
from the glucose-released data at 20 min and between 20 and 120 min of incubation
170
with a mixture of hydrolytic enzymes. RDS and SDS fractions were expressed as the
171
percentage of digested starch per 100 g of bread portion. Glucose, fructose and
172
maltose concentrations were evaluated (in samples before digestion) by HPLC Anion
173
Exchange Chromatography with Pulsed Amperometric Detection (HPAEC-PAD)
174
(Marti et al., 2017a).
175
2.7 Statistics
176
The data was subjected to analysis of variance (ANOVA) to determine significant
177
(p≤0.05) differences among the samples. ANOVA analysis was performed by
178
utilizing Statgraphics XV version 15.1.02 (StatPoint Inc., Warrenton, VA, USA).
179
Different dough, bread, or cells were considered as factors. When a factor effect was
180
found to be significant (p≤0.05), significant differences among the respective
181
averages were determined using Fisher’s Least Significant Difference (LSD) test.
182
3. Results and discussion
183
3.1 Gluten aggregation properties
184
The GlutoPeak device has been proposed as a rapid and reliable method for
185
evaluating gluten aggregation kinetics in wheat samples (Marti, Augst, Cox, &
M
AN
US
CR
IP
T
AC
CE
PT
ED
Koehler, 2015; Marti, Ulrici, Foca, Quaglia, & Pagani, 2015; Melnyk, Dreisoerner,
187
Marcone, & Seetharaman, 2012). Typical GlutoPeak curves for a wheat flour (CTRL)
188
and a sprouted wheat flour (SWF) are shown in Fig. S1. During the test, the sample
189
slurry is subjected to intense mechanical action promoted by the speed of the rotating
190
element, which facilitates the formation of gluten. Thus, a rapid increase in torque is
191
registered until the maximum value (i.e. MT) is reached. Further mixing breaks the
192
network, with a concomitant decline in torque (Marti et al., 2015a). Generally, flours
193
for bread-making showed higher peaks and faster gluten aggregation than flours for
194
cakes or biscuits (Lu & Seetharaman, 2014; Marti et al., 2015b; Quayson, Atwell,
195
Morris, & Marti, 2016).
196
Results suggest a weakening of the gluten network (Table 1). Indeed, germination
197
promoted the hydrolysis of gluten forming proteins by proteases and the formation of
198
soluble peptides (Koehler, Hartmann, Wieser, & Rychlik, 2007), compromising
199
gluten aggregation properties. In particular, replacing wheat flour with SWF
200
significantly decreased MT, and a linear response was observed with the enrichment
201
level (R2=0.80).
202
As regards the time at which maximum aggregation occurred, a no linear response
203
was found for SWF blends. PMT did not change when up to 25% SWF was used.
204
However, the PMT value significantly decreased when the level of SWF was
205
increased, except for 50% level. A maximum PMT seemed to exist when SWF was
206
blended with control bread flour in equal portions (i.e., 50:50).
207
A similar trend in GlutoPeak test has been shown when soft and hard wheat flours
208
were blended in equal portions (Lu and Seetharaman, 2014). This phenomenon –
209
which was not observed in any other rheological test - may be related to differences in
210
interactions between gluten proteins from SWF and CTRL, similar to that observed
M
AN
US
CR
IP
T
AC
CE
PT
ED
for soft wheat and hard wheat gluten proteins (Melnyk et al., 2012; Quayson, Marti,
212
Bonomi, Atwell, & Seetharaman, 2016). This hypothesis will need to be investigated
213
further before any definitive conclusions can be drawn.
214
One of the most suitable parameters for predicting conventional parameters
215
related to dough strength, beside PMT and MT, is found in the area under the curve
216
which takes into account both maximum torque and PMT (Marti et al., 2015b;
217
Quayson et al., 2016a). The presence of SWF significantly decreased this parameter,
218
which yielded a linear response (R2=0.85). The results suggest that SWF has a
219
negative effect on gluten aggregation properties, likely due to the action of proteases,
220
thus confirming previous findings (Marti et al., 2017a). However, SWF enrichment at
221
25, 50, and 70% did not significantly affect the energy value (p≤0.05).
222
Finally, on the basis on previous works (Marti et al., 2015a,b), the mixtures with
223
SWF – regardless of how much was added – show a gluten aggregation kinetic
224
similar to that of a flour with good bread-making qualities.
225
3.2 Mixing properties
226
The effects of incorporation of germinated wheat flour on dough mixing
227
characteristics are shown in Table 1. Dough from CTRL was characterized by high
228
water absorption (57.8%) and very high stability (18.8 min) (Table 1), which are
229
typical of strong wheat flour (Fig. S2).
230
Replacing CTRL with SWF brought about a significant (p≤0.05) decrease in water
231
absorption (Table 1) and resulted in a linear response (R2=0.96). According to
232
Dojczew & Sobczyk (2007), decrease in water absorption could mainly be due to
233
proteins de-polymerization as a consequence of the intense protease activity in
234
germinated wheat. Dough development time and dough stability sharply decreased up
M
AN
US
CR
IP
T
AC
CE
PT
ED
two parameters did not further decrease with increasing amounts of SWF (>15%),
237
with the exception of 25% SWF. The reduced development time and stability could
238
be due to the disruption of the gluten matrix by enzymes (i.e. proteases).
239
3.3 Leavening properties
240
Rheofermentometer analysis provides information on dough leavening performance
241
(i.e. dough height, CO2 production and retention). Table 1 shows the data obtained
242
from this test carried out on the different mixtures. Adding SWF to wheat flour
243
increased both dough height (up to 75%) and leavening time (Table 1). The results
244
confirmed the positive effect of α-amylase activities on dough leavening properties
245
(Marengo et al., 2016; Marti et al., 2017a; Sanz Penella, Collar, & Haros, 2008). In
246
fact, high levels of sugars - which result from starch hydrolysis by α-amylase – are
247
used from the yeast during leavening, resulting in greater dough development in a
248
shorter time, compared to CTRL. No linear response was detected for dough height,
249
since no significant differences were observed from 15% to 75% SWF enrichment.
250
Despite the positive effect of germination on dough development, adding SWF to
251
common bread flour decreased height at the end of the leavening step, suggesting the
252
collapse of the dough structure when the leavening time lasts more than 2h. This is
253
due to the decrease in the ability of the gluten structure to withstand the physical
254
stresses as a result of proteolytic activity.
255
The indices obtained from the gas release curves are summarised in Table 1.
256
These results indicated that doughs with increasing amount of SWF had a higher
257
volume of CO2 release than CTRL. If gas is efficiently retained in the dough, an
258
optimal final bread volume can be expected (Huang, Kim, Li, & Rayas-Duarte, 2008).
259
The increasing availability of mono- and disaccharides as substrates promoted the
260
carbon dioxide production during fermentation (Verheyen, Jekle, & Becker, 2014). In
M
AN
US
CR
IP
T
AC
CE
PT
ED
addition, in the presence of SWF from 33% to 100%, high amounts of retained and
262
lost carbon dioxide resulted (Table 1) and no linear response was found for these
263
parameters. The coefficient of retention - which is defined as the ratio expressed as
264
percentage between the volume retained in the dough and the total volume of gas
265
produced during the test - decreased from 94.6% (CTRL) to about 89% for 50% SWF
266
and 100% SWF. Enzymatic activity that developed during germination might have
267
negatively affected the gas retention capacity, which is associated with an increase of
268
dough permeability due to dough weakening by the increased hydrolysis of starch
269
chains (Sanz Penella et al., 2008). In addition, protease hydrolyses peptide linkages,
270
which might have induced a partial destruction of the protein network and thus
271
lowered the capacity of the dough to enclose air compared to CTRL sample.
272
3.4 Bread properties
273
Based on the dough mixing and leavening properties (Table 1), blends enriched with
274
SWF at 50% and 75% level did not show significant differences. Only their gluten
275
aggregation properties differed (i.e. PMT), suggesting peculiar protein interactions in
276
50% SWF. Thus, bread-making performance of 50% SWF was compared to that of
277
CTRL and 100% SWF.
278
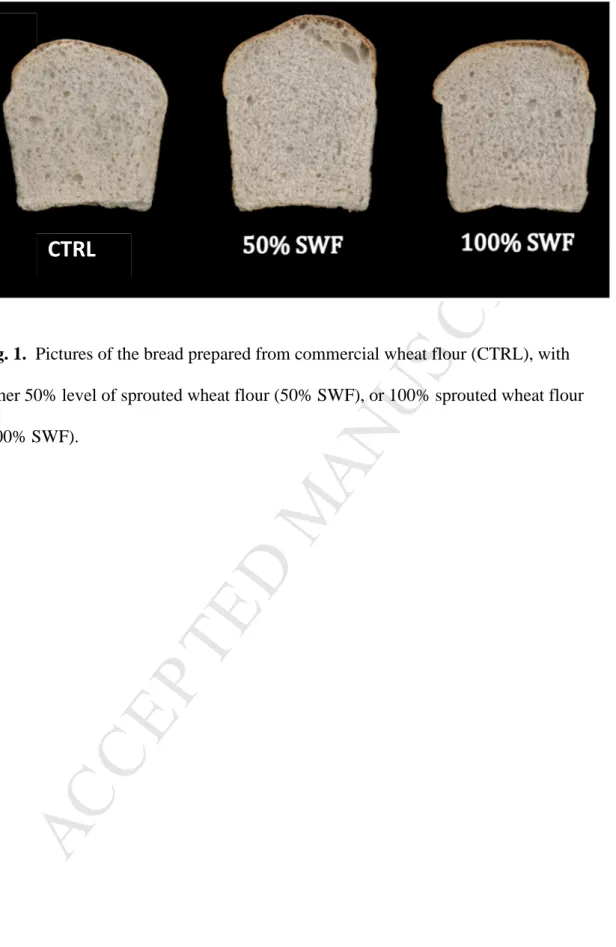
As shown in Figure 1, SWF did not lead to a worsening of bread-making
279
performance. Moreover, 50% SWF enriched-bread, produced greater volume and
280
more porosity than CTRL and 100% SWF samples (Table 2).
281
Adding SWF to CTRL resulted in a darker (decrease in L*) and redder crust
282
(higher a*) (Table 2). Changes in crust might be associated with Maillard reactions
283
(Hefni & Witthöft, 2011), which can be expected to be more intense in SWF-enriched
284
samples. Indeed, amylases and proteases affect the Maillard reaction, the former by
M
AN
US
CR
IP
T
AC
CE
PT
ED
peptides and amino acids (Goesaert et al., 2005). As regards crumbs, an important
287
difference in both redness and yellowness was observed when sprouted wheat flour
288
was added (Table 2). These changes were also probably due to the increase in the
289
Maillard reaction.
290
Specific bread volume significantly differed for the three samples (Fig. 1, Table 2),
291
with 50% SWF having the highest specific volume. The amount of α-amylase
292
developed during germination could have played a key role in increasing loaf volume.
293
At the same time, sprouting under controlled conditions limited the proteases activity
294
and its dramatic effects on the gluten network (Marti et al., 2017a) that are generally
295
observed in pre-harvest sprouted wheat grains.
296
3.4.1 Crumb porosity
297
Using SWF sample significantly increased the area of porosity from 45.82% (CTRL)
298
to 49.09% (50% SWF), which was similar to that of bread with 100% SWF (46.14%)
299
(Table 2). This result is obviously related to the increase in volume associated with
300
the addition of SWF and can be related to the amylase activity developed during
301
wheat germination, whose effect on crumb porosity has been observed elsewhere
302
(Goesaert, Slade, Levine, & Delcour, 2009). As for cells, although the number of each
303
class was very similar for all the samples (data not shown), differences in cell area
304
were observed (Fig. 2). A significantly larger area of small pores (<5 mm2) was
305
present in CTRL samples than in 50% and 100% samples. In fact, the small cell area
306
represented around 60% of the total pore area in CTRL bread and only about 40% for
307
50% and 100% SWF. An opposite trend was observed for pore area in the medium
308
dimensional class (5.00 - 49.99 mm2), as the area occupied by this class of pores was
309
higher in both SWF samples than CTRL samples. Moreover, larger pores (>50 mm2)
M
AN
US
CR
IP
T
AC
CE
PT
ED
were found only in bread with SWF, whose area accounted for the about 20% of the
311
total porosity. From these results, it can be deduced that enzymes produced by
312
germination, especially α-amylases, favor gas cell coalescence (Lagrain, Leman,
313
Goesaert, & Delcour, 2008).
314
3.4.2 Texture
315
SWF addition had also a positive effect on crumb firmness (Table 2).
316
Decrease in firmness in the presence of SWF cannot be related to differences in
317
crumb moisture, since SWF-enriched bread showed low firmness and low crumb
318
moisture. Unlike the Scanlon & Zghal (2001) study, crumb firmness did not increase
319
with increasing density (Table 2).
320
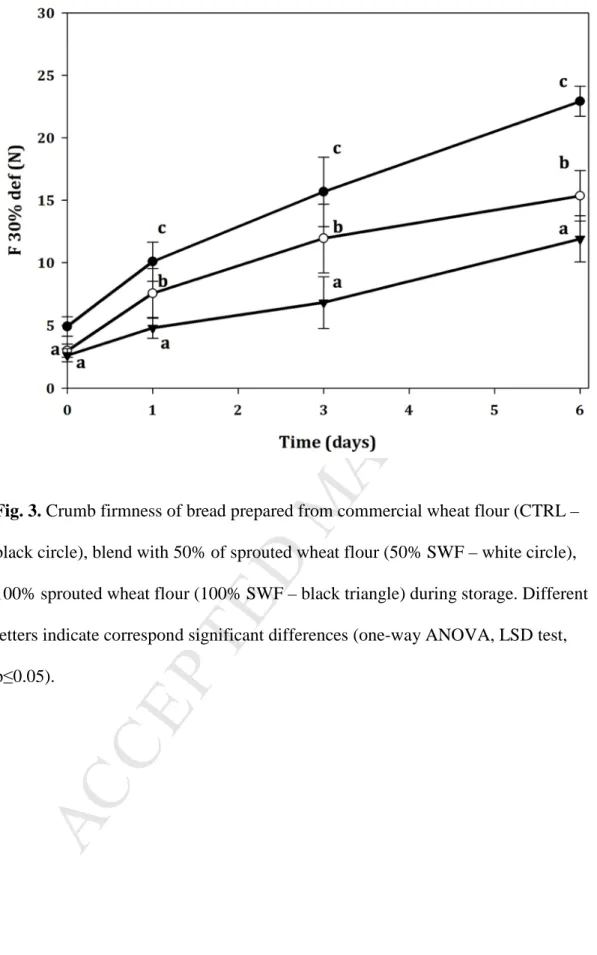
Indeed, even during storage, bread containing either 50% or 100% SWF
321
exhibited lower firmness than the control (Fig. 3). As observed on fresh bread (t0, 2h
322
after baking), differences in firmness during storage were not related to either crumb
323
moisture or water activity, (data no shown). On the other hand, several works
324
demonstrated that production of hydrolytic enzymes during germination were
325
responsible for improving crumb softness up to six days of storage (De leyn, 2006;
326
Goesaert et al., 2005, 2009). In particular, α-amylase decreases amylopectin
327
retrogradation and the firming rate of wheat bread crumb (Champenois, Della Valle,
328
Planchot, Buleon, & Colonna, 1999). In addition, the firmness of 50% SWF bread
329
after three days of storage was similar to that shown by CTRL bread after just one day
330
of storage, whereas 100% SWF sample after six days exhibited firmness values
331
similar to those of CTRL bread after just one day of storage. A similar effect was
332
detected when SWF was included at low levels (<2%) in bread formulation (Marti et
333
al., 2017a).
M
AN
US
CR
IP
T
AC
CE
PT
ED
3.5. In vitro starch digestibility
335
The effects of refined flour from sprouted wheat on starch digestibility was
336
assessed by a well-established in vitro assay, which allows the determination of both
337
rapidly and slowly digestible starch fractions (RDS and SDS, respectively). By
338
measuring the susceptibility of starch to digestive enzymes, this assay is
339
internationally endorsed to estimate the potential glycaemic response of foods (EFSA,
340
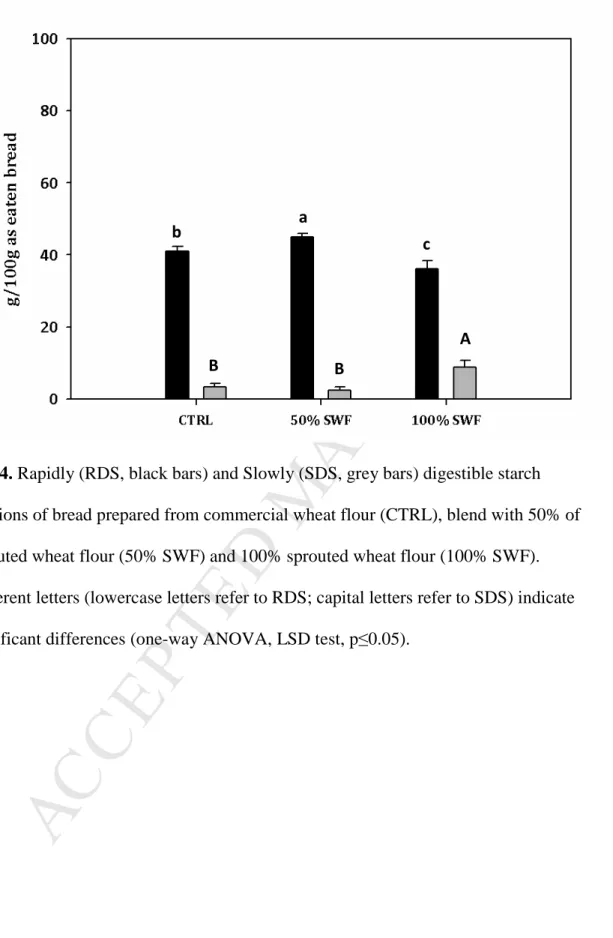
2011). Significant differences in starch susceptibility to digestive enzymes were
341
observed in bread samples (Fig 4). In particular, in 100% SWF bread the RDS and
342
SDS fractions were significantly (p≤0.05) lower and higher, respectively, than those
343
determined in CTRL and 50% SWF bread. These data partially agree with those
344
reported by Świeca et al. (2017), which evidenced a decrease in starch digestibility in
345
bread with 20% of sprouted wheat. This result was attributed to an increase in the
346
aliquot of resistant starch and/or to a high phenolics content of sprouted wheat
347
(Świeca et al., 2017). A comparison of our results with those of Świeca et al. (2017) is
348
difficult, since different in vitro methods were used. Secondly, sprouting conditions
349
and percentages of flour enrichment were different. The differences in starch
350
digestibility (RDS) measured between CTRL and 50% SWF suggest that differences
351
in chemical composition did not play a key role in starch digestibility. It is likely that
352
the different starch digestibility (i.e. increase in SDS) assessed in 100% SWF was
353
related to differences in bread structure, consequent to modification to wheat flour
354
promoted by germination, that become evident only when native wheat flour was
355
absent. This feature may be of interest from a nutritional point of view, since it could
356
reduce the glycemic potential of this new bread formulation. Indeed, the glycaemic
357
response appears to be directly related to the amount of RDS while insulin demand is
358
inversely correlated to the SDS fraction (Garsetti, Vinoy, Lang, Holt, Loyer,
M
AN
US
CR
IP
T
AC
CE
PT
ED
Miller, 2005). The effects of germination on protein structure and its impact on starch
360
digestibility needs further investigation.
361
In contrast, the total number of free “glycemic” sugars significantly and
non-362
linearly increased with SWF substitution (3.0% in CRTL vs 7.3% in 50% SWF vs
363
8.3% in 100% SWF), with maltose increase as the main determinant (Table 3). This
364
trait, probably attributable to α-amylase developed during germination, could be of
365
interest from a sensory point of view (i.e. sweet flavour note) but may promote an
366
increased glycemic response. Further in vivo studies are needed to assess how the rate
367
of starch digestibility and the increase in free “glycemic” sugars in 100% SWF bread
368
impact on post-prandial glycemic response.
369
4. Conclusions
370
Flour from sprouted wheat has always been considered to be of poor baking quality.
371
Indeed, the relevant amylase and protease activities accumulated into the grain during
372
germination are responsible for intense hydrolytic phenomena at the expense of gluten
373
and starch, the holding-structure macromolecules in the dough. The hydrolysis of
374
these macromolecules is clearly highlighted by the rheological tests conventionally
375
used for predicting flour baking behavior.
376
Although we are aware that uncontrolled wheat sprouting, in the field during wheat
377
growing is a phenomenon associated with a sharp deterioration of dough consistency
378
and handling and bread characteristics, our results show that controlled (i.e. in an
379
industrial factory) sprouted wheat flour could be used as new ingredient in bread
380
making. Gluten proteins, though weakened by proteolytic activity, do not lose their
381
ability to aggregate and form a network suitable for leavening, as the GlutoPeak test
382
indicated. The molecular changes associated with this behavior need to be carefully
M
AN
US
CR
IP
T
AC
CE
PT
ED
potential functional breads on glucose metabolism. In particular, the effect of
385
sprouting on quality-related protein fractions, starch and lipid molecules and their
386
potential interactions should be taken into consideration as a molecular explanation
387
for the positive effects of sprouting on bread properties.
388
Aknowledgments
389
We thank Lucio Quaglia from Molino Quaglia S.p.A. (Vighizzolo d’Este, Italy) for
390
providing raw materials and Anja Nicolodi for technical assistance.
391
References
392
Bellaio, S., Kappeler, S., & Zamprogna Rosenfeld, E. (2013). Partially germinated
393
ingredients for naturally healthy and tasty products. Cereal Foods World, 58,
394
55–59.
395
Champenois, Y., Della Valle, G., Planchot, V., Buleon, A., & Colonna, P. (1999).
396
Influence of α-amylases on bread staling and on retrogradation of wheat starch
397
models. Sciences des Aliments, 19, 471-486.
398
Cornejo, F., Caceres, P. J., Martínez-Villaluenga, C., Rosell, C. M., & Frias, J.
399
(2015). Effects of germination on the nutritive value and bioactive compounds of
400
brown rice breads. Food Chemistry, 173, 298–304.
401
De leyn, I. (2006). Functional additives. In Y. H. Hui (Ed.), Bakery Products Science
402
and Technology (pp. 233–244). Iowa: Blackwell Publishing Ames.
403
Dhital, S., Warren, F. J., Butterworth, P. J., Ellis, P. R., & Gidley, M. J. (2017).
404
Mechanisms of starch digestion by α -amylase—Structural basis for kinetic
405
properties. Critical Reviews in Food Science and Nutrition, 57, 875–892.
406
EFSA (2011). Scientific Opinion on the substantiation of a health claim related to
407
“slowly digestible starch in starch-containing foods” and “reduction of
M
AN
US
CR
IP
T
AC
CE
PT
ED
prandial glycaemic responses” pursuant to Article 13(5) of Regulation (EC) No
409
1924/20061. EFSA Journal, 9, 2292-2307.
410
Englyst, K. N., Hudson, G. J., & Englyst, H. N (2000). Starch analysis in food. In R.
411
A. Meyers (Ed), Encyclopedia of analytical chemistry (pp. 4246-4262). New
412
York: John Wiley & Sons Ltd.
413
Garsetti, M., Vinoy, S., Lang, V., Holt, S., Loyer, S., & Brand-Miller, J. C. (2005).
414
The glycemic and insulinemic index of plain sweet biscuits: relationships to in
415
vitro starch digestibility. Journal of the American College of Nutrition, 24,
441-416
447.
417
Goesaert, H., Brijs, K., Veraverbeke, W. S., Courtin, C. M., Gebruers, K., & Delcour,
418
J. A. (2005). Wheat flour constituents: how they impact bread quality, and how
419
to impact their functionality. Trends in Food Science & Technology, 16, 12–30.
420
Goesaert, H., Slade, L., Levine, H., & Delcour, J. A. (2009). Amylases and bread
421
firming - an integrated view. Journal of Cereal Science, 50, 345–352.
422
Hefni, M., & Witthöft, C. M. (2011). Increasing the folate content in Egyptian baladi
423
bread using germinated wheat flour. LWT - Food Science and Technology, 44,
424
706–712.
425
Hoover, R., & Zhou, Y. (2003). In vitro and in vivo hydrolysis of legume starches by
426
a-amylase and resistant starch formation in legumes - A review. Carbohydrate
427
Polymers, 54, 401–417.
428
Huang, W., Kim, Y., Li, X., & Rayas-Duarte, P. (2008). Rheofermentometer
429
parameters and bread specific volume of frozen sweet dough influenced by
430
ingredients and dough mixing temperature. Journal of Cereal Science, 48, 639–
431
646.
432
Hübner, F., & Arendt, E. K. (2013). Germination of cereal grains as a way to improve
M
AN
US
CR
IP
T
AC
CE
PT
ED
the nutritional value: a review. Critical Reviews in Food Science and Nutrition,
434
53, 853–61.
435
I. C. C. (1992). Method for using the Brabender Farinograph.
436
Koehler, P., Hartmann, G., Wieser, H., & Rychlik, M. (2007). Changes of folates,
437
dietary fiber, and proteins in wheat as affected by germination. Journal of
438
Agricultural and Food Chemistry, 55, 4678–4683.
439
Lagrain, B., Leman, P., Goesaert, H., & Delcour, J. A. (2008). Impact of thermostable
440
amylases during bread making on wheat bread crumb structure and texture. Food
441
Research International, 41, 819–827.
442
Lu, Z., & Seetharaman, K. (2014). Suitability of Ontario-Grown Hard and Soft Wheat
443
Flour Blends for Noodle Making. Cereal Chemistry, 91, 482–488.
444
Mäkinen, O. E., & Arendt, E. K. (2015). Nonbrewing Applications of Malted Cereals,
445
Pseudocereals, and Legumes: A Review. Journal of the American Society of
446
Brewing Chemists, 73, 223–227.
447
Marengo, M., Carpen, A., Bonomi, F., Casiraghi, M. C., Meroni, E., Quaglia, L., …&
448
Marti, A. (2017). Macromolecular and Micronutrient Profiles of Sprouted
449
Chickpeas to Be Used for Integrating Cereal-Based Food. Cereal Chemistry, 94,
450
82-88.
451
Marti, A., Abbasi Parizad, P., Marengo, M., Erba, D., Pagani, M. A., & Casiraghi, M.
452
C. (2017b). In Vitro Starch Digestibility of Commercial Gluten‐Free Pasta: The 453
Role of Ingredients and Origin. Journal of Food Science, 82, 1012–1019.
454
Marti, A., Augst, E., Cox, S., & Koehler, P. (2015a). Correlations between gluten
455
aggregation properties defined by the GlutoPeak test and content of
quality-456
related protein fractions of winter wheat flour. Journal of Cereal Science, 66,
457
89–95.
M
AN
US
CR
IP
T
AC
CE
PT
ED
Marti, A., Cardone, G., Nicolodi, A., Quaglia, L., & Pagani, M. A. (2017a). Sprouted
459
wheat as an alternative to conventional flour improvers in bread-making. LWT -
460
Food Science and Technology, 80, 230–236.
461
Marti, A., Ulrici, A., Foca, G., Quaglia, L., & Pagani, M. A. (2015b). Characterization
462
of common wheat flours (Triticum aestivum L.) through multivariate analysis of
463
conventional rheological parameters and gluten peak test indices. LWT - Food
464
Science and Technology, 64, 95–103.
465
Melnyk, J. P., Dreisoerner, J., Marcone, M. F., & Seetharaman, K. (2012). Using the
466
Gluten Peak Tester as a tool to measure physical properties of gluten. Journal of
467
Cereal Science, 56, 561–567.
468
Morris, C. F., & Rose, S. P. (1996). Wheat. In R. J. Henry & P. S. Kettlewell (Eds.),
469
Cereal Grain Quality (pp. 3–54). Dordrecht: Springer Netherlands.
470
Nielsen, M. T., McCrate, A. J., Heyne, E. G., & Paulsen, G. M. (1984). Effect of
471
weather variables during maturation on preharvest sprouting of hard white
472
wheat. Crop Science, 24, 779–782.
473
Omary, M. B., Fong, C., Rothschild, J., & Finney, P. (2012). Effects of germination
474
on the nutritional profile of gluten-free cereals and pseudocereals: A review.
475
Cereal Chemistry, 89, 1–14.
476
Quayson, E. T., Atwell, W., Morris, C. F., & Marti, A. (2016a). Empirical rheology
477
and pasting properties of soft-textured durum wheat (Triticum turgidum ssp.
478
durum) and hard-textured common wheat (T. aestivum). Journal of Cereal
479
Science, 69, 252–258.
480
Quayson, E. T., Marti, A., Bonomi, F., Atwell, W., & Seetharaman, K. (2016b).
481
Structural Modification of Gluten Proteins in Strong and Weak Wheat Dough as
482
Affected by Mixing Temperature. Cereal Chemistry, 93(2), 189–195.
M
AN
US
CR
IP
T
AC
CE
PT
ED
Richter, K., Christiansen, K., & Guo, G. (2014). Wheat sprouting enhances bread
484
baking performance. Cereal Foods World, 59, 231–233.
485
Sanz Penella, J. M., Collar, C., & Haros, M. (2008). Effect of wheat bran and enzyme
486
addition on dough functional performance and phytic acid levels in bread.
487
Journal of Cereal Science, 48, 715–721.
488
Scanlon, M. G., & Zghal, M. C. (2001). Bread properties and crumb structure. Food
489
Research International, 34, 841-864.
490
Singh, A. K., Rehal, J., Kaur, A., & Jyot, G. (2015). Enhancement of Attributes of
491
Cereals by Germination and Fermentation: A Review. Critical Reviews in Food
492
Science and Nutrition, 55, 1575–1589.
493
Świeca, M., Dziki, D., & Gawlik-Dziki, U. (2017). Starch and protein analysis of
494
wheat bread enriched with phenolics-rich sprouted wheat flour. Food Chemistry,
495
228, 643-648.
496
Verheyen, C., Jekle, M., & Becker, T. (2014). Effects of Saccharomyces cerevisiae on
497
the structural kinetics of wheat dough during fermentation. LWT - Food Science
498
and Technology, 58, 194–202.
499 500
M
AN
US
CR
IP
T
AC
CE
PT
ED
Fig. 1. Pictures of the bread prepared from commercial wheat flour (CTRL), with
501
either 50% level of sprouted wheat flour (50% SWF), or 100% sprouted wheat flour
502
(100% SWF).
503
Fig. 2. Area of each dimensional class of pores. Colors used: black: CTRL; light grey:
504
50% SWF; dark grey: 100% SWF. Different letters indicate significant differences
505
(one-way ANOVA, LSD test, p≤0.05).
506
Fig. 3. Crumb firmness of bread prepared from commercial wheat flour (CTRL –
507
black circle), blend with 50% of sprouted wheat flour (50% SWF – white circle),
508
100% sprouted wheat flour (100% SWF – black triangle) during storage. Different
509
letters indicate correspond significant differences (one-way ANOVA, LSD test,
510
p≤0.05).
511
Fig. 4. Rapidly (RDS, black bars) and Slowly (SDS, grey bars) digestible starch
512
fractions of bread prepared from commercial wheat flour (CTRL), blend with 50% of
513
sprouted wheat flour (50% SWF) and 100% sprouted wheat flour (100% SWF).
514
Different letters (lowercase letters refer to RDS; capital letters refer to SDS) indicate
515
significant differences (one-way ANOVA, LSD test, p≤0.05).
M
AN
US
CR
IP
T
AC
CE
PT
ED
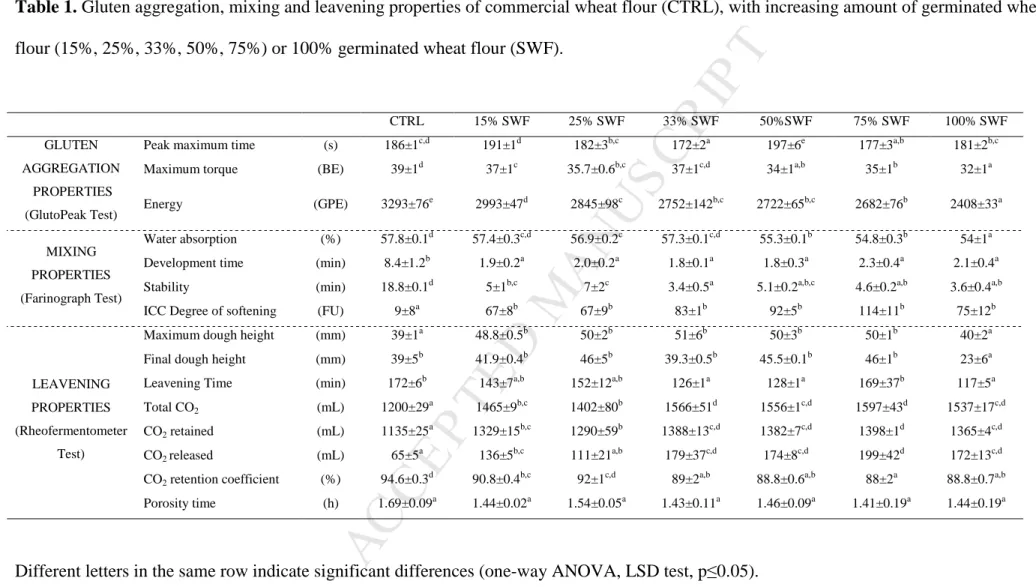
Table 1. Gluten aggregation, mixing and leavening properties of commercial wheat flour (CTRL), with increasing amount of germinated wheat
flour (15%, 25%, 33%, 50%, 75%) or 100% germinated wheat flour (SWF).
Different letters in the same row indicate significant differences (one-way ANOVA, LSD test, p≤0.05).
CTRL 15% SWF 25% SWF 33% SWF 50%SWF 75% SWF 100% SWF
GLUTEN AGGREGATION
PROPERTIES (GlutoPeak Test)
Peak maximum time (s) 186±1c,d 191±1d 182±3b,c 172±2a 197±6e 177±3a,b 181±2b,c
Maximum torque (BE) 39±1d 37±1c 35.7±0.6b,c 37±1c,d 34±1a,b 35±1b 32±1a
Energy (GPE) 3293±76e 2993±47d 2845±98c 2752±142b,c 2722±65b,c 2682±76b 2408±33a
MIXING PROPERTIES (Farinograph Test)
Water absorption (%) 57.8±0.1d 57.4±0.3c,d 56.9±0.2c 57.3±0.1c,d 55.3±0.1b 54.8±0.3b 54±1a
Development time (min) 8.4±1.2b 1.9±0.2a 2.0±0.2a 1.8±0.1a 1.8±0.3a 2.3±0.4a 2.1±0.4a
Stability (min) 18.8±0.1d 5±1b,c 7±2c 3.4±0.5a 5.1±0.2a,b,c 4.6±0.2a,b 3.6±0.4a,b
ICC Degree of softening (FU) 9±8a 67±8b 67±9b 83±1b 92±5b 114±11b 75±12b
LEAVENING PROPERTIES (Rheofermentometer
Test)
Maximum dough height (mm) 39±1a 48.8±0.5b 50±2b 51±6b 50±3b 50±1b 40±2a
Final dough height (mm) 39±5b 41.9±0.4b 46±5b 39.3±0.5b 45.5±0.1b 46±1b 23±6a
Leavening Time (min) 172±6b 143±7a,b 152±12a,b 126±1a 128±1a 169±37b 117±5a
Total CO2 (mL) 1200±29a 1465±9b,c 1402±80b 1566±51d 1556±1c,d 1597±43d 1537±17c,d
CO2 retained (mL) 1135±25a 1329±15b,c 1290±59b 1388±13c,d 1382±7c,d 1398±1d 1365±4c,d
CO2 released (mL) 65±5
a
136±5b,c 111±21a,b 179±37c,d 174±8c,d 199±42d 172±13c,d CO2 retention coefficient (%) 94.6±0.3d 90.8±0.4b,c 92±1c,d 89±2a,b 88.8±0.6a,b 88±2a 88.8±0.7a,b
M
AN
US
CR
IP
T
AC
CE
PT
ED
CTRL, control wheat flour; SWF, flour from sprouted wheat
Peak maximum time: time before torque decreased due to gluten break down; Maximum torque: peak occurring as gluten aggregates; Energy:
area under the curve until 15s after the maximum torque; Water absorption: amount of water needed to reach the optimal consistency (500±20
FU); Dough development time: time from first addition of water to the point of maximum consistency range; Stability: time difference between
when the curve reaches (arrival time) and leaves (departure time) the 500 FU line; Degree of softening: difference between the centre of the
curve at the end of the dough development time and the centre of the curve 12 minutes after this pint; Maximum dough height: maximum height
achieved during the test; Final dough height: height at the end of the test; Leavening time: time required for maximum dough development;
Maximum height: maximum height of gaseous production; Porosity time: time when the porosity of the dough developed; Total CO2: total
production of CO2; CO2 retained: amount of CO2 retained in the dough during the test; CO2 released: amount of CO2 released during the test;
CO2 retention coefficient: ratio between CO2 retained and total CO2.
M
AN
US
CR
IP
T
AC
CE
PT
ED
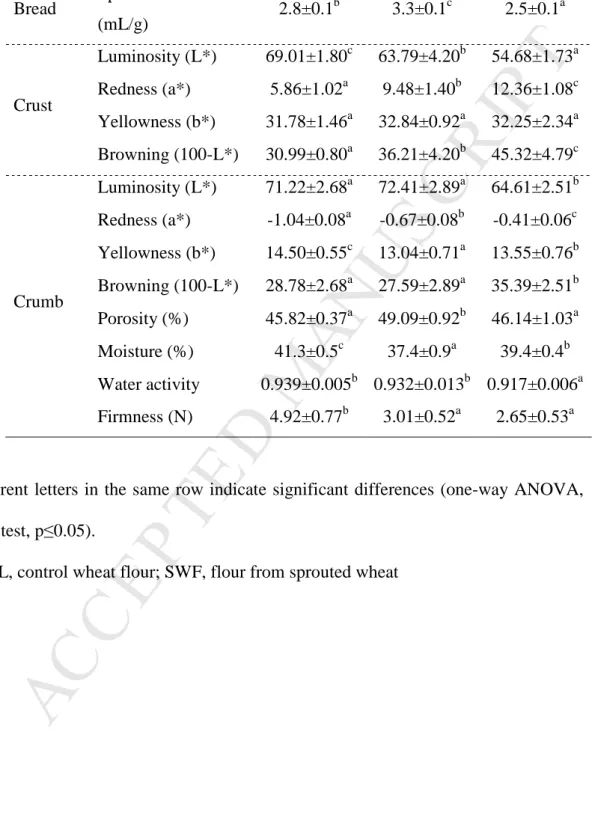
Table 2. Properties of fresh bread from commercial wheat flour alone (CTRL) or with
sprouted wheat flour (50%, 100% SWF).
Different letters in the same row indicate significant differences (one-way ANOVA, LSD test, p≤0.05).
CTRL, control wheat flour; SWF, flour from sprouted wheat
CTRL 50% SWF 100% SWF Bread Specific volume
(mL/g) 2.8±0.1 b 3.3±0.1c 2.5±0.1a Crust Luminosity (L*) 69.01±1.80c 63.79±4.20b 54.68±1.73a Redness (a*) 5.86±1.02a 9.48±1.40b 12.36±1.08c Yellowness (b*) 31.78±1.46a 32.84±0.92a 32.25±2.34a Browning (100-L*) 30.99±0.80a 36.21±4.20b 45.32±4.79c Crumb Luminosity (L*) 71.22±2.68a 72.41±2.89a 64.61±2.51b Redness (a*) -1.04±0.08a -0.67±0.08b -0.41±0.06c Yellowness (b*) 14.50±0.55c 13.04±0.71a 13.55±0.76b Browning (100-L*) 28.78±2.68a 27.59±2.89a 35.39±2.51b Porosity (%) 45.82±0.37a 49.09±0.92b 46.14±1.03a Moisture (%) 41.3±0.5c 37.4±0.9a 39.4±0.4b Water activity 0.939±0.005b 0.932±0.013b 0.917±0.006a Firmness (N) 4.92±0.77b 3.01±0.52a 2.65±0.53a
M
AN
US
CR
IP
T
AC
CE
PT
ED
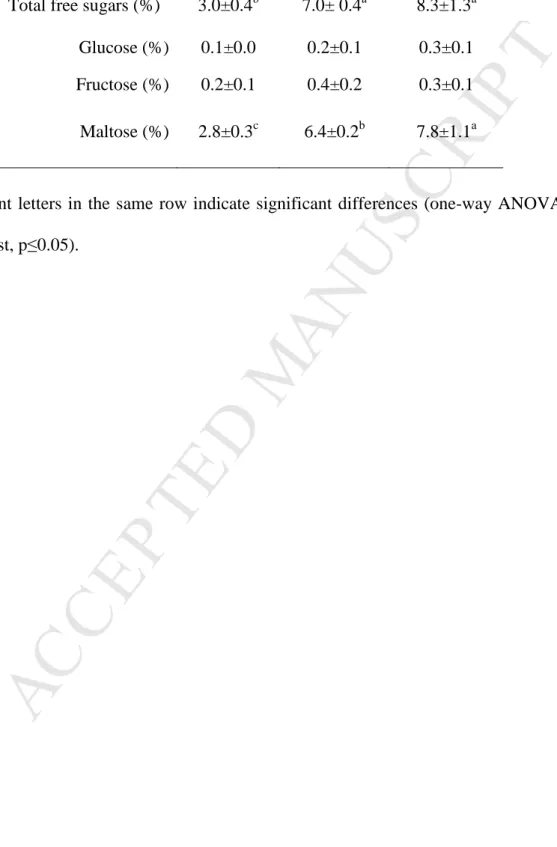
Table 3. Free sugars content of fresh bread from commercial wheat flour alone
(CTRL) or with sprouted wheat flour (50%, 100% SWF).
Different letters in the same row indicate significant differences (one-way ANOVA, LSD test, p≤0.05).
CTRL 50%SWF 100% SWF Total free sugars (%) 3.0±0.4b 7.0± 0.4a 8.3±1.3a
Glucose (%) 0.1±0.0 0.2±0.1 0.3±0.1 Fructose (%) 0.2±0.1 0.4±0.2 0.3±0.1 Maltose (%) 2.8±0.3c 6.4±0.2b 7.8±1.1a
M
AN
US
CR
IP
T
AC
CE
PT
ED
Fig. 1. Pictures of the bread prepared from commercial wheat flour (CTRL), with
either 50% level of sprouted wheat flour (50% SWF), or 100% sprouted wheat flour (100% SWF).
M
AN
US
CR
IP
T
AC
CE
PT
ED
Fig. 2. Area of each dimensional class of pores. Colors used: black: CTRL; light
grey: 50% SWF; dark grey: 100% SWF. Different letters indicate significant differences (one-way ANOVA, LSD test, p≤0.05).
M
AN
US
CR
IP
T
AC
CE
PT
ED
Fig. 3. Crumb firmness of bread prepared from commercial wheat flour (CTRL –
black circle), blend with 50% of sprouted wheat flour (50% SWF – white circle), 100% sprouted wheat flour (100% SWF – black triangle) during storage. Different letters indicate correspond significant differences (one-way ANOVA, LSD test, p≤0.05).
M
AN
US
CR
IP
T
AC
CE
PT
ED
Fig. 4. Rapidly (RDS, black bars) and Slowly (SDS, grey bars) digestible starch
fractions of bread prepared from commercial wheat flour (CTRL), blend with 50% of sprouted wheat flour (50% SWF) and 100% sprouted wheat flour (100% SWF). Different letters (lowercase letters refer to RDS; capital letters refer to SDS) indicate significant differences (one-way ANOVA, LSD test, p≤0.05).
b
a
c
B B
M
AN
US
CR
IP
T
AC
CE
PT
ED
Highlights:• Sprouting was carried out in an industrial plant under controlled conditions
• High levels of wheat flour (SWF) enrichment affect dough rheology
• SWF improved the dough development and gas production during leavening
• The best bread performance was obtained with 50% SWF